CASP14 Data Assisted Modeling (KIharalab)
•Download as PPTX, PDF•
0 likes•273 views

These slides are based on our presentation at CASP14 on Day 3, Dec 3, 2020, in the Satellite session of the data-assisted modeling category. Modified to add some more explanation.

Recommended
Recommended
More Related Content
What's hot
What's hot (16)
Similar to CASP14 Data Assisted Modeling (KIharalab)
Similar to CASP14 Data Assisted Modeling (KIharalab) (20)
More from Purdue University
More from Purdue University (10)
Recently uploaded
Recently uploaded (20)
CASP14 Data Assisted Modeling (KIharalab)
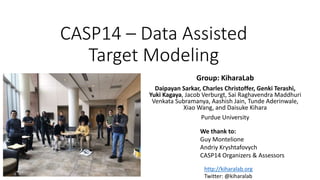
- 1. CASP14 – Data Assisted Target Modeling Group: KiharaLab Daipayan Sarkar, Charles Christoffer, Genki Terashi, Yuki Kagaya, Jacob Verburgt, Sai Raghavendra Maddhuri Venkata Subramanya, Aashish Jain, Tunde Aderinwale, Xiao Wang, and Daisuke Kihara Purdue University We thank to: Guy Montelione Andriy Kryshtafovych CASP14 Organizers & Assessors http://kiharalab.org Twitter: @kiharalab
- 2. Context • This slides are based on our presentation at CASP14 on Day 3, Dec 3, 2020, in the Satellite session of the data-assisted modeling category, which was held in the afternoon. Modified to add some more explanation. • By the time of the meeting, only one data-assisted target, N1088, has a solved structure. • Our group did well in this modeling, and this was used to explain our procedure of modeling.
- 3. Performance of NMR data assisted target refinement (N1088) (See also Assessors slides for Data-assisted modeling when made available) https://predictioncenter.org/casp14/
- 4. Question from Organizer: NMR Data used for selecting models or sampling? We used it for Both 1. From our structure modeling pipeline, AttentiveDist, we selected one starting model according to the agreement of the NOESY data 2. Ran MD-based refinements using the NOESY data as constraints with tolerance of 2, 4, 10 Å, respecitvely. Also ran another MD refinement without NOESY constraints but with flat-bottom restraints to keep the structures to the starting model 3. Structures in MD frames clustered and selected manually
- 5. NMR data assisted target refinement (N1088) Initial model selection NMR data-guided MD Final model selection Flat-bottom (FB) harmonic restraints using Colvars NMR distance restraints (NOESY spectrum ) using Colvars Initial equilibration MD using CHARMM36m in NAMD v2.14 Production MD (FB): 100 ns x 3 replica = 300 ns Production MD (NMR): 25 ns per constraint satisfaction tolerance (2, 4, 10 Å) = 75 ns Percentage constraints satisfied and Ranksum (within 2 Å) Initial 56.36 % Final 57.46 % Sidechain conformational change between initial and final models. PyRosetta A model selected by agreement of constraints AttentiveDist (bioRxiv)
- 6. Constraint Satisfaction in Model 1, Model 2, & Model5 0 Å: 22.59% 2 Å: 57.46% 0 Å: 28.92% 2 Å: 58.77% 0 Å: 28.95% 2 Å: 61.84% Model 1 structure was selected because it maintains good conformation yet increased the number of satisfied constraints. Model 2 and 5 are selected solely because they have maximum number of NOESY constraints satisfied. Satisfied Constraints within 0 and 2 Å
- 7. Difficulty • The NOESY data seem to include signals from different conformations and noise. • Thus, forcing a model to satisfy many constraints corrupted the structure. • Separating signals for different conformations and noise is challenging.
Editor's Notes
- Percentage of contacts initially Percentage of contacts final top and within 2 A Picture of initial and top model with sc RMSD from starting model Table https://predictioncenter.org/casp14/results.cgi