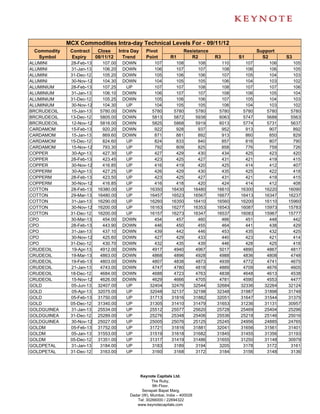
2. MCX Commodities Intra-day Technical Levels For - 09/11/12
Commodity Contract Close Intra Day Pivot Resistance Support
Symbol Expiry 08/11/12 Trend Point R1 R2 R3 S1 S2 S3
GOLDPETAL 30-Nov-12 3135.00 UP 3133 3140 3146 3159 3127 3120 3107
GOLDPTLDEL 31-Jan-13 3186.00 UP 3184 3193 3200 3216 3177 3168 3152
GOLDPTLDEL 31-Dec-12 3166.00 DOWN 3168 3178 3190 3212 3156 3146 3124
GOLDPTLDEL 30-Nov-12 3151.00 DOWN 3155 3162 3173 3191 3144 3137 3119
KAPAS 30-Mar-13 948.30 UP 946 954 959 973 940 932 918
KAPAS 30-Apr-13 973.30 UP 970 980 986 1002 964 955 939
KAPASKHALI 30-Mar-13 1517.50 DOWN 1520 1528 1539 1558 1509 1501 1482
KAPASKHALI 28-Feb-13 1513.50 UP 1512 1521 1528 1544 1505 1496 1480
KAPASKHALI 31-Jan-13 1495.00 UP 1493 1504 1513 1533 1484 1473 1453
KAPASKHALI 31-Dec-12 1486.50 UP 1485 1495 1503 1521 1477 1467 1449
LEAD 28-Feb-13 119.65 UP 119 121 122 124 118 117 114
LEAD 31-Jan-13 120.50 UP 120 121 122 125 119 117 114
LEAD 31-Dec-12 120.95 UP 120 122 123 126 119 117 114
LEAD 30-Nov-12 121.20 UP 120 122 123 126 119 117 115
LEADMINI 28-Feb-13 120.30 UP 120 121 122 125 119 117 114
LEADMINI 31-Jan-13 120.70 UP 120 122 123 125 119 117 114
LEADMINI 31-Dec-12 120.95 UP 120 122 123 126 119 117 114
LEADMINI 30-Nov-12 121.15 UP 120 122 123 126 119 117 115
MENTHAOIL 28-Feb-13 1196.50 DOWN 1198 1204 1211 1224 1191 1185 1172
MENTHAOIL 31-Jan-13 1194.90 DOWN 1198 1202 1210 1221 1190 1186 1174
MENTHAOIL 31-Dec-12 1187.50 DOWN 1191 1198 1209 1227 1180 1172 1154
MENTHAOIL 30-Nov-12 1173.40 DOWN 1177 1184 1194 1210 1167 1160 1143
NATURALGAS 28-Jan-13 205.80 UP 205 207 208 212 204 201 198
NATURALGAS 26-Dec-12 204.10 UP 203 206 207 211 202 199 196
NATURALGAS 27-Nov-12 195.70 UP 195 197 199 203 193 191 187
NICKEL 28-Feb-13 908.30 UP 906 912 916 927 902 895 884
NICKEL 31-Jan-13 897.50 UP 895 902 907 919 890 882 870
NICKEL 31-Dec-12 887.40 UP 884 893 898 911 879 871 857
NICKEL 30-Nov-12 878.80 UP 875 884 889 904 870 861 847
NICKELM 28-Feb-13 907.50 UP 907 911 914 921 904 900 893
NICKELM 31-Jan-13 898.70 UP 895 903 908 920 891 883 871
NICKELM 31-Dec-12 887.70 UP 885 893 898 911 880 872 859
NICKELM 30-Nov-12 878.90 UP 876 884 890 904 870 862 848
POTATO 15-Apr-13 698.70 UP 698 701 704 710 696 693 687
POTATO 15-Mar-13 731.00 DOWN 731 732 733 735 730 729 727
POTATO 15-May-13 729.00 UP 729 730 731 734 728 726 723
SILVER 04-May-13 63178.00 UP 63069 63409 63639 64209 62839 62499 61929
SILVER 05-Mar-13 61751.00 UP 61560 62041 62330 63100 61271 60790 60020
SILVER 05-Dec-12 59881.00 UP 59698 60182 60484 61270 59396 58912 58126
SILVER1000 31-Dec-12 60288.00 UP 60216 60507 60725 61234 59998 59707 59198
SILVER1000 30-Nov-12 59798.00 UP 59725 60250 60702 61679 59273 58748 57771
SILVERM 30-Apr-13 63309.00 UP 63132 63577 63846 64560 62863 62418 61704
SILVERM 28-Feb-13 61776.00 UP 61593 62074 62373 63153 61294 60813 60033
SILVERM 30-Nov-12 59905.00 UP 59718 60212 60519 61320 59411 58917 58116
SILVERMIC 30-Apr-13 63278.00 UP 63055 63623 63968 64881 62710 62142 61229
SILVERMIC 28-Feb-13 61761.00 UP 61579 62053 62344 63109 61288 60814 60049
Keynote Capitals Ltd.
The Ruby,
9th Floor,
Senapati Bapat Marg,
Dadar (W), Mumbai, India – 400028
Tel: 30266000 / 22694322
www.keynotecapitals.com
3. MCX Commodities Intra-day Technical Levels For - 09/11/12
Commodity Contract Close Intra Day Pivot Resistance Support
Symbol Expiry 08/11/12 Trend Point R1 R2 R3 S1 S2 S3
SILVERMIC 30-Nov-12 59899.00 UP 59720 60199 60499 61278 59420 58941 58162
STEELRPR 18-Jan-13 31010.00 DOWN 31130 31320 31630 32130 30820 30630 30130
STEELRPR 20-Dec-12 30880.00 DOWN 30967 31073 31267 31567 30773 30667 30367
ZINC 28-Feb-13 106.55 UP 107 107 107 108 106 106 105
ZINC 31-Jan-13 105.70 UP 105 106 107 108 105 104 103
ZINC 31-Dec-12 104.90 UP 104 105 106 108 104 103 101
ZINC 30-Nov-12 103.85 UP 103 105 105 107 103 101 100
ZINCMINI 28-Feb-13 106.55 UP 106 107 107 108 106 105 104
ZINCMINI 31-Jan-13 105.70 UP 105 106 107 108 105 104 103
ZINCMINI 31-Dec-12 104.85 UP 104 105 106 108 104 103 101
ZINCMINI 30-Nov-12 103.80 UP 103 104 105 107 103 101 100
Sanjay Bhatia (AVP – Technical Research), Email Id sanjay@keynotecapitals.net
Pivot Point: Intra- Day Trading Tool. - The key to the use of this tool is the use of Stop Loss
Intra Day Trend: It is valid only till the point where Price trades above Pivot Point. For Eg. “UP” would be valid till Price
remains above Pivot Point. It would become “DOWN” in event Price trades below Pivot Point.
Pivot Point (PP): This is a trigger point for Intra Day Buy / Sell based on the price range of the previous day.
R1: Resistance 1: 1st Resistance level over Pivot Point, R2: Resistance 2: Next Resistance level after R1.
R3: Resistance 3: Next Resistance level after R2.
S1: Support 1: 1st Support level after Pivot Point, S2: Support 2: Next Support level after S1.
S3: Support 3: Next Support level after S2.
Note: As per this tool, the trader should take BUY position just above the Pivot Point and keep the Pivot Point level as stop
loss and the first target would be R1 level (Resistance 1). If R1 is crossed then R2 (Resistance 2) becomes the next target
with the stop loss placed at R1 level. If R2 is crossed then R3 (Resistance 3) becomes the next target with the stop loss
placed at R2 level.
Similarly if price goes below the Pivot Point the trader should take a SELL position and keep the Pivot Point level as the
stop loss and the first target would be S1 level (Support 1). If S1 level is breached then S2 level (Support 2) becomes the
next target with the stop loss placed at S1 level. If S2 level is breached then S3 level (Support 3) becomes the next target
with the stop loss placed at S2 level.
Disclaimer: This document is not for public distribution and has been furnished to you solely for your information and must not be reproduced or
redistributed to any other person. Persons into whose possession this document may come are required to observe these restrictions. This material is
for the personal information of the authorized recipient, and we are not soliciting any action based upon it. This report is not to be construed as an offer
to sell or the solicitation of an offer to buy any security in any jurisdiction where such an offer or solicitation would be illegal. It is for the general
information of clients of Keynote Capitals Ltd. It does not constitute a personal recommendation or take into account the particular investment
objectives, financial situations, or needs of individual clients. We have reviewed the report, and in so far as it includes current or historical information,
it is believed to be reliable though its accuracy or completeness cannot be guaranteed. Neither Keynote Capitals Ltd., nor any person connected with
it, accepts any liability arising from the use of this document. The recipients of this material should rely on their own investigations and take their own
professional advice. Price and value of the investments referred to in this material may go up or down. Past performance is not a guide for future
performance. Certain transactions -including those involving futures, options and other derivatives as well as non-investment grade securities - involve
substantial risk and are not suitable for all investors. Reports based on technical analysis centers on studying charts of a stock’s price movement and
trading volume, as opposed to focusing on a company’s fundamentals and as such, may not match with a report on a company’s fundamentals.
Opinions expressed are our current opinions as of the date appearing on this material only. While we endeavor to update on a reasonable basis the
information discussed in this material, there may be regulatory, compliance, or other reasons that prevent us from doing so. Prospective investors and
others are cautioned that any forward-looking statements are not predictions and may be subject to change without notice. Our proprietary trading and
investment businesses may make investment decisions that are inconsistent with the recommendations expressed herein. We and our affiliates,
officers, directors, and employees world wide may: (a) from time to time, have long or short positions in, and buy or sell the securities thereof, of
company (ies) mentioned herein or (b) be engaged in any other transaction involving such securities and earn brokerage or other compensation or act
as a market maker in the financial instruments of the company (ies) discussed herein or act as advisor or lender / borrower to such company (ies) or
have other potential conflict of interest with respect to any recommendation and related information and opinions. The analyst for this report certifies
that all of the views expressed in this report accurately reflect his or her personal views about the subject company or companies and its or their
securities, and no part of his or her compensation was, is or will be, directly or indirectly related to specific recommendations or views expressed in this
report. No part of this material may be duplicated in any form and/or redistributed without Keynote Capitals Ltd’s., prior written consent.
Keynote Capitals Ltd.
The Ruby,
9th Floor,
Senapati Bapat Marg,
Dadar (W), Mumbai, India – 400028
Tel: 30266000 / 22694322
www.keynotecapitals.com