Keynote technicals commodity intraday levels for 240912
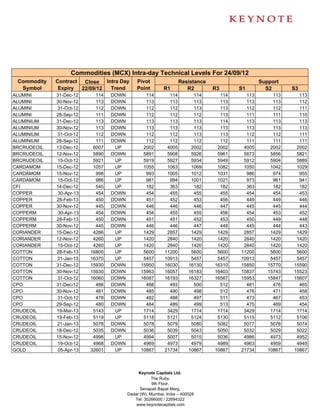
1. Commodities (MCX) Intra-day Technical Levels For 24/09/12
Commodity Contract Close Intra Day Pivot Resistance Support
Symbol Expiry 22/09/12 Trend Point R1 R2 R3 S1 S2 S3
ALUMINI 31-Dec-12 114 DOWN 114 114 114 114 113 113 113
ALUMINI 30-Nov-12 113 DOWN 113 113 113 113 113 113 112
ALUMINI 31-Oct-12 112 DOWN 112 112 113 113 112 112 111
ALUMINI 28-Sep-12 111 DOWN 112 112 112 113 111 111 110
ALUMINIUM 31-Dec-12 113 DOWN 113 113 113 114 113 113 113
ALUMINIUM 30-Nov-12 113 DOWN 113 113 113 113 113 113 113
ALUMINIUM 31-Oct-12 112 DOWN 112 112 113 113 112 112 111
ALUMINIUM 28-Sep-12 111 DOWN 112 112 112 112 111 111 111
BRCRUDEOIL 13-Dec-12 6007 UP 2002 4005 2002 2002 4005 2002 2002
BRCRUDEOIL 12-Nov-12 5890 DOWN 5891 5908 5926 5961 5873 5856 5821
BRCRUDEOIL 15-Oct-12 5921 UP 5919 5927 5934 5949 5912 5904 5889
CARDAMOM 15-Dec-12 1057 UP 1055 1063 1069 1082 1050 1042 1029
CARDAMOM 15-Nov-12 998 UP 993 1005 1012 1031 986 974 955
CARDAMOM 15-Oct-12 986 UP 981 994 1001 1021 973 961 941
CFI 14-Dec-12 545 UP 182 363 182 182 363 182 182
COPPER 30-Apr-13 454 DOWN 454 455 455 455 454 454 453
COPPER 28-Feb-13 450 DOWN 451 452 453 456 449 449 446
COPPER 30-Nov-12 445 DOWN 446 446 446 447 445 445 444
COPPERM 30-Apr-13 454 DOWN 454 455 455 456 454 453 452
COPPERM 28-Feb-13 450 DOWN 451 451 452 453 450 449 448
COPPERM 30-Nov-12 445 DOWN 446 446 447 448 445 444 443
CORIANDER 15-Dec-12 4286 UP 1429 2857 1429 1429 2857 1429 1429
CORIANDER 12-Nov-12 4260 UP 1420 2840 1420 1420 2840 1420 1420
CORIANDER 15-Oct-12 4260 UP 1420 2840 1420 1420 2840 1420 1420
COTTON 28-Feb-13 16800 UP 5600 11200 5600 5600 11200 5600 5600
COTTON 31-Jan-13 16370 UP 5457 10913 5457 5457 10913 5457 5457
COTTON 31-Dec-12 15930 DOWN 15950 16030 16130 16310 15850 15770 15590
COTTON 30-Nov-12 15930 DOWN 15963 16057 16183 16403 15837 15743 15523
COTTON 31-Oct-12 16060 DOWN 16087 16193 16327 16567 15953 15847 15607
CPO 31-Dec-12 486 DOWN 488 493 500 512 481 476 465
CPO 30-Nov-12 481 DOWN 485 490 498 512 476 471 458
CPO 31-Oct-12 478 DOWN 482 488 497 511 473 467 453
CPO 29-Sep-12 480 DOWN 484 489 499 513 475 469 454
CRUDEOIL 19-Mar-13 5143 UP 1714 3429 1714 1714 3429 1714 1714
CRUDEOIL 19-Feb-13 5119 UP 5118 5121 5124 5130 5115 5112 5106
CRUDEOIL 21-Jan-13 5078 DOWN 5078 5079 5080 5082 5077 5076 5074
CRUDEOIL 18-Dec-12 5035 DOWN 5036 5039 5043 5050 5032 5029 5022
CRUDEOIL 15-Nov-12 4998 UP 4994 5007 5015 5036 4986 4973 4952
CRUDEOIL 19-Oct-12 4968 DOWN 4969 4973 4979 4989 4963 4959 4949
GOLD 05-Apr-13 32601 UP 10867 21734 10867 10867 21734 10867 10867
Keynote Capitals Ltd.
The Ruby,
9th Floor,
Senapati Bapat Marg,
Dadar (W), Mumbai, India – 400028
Tel: 30266000 / 22694322
www.keynotecapitals.com
2. Commodities (MCX) Intra-day Technical Levels For 24/09/12
Commodity Contract Close Intra Day Pivot Resistance Support
Symbol Expiry 22/09/12 Trend Point R1 R2 R3 S1 S2 S3
GOLD 05-Feb-13 32160 DOWN 32163 32185 32210 32257 32138 32116 32069
GOLD 05-Dec-12 31803 UP 31796 31827 31851 31906 31772 31741 31686
GOLD 05-Oct-12 31506 UP 31498 31540 31575 31652 31463 31421 31344
GOLDGUINEA 30-Nov-12 25509 DOWN 25520 25570 25631 25742 25459 25409 25298
GOLDGUINEA 31-Oct-12 25410 DOWN 25423 25475 25540 25657 25358 25306 25189
GOLDGUINEA 29-Sep-12 25376 DOWN 25377 25410 25444 25511 25343 25310 25243
GOLDM 05-Dec-12 31818 UP 31817 31850 31881 31945 31786 31753 31689
GOLDM 05-Nov-12 31663 DOWN 31666 31707 31750 31834 31623 31582 31498
GOLDM 05-Oct-12 31546 UP 31535 31579 31611 31687 31503 31459 31383
GOLDPETAL 30-Nov-12 3196 DOWN 3197 3202 3207 3217 3192 3187 3177
GOLDPETAL 31-Oct-12 3183 DOWN 3184 3188 3193 3202 3179 3175 3166
GOLDPETAL 29-Sep-12 3179 DOWN 3184 3190 3202 3220 3172 3166 3148
GOLDPTLDEL 30-Nov-12 3287 UP 3281 3311 3334 3387 3258 3228 3175
GOLDPTLDEL 31-Oct-12 3312 UP 3296 3331 3350 3404 3277 3242 3188
GOLDPTLDEL 29-Sep-12 3305 UP 3300 3335 3365 3430 3270 3235 3170
IRONORE 31-Oct-12 5117 UP 1706 3411 1706 1706 3411 1706 1706
IRONORE 28-Sep-12 5098 UP 1699 3399 1699 1699 3399 1699 1699
KAPAS 30-Apr-13 893 DOWN 900 913 932 964 881 868 837
KAPAS 30-Mar-13 873 DOWN 876 885 896 916 865 856 836
LEAD 31-Dec-12 122 UP 121 122 122 122 121 121 121
LEAD 30-Nov-12 121 DOWN 121 121 122 122 121 121 121
LEAD 31-Oct-12 121 DOWN 121 121 122 122 121 121 120
LEAD 28-Sep-12 121 DOWN 121 121 121 122 121 121 120
LEADMINI 31-Dec-12 121 DOWN 121 122 122 122 121 121 121
LEADMINI 30-Nov-12 121 DOWN 121 121 122 122 121 121 120
LEADMINI 31-Oct-12 121 DOWN 121 121 122 122 121 121 120
LEADMINI 28-Sep-12 121 DOWN 121 121 122 122 121 120 120
MAIZE 20-Dec-12 1279 UP 426 852 426 426 852 426 426
MAIZE 20-Nov-12 1449 UP 483 966 483 483 966 483 483
MAIZE 19-Oct-12 1453 UP 484 969 484 484 969 484 484
MENTHAOIL 31-Dec-12 1217 DOWN 1235 1261 1304 1373 1192 1166 1097
MENTHAOIL 30-Nov-12 1200 DOWN 1210 1225 1250 1291 1185 1170 1130
MENTHAOIL 31-Oct-12 1191 DOWN 1202 1219 1248 1294 1174 1156 1111
MENTHAOIL 29-Sep-12 1174 DOWN 1185 1202 1231 1277 1157 1140 1094
NATURALGAS 27-Nov-12 179 UP 179 180 181 183 178 177 175
NATURALGAS 26-Oct-12 164 UP 164 164 165 166 163 163 161
NATURALGAS 25-Sep-12 154 DOWN 154 154 155 155 153 153 152
NICKEL 31-Dec-12 988 UP 329 658 329 329 658 329 329
NICKEL 30-Nov-12 975 UP 975 977 978 981 973 972 968
NICKEL 31-Oct-12 967 DOWN 967 969 970 972 966 965 962
Keynote Capitals Ltd.
The Ruby,
9th Floor,
Senapati Bapat Marg,
Dadar (W), Mumbai, India – 400028
Tel: 30266000 / 22694322
www.keynotecapitals.com
3. Commodities (MCX) Intra-day Technical Levels For 24/09/12
Commodity Contract Close Intra Day Pivot Resistance Support
Symbol Expiry 22/09/12 Trend Point R1 R2 R3 S1 S2 S3
NICKEL 28-Sep-12 960 DOWN 960 962 963 966 959 958 955
NICKELM 31-Dec-12 982 UP 982 983 984 987 981 980 978
NICKELM 30-Nov-12 975 DOWN 986 997 1019 1052 964 953 920
NICKELM 31-Oct-12 967 DOWN 968 969 970 973 966 965 962
NICKELM 28-Sep-12 960 DOWN 961 963 965 970 958 956 952
POTATO 15-Apr-13 709 UP 709 712 715 722 705 702 695
POTATO 15-Mar-13 743 UP 742 747 750 758 739 735 727
POTATO 15-Oct-12 1050 UP 1049 1055 1061 1073 1043 1036 1024
POTATOTRWR 15-Oct-12 976 UP 972 983 990 1008 965 954 936
REFSOYOIL 15-Dec-12 773 UP 258 515 258 258 515 258 258
REFSOYOIL 15-Nov-12 785 UP 262 523 262 262 523 262 262
REFSOYOIL 15-Oct-12 785 UP 262 523 262 262 523 262 262
SILVER 04-May-13 66648 DOWN 66648 66648 66648 66648 66648 66648 66648
SILVER 05-Mar-13 64984 DOWN 64988 65096 65208 65428 64876 64768 64548
SILVER 05-Dec-12 63277 DOWN 63329 63507 63737 64145 63099 62921 62513
SILVERM 30-Apr-13 66541 DOWN 66583 66686 66830 67077 66439 66336 66089
SILVERM 28-Feb-13 65008 DOWN 65028 65154 65300 65572 64882 64756 64484
SILVERM 30-Nov-12 63294 DOWN 63332 63491 63688 64044 63135 62976 62620
SILVERMIC 30-Apr-13 66574 DOWN 66740 67027 67479 68218 66288 66001 65262
SILVERMIC 28-Feb-13 65013 DOWN 65072 65244 65474 65876 64842 64670 64268
SILVERMIC 30-Nov-12 63296 DOWN 63355 63541 63785 64215 63111 62925 62495
SUGARMKOL 20-Dec-12 3555 UP 1185 2370 1185 1185 2370 1185 1185
SUGARMKOL 20-Nov-12 3631 UP 1210 2421 1210 1210 2421 1210 1210
SUGARMKOL 19-Oct-12 3546 UP 1182 2364 1182 1182 2364 1182 1182
WHEAT 20-Dec-12 1558 UP 519 1039 519 519 1039 519 519
WHEAT 20-Nov-12 1561 UP 520 1040 520 520 1040 520 520
WHEAT 19-Oct-12 1587 UP 529 1058 529 529 1058 529 529
ZINC 31-Dec-12 114 DOWN 114 114 114 114 114 114 114
ZINC 30-Nov-12 113 UP 113 113 113 113 113 113 112
ZINC 31-Oct-12 112 DOWN 112 112 113 113 112 112 112
ZINC 28-Sep-12 111 DOWN 111 112 112 112 111 111 111
ZINCMINI 31-Dec-12 114 DOWN 114 114 114 114 113 113 113
ZINCMINI 30-Nov-12 113 DOWN 113 113 113 113 113 113 113
ZINCMINI 31-Oct-12 112 DOWN 112 112 113 113 112 112 112
Keynote Capitals Ltd.
The Ruby,
9th Floor,
Senapati Bapat Marg,
Dadar (W), Mumbai, India – 400028
Tel: 30266000 / 22694322
www.keynotecapitals.com
4. Commodities (MCX) Intra-day Technical Levels For 24/09/12
Commodity Contract Close Intra Day Pivot Resistance Support
Symbol Expiry 22/09/12 Trend Point R1 R2 R3 S1 S2 S3
ZINCMINI 28-Sep-12 111 DOWN 111 112 112 112 111 111 111
Sanjay Bhatia (AVP – Technical Research), Email Id sanjay@keynotecapitals.net
Pivot Point: Intra- Day Trading Tool. - The key to the use of this tool is the use of Stop Loss
Intra Day Trend: It is valid only till the point where Price trades above Pivot Point. For Eg. “UP” would be valid till Price
remains above Pivot Point. It would become “DOWN” in event Price trades below Pivot Point.
Pivot Point (PP): This is a trigger point for Intra Day Buy / Sell based on the price range of the previous day.
R1: Resistance 1: 1st Resistance level over Pivot Point, R2: Resistance 2: Next Resistance level after R1.
R3: Resistance 3: Next Resistance level after R2.
S1: Support 1: 1st Support level after Pivot Point, S2: Support 2: Next Support level after S1.
S3: Support 3: Next Support level after S2.
Note: As per this tool, the trader should take BUY position just above the Pivot Point and keep the Pivot Point level as stop
loss and the first target would be R1 level (Resistance 1). If R1 is crossed then R2 (Resistance 2) becomes the next target
with the stop loss placed at R1 level. If R2 is crossed then R3 (Resistance 3) becomes the next target with the stop loss
placed at R2 level.
Similarly if price goes below the Pivot Point the trader should take a SELL position and keep the Pivot Point level as the
stop loss and the first target would be S1 level (Support 1). If S1 level is breached then S2 level (Support 2) becomes the
next target with the stop loss placed at S1 level. If S2 level is breached then S3 level (Support 3) becomes the next target
with the stop loss placed at S2 level.
Disclaimer: This document is not for public distribution and has been furnished to you solely for your information and must not be reproduced or
redistributed to any other person. Persons into whose possession this document may come are required to observe these restrictions. This material is
for the personal information of the authorized recipient, and we are not soliciting any action based upon it. This report is not to be construed as an offer
to sell or the solicitation of an offer to buy any security in any jurisdiction where such an offer or solicitation would be illegal. It is for the general
information of clients of Keynote Capitals Ltd. It does not constitute a personal recommendation or take into account the particular investment objectives,
financial situations, or needs of individual clients. We have reviewed the report, and in so far as it includes current or historical information, it is believed
to be reliable though its accuracy or completeness cannot be guaranteed. Neither Keynote Capitals Ltd., nor any person connected with it, accepts any
liability arising from the use of this document. The recipients of this material should rely on their own investigations and take their own professional
advice. Price and value of the investments referred to in this material may go up or down. Past performance is not a guide for future performance.
Certain transactions -including those involving futures, options and other derivatives as well as non-investment grade securities - involve substantial risk
and are not suitable for all investors. Reports based on technical analysis centers on studying charts of a stock’s price movement and trading volume, as
opposed to focusing on a company’s fundamentals and as such, may not match with a report on a company’s fundamentals. Opinions expressed are our
current opinions as of the date appearing on this material only. While we endeavor to update on a reasonable basis the information discussed in this
material, there may be regulatory, compliance, or other reasons that prevent us from doing so. Prospective investors and others are cautioned that any
forward-looking statements are not predictions and may be subject to change without notice. Our proprietary trading and investment businesses may
make investment decisions that are inconsistent with the recommendations expressed herein. We and our affiliates, officers, directors, and employees
world wide may: (a) from time to time, have long or short positions in, and buy or sell the securities thereof, of company (ies) mentioned herein or (b) be
engaged in any other transaction involving such securities and earn brokerage or other compensation or act as a market maker in the financial
instruments of the company (ies) discussed herein or act as advisor or lender / borrower to such company (ies) or have other potential conflict of interest
with respect to any recommendation and related information and opinions. The analyst for this report certifies that all of the views expressed in this
report accurately reflect his or her personal views about the subject company or companies and its or their securities, and no part of his or her
compensation was, is or will be, directly or indirectly related to specific recommendations or views expressed in this report. No part of this material may
be duplicated in any form and/or redistributed without Keynote Capitals Ltd’s., prior written consent.
Keynote Capitals Ltd.
The Ruby,
9th Floor,
Senapati Bapat Marg,
Dadar (W), Mumbai, India – 400028
Tel: 30266000 / 22694322
www.keynotecapitals.com