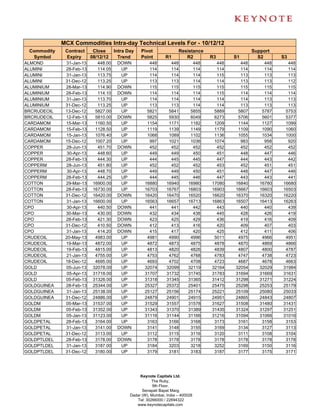
2. MCX Commodities Intra-day Technical Levels For - 10/12/12
Commodity Contract Close Intra Day Pivot Resistance Support
Symbol Expiry 08/12/12 Trend Point R1 R2 R3 S1 S2 S3
KAPAS 30-Mar-13 977.60 DOWN 978 983 989 1000 972 967 956
KAPAS 30-Apr-13 988.60 DOWN 990 997 1005 1021 981 974 959
KAPASKHALI 30-Apr-13 1528.50 DOWN 1529 1536 1544 1559 1521 1514 1499
KAPASKHALI 30-Mar-13 1489.50 DOWN 1492 1498 1506 1519 1484 1479 1465
KAPASKHALI 28-Feb-13 1463.00 DOWN 1466 1469 1476 1486 1459 1456 1446
KAPASKHALI 31-Dec-12 1403.50 DOWN 1405 1409 1414 1423 1400 1396 1387
KAPASKHALI 31-Jan-13 1433.00 DOWN 1435 1439 1445 1454 1429 1426 1416
LEAD 28-Mar-13 121.30 UP 121 122 122 122 121 121 120
LEAD 28-Feb-13 121.25 DOWN 121 122 122 122 121 121 120
LEAD 31-Jan-13 121.20 UP 121 122 122 123 121 120 119
LEAD 31-Dec-12 121.00 UP 121 121 122 123 121 120 119
LEADMINI 28-Mar-13 121.30 DOWN 121 121 122 122 121 121 121
LEADMINI 28-Feb-13 121.35 UP 121 122 122 122 121 121 120
LEADMINI 31-Jan-13 121.15 UP 121 122 122 123 121 120 119
LEADMINI 31-Dec-12 121.00 UP 121 121 122 123 121 120 119
MENTHAOIL 30-Mar-13 1461.50 UP 1458 1473 1485 1511 1446 1431 1405
MENTHAOIL 28-Feb-13 1470.00 UP 1463 1482 1495 1526 1450 1431 1399
MENTHAOIL 31-Jan-13 1478.70 UP 1471 1492 1506 1540 1458 1437 1402
MENTHAOIL 31-Dec-12 1462.80 UP 1455 1478 1493 1531 1440 1417 1380
NATURALGAS 25-Feb-13 197.60 DOWN 198 198 199 201 197 196 195
NATURALGAS 28-Jan-13 196.50 DOWN 197 198 199 200 196 195 194
NATURALGAS 26-Dec-12 193.70 DOWN 194 195 197 199 193 192 189
NICKEL 28-Feb-13 954.20 DOWN 954 954 954 954 954 954 954
NICKEL 31-Jan-13 946.30 UP 946 948 949 952 945 943 940
NICKEL 31-Dec-12 938.50 UP 938 940 941 944 937 935 932
NICKELM 28-Mar-13 959.20 UP 959 960 961 964 958 957 955
NICKELM 28-Feb-13 953.00 DOWN 953 955 956 959 952 950 947
NICKELM 31-Jan-13 946.20 UP 945 948 950 954 944 941 937
NICKELM 31-Dec-12 938.40 UP 938 940 941 945 937 935 932
POTATO 15-Mar-13 718.50 UP 718 721 723 727 716 713 709
POTATO 15-May-13 693.20 UP 692 696 698 704 690 686 680
POTATO 15-Apr-13 691.90 UP 689 697 702 714 684 676 663
SILVER 05-Jul-13 65363.00 DOWN 65367 65404 65445 65523 65326 65289 65211
SILVER 04-May-13 64005.00 UP 63991 64033 64061 64131 63963 63921 63851
SILVER 05-Mar-13 62582.00 UP 62565 62616 62649 62733 62532 62481 62397
SILVER1000 31-Dec-12 61785.00 UP 61593 62185 62584 63575 61194 60602 59611
SILVERM 29-Jun-13 65378.00 DOWN 65384 65419 65461 65538 65342 65307 65230
SILVERM 30-Apr-13 64031.00 UP 63965 64116 64201 64437 63880 63729 63493
SILVERM 28-Feb-13 62600.00 UP 62585 62645 62690 62795 62540 62480 62375
SILVERMIC 29-Jun-13 65397.00 UP 65386 65429 65461 65536 65354 65311 65236
SILVERMIC 30-Apr-13 64035.00 UP 63984 64117 64199 64414 63902 63769 63554
SILVERMIC 28-Feb-13 62600.00 UP 62579 62655 62709 62839 62525 62449 62319
STEELRPR 20-Feb-13 30670.00 UP 30667 30753 30837 31007 30583 30497 30327
STEELRPR 20-Dec-12 29770.00 UP 29710 29900 30030 30350 29580 29390 29070
STEELRPR 18-Jan-13 30260.00 UP 30217 30333 30407 30597 30143 30027 29837
ZINC 28-Feb-13 110.90 DOWN 111 111 111 111 111 111 111
Keynote Capitals Ltd.
The Ruby,
9th Floor,
Senapati Bapat Marg,
Dadar (W), Mumbai, India – 400028
Tel: 30266000 / 22694322
www.keynotecapitals.com
3. MCX Commodities Intra-day Technical Levels For - 10/12/12
Commodity Contract Close Intra Day Pivot Resistance Support
Symbol Expiry 08/12/12 Trend Point R1 R2 R3 S1 S2 S3
ZINC 31-Jan-13 110.45 UP 110 111 111 111 110 110 110
ZINC 31-Dec-12 109.90 UP 110 110 110 110 110 110 109
ZINCMINI 28-Mar-13 111.20 DOWN 111 111 112 112 111 111 111
ZINCMINI 28-Feb-13 110.95 UP 111 111 111 111 111 111 111
ZINCMINI 31-Jan-13 110.50 UP 110 111 111 111 110 110 110
ZINCMINI 31-Dec-12 109.90 UP 110 110 110 110 110 110 109
Sanjay Bhatia (AVP – Technical Research),
Email Id sanjay@keynotecapitals.net
Pivot Point: Intra- Day Trading Tool. - The key to the use of this tool is the use of Stop Loss
Intra Day Trend: It is valid only till the point where Price trades above Pivot Point. For Eg. “UP” would be valid till Price
remains above Pivot Point. It would become “DOWN” in event Price trades below Pivot Point.
Pivot Point (PP): This is a trigger point for Intra Day Buy / Sell based on the price range of the previous day.
R1: Resistance 1: 1st Resistance level over Pivot Point, R2: Resistance 2: Next Resistance level after R1.
R3: Resistance 3: Next Resistance level after R2.
S1: Support 1: 1st Support level after Pivot Point, S2: Support 2: Next Support level after S1.
S3: Support 3: Next Support level after S2.
Note: As per this tool, the trader should take BUY position just above the Pivot Point and keep the Pivot Point level as stop
loss and the first target would be R1 level (Resistance 1). If R1 is crossed then R2 (Resistance 2) becomes the next target
with the stop loss placed at R1 level. If R2 is crossed then R3 (Resistance 3) becomes the next target with the stop loss
placed at R2 level.
Similarly if price goes below the Pivot Point the trader should take a SELL position and keep the Pivot Point level as the
stop loss and the first target would be S1 level (Support 1). If S1 level is breached then S2 level (Support 2) becomes the
next target with the stop loss placed at S1 level. If S2 level is breached then S3 level (Support 3) becomes the next target
with the stop loss placed at S2 level.
Disclaimer: This document is not for public distribution and has been furnished to you solely for your information and must not be reproduced or
redistributed to any other person. Persons into whose possession this document may come are required to observe these restrictions. This material is
for the personal information of the authorized recipient, and we are not soliciting any action based upon it. This report is not to be construed as an offer
to sell or the solicitation of an offer to buy any security in any jurisdiction where such an offer or solicitation would be illegal. It is for the general
information of clients of Keynote Capitals Ltd. It does not constitute a personal recommendation or take into account the particular investment
objectives, financial situations, or needs of individual clients. We have reviewed the report, and in so far as it includes current or historical information, it
is believed to be reliable though its accuracy or completeness cannot be guaranteed. Neither Keynote Capitals Ltd., nor any person connected with it,
accepts any liability arising from the use of this document. The recipients of this material should rely on their own investigations and take their own
professional advice. Price and value of the investments referred to in this material may go up or down. Past performance is not a guide for future
performance. Certain transactions -including those involving futures, options and other derivatives as well as non-investment grade securities - involve
substantial risk and are not suitable for all investors. Reports based on technical analysis centers on studying charts of a stock’s price movement and
trading volume, as opposed to focusing on a company’s fundamentals and as such, may not match with a report on a company’s fundamentals.
Opinions expressed are our current opinions as of the date appearing on this material only. While we endeavor to update on a reasonable basis the
information discussed in this material, there may be regulatory, compliance, or other reasons that prevent us from doing so. Prospective investors and
others are cautioned that any forward-looking statements are not predictions and may be subject to change without notice. Our proprietary trading and
investment businesses may make investment decisions that are inconsistent with the recommendations expressed herein. We and our affiliates,
officers, directors, and employees world wide may: (a) from time to time, have long or short positions in, and buy or sell the securities thereof, of
company (ies) mentioned herein or (b) be engaged in any other transaction involving such securities and earn brokerage or other compensation or act
as a market maker in the financial instruments of the company (ies) discussed herein or act as advisor or lender / borrower to such company (ies) or
have other potential conflict of interest with respect to any recommendation and related information and opinions. The analyst for this report certifies that
all of the views expressed in this report accurately reflect his or her personal views about the subject company or companies and its or their securities,
and no part of his or her compensation was, is or will be, directly or indirectly related to specific recommendations or views expressed in this report. No
part of this material may be duplicated in any form and/or redistributed without Keynote Capitals Ltd’s., prior written consent.
Keynote Capitals Ltd.
The Ruby,
9th Floor,
Senapati Bapat Marg,
Dadar (W), Mumbai, India – 400028
Tel: 30266000 / 22694322
www.keynotecapitals.com