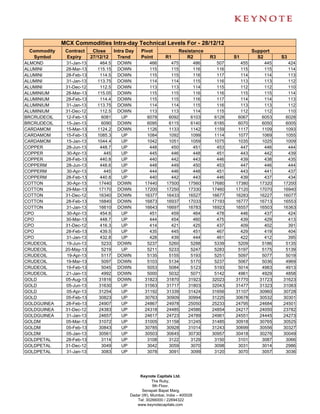
2. MCX Commodities Intra-day Technical Levels For - 28/12/12
Commodity Contract Close Intra Day Pivot Resistance Support
Symbol Expiry 27/12/12 Trend Point R1 R2 R3 S1 S2 S3
GOLDPTLDEL 28-Feb-13 3134 UP 3130 3163 3192 3254 3101 3068 3006
GOLDPTLDEL 31-Jan-13 3111 UP 3105 3130 3149 3193 3086 3061 3017
GOLDPTLDEL 31-Dec-12 3074 UP 3045 3129 3183 3321 2991 2907 2769
KAPAS 30-Mar-13 991.8 DOWN 994 997 1002 1010 989 986 978
KAPAS 30-Apr-13 1001.9 DOWN 1003 1008 1015 1026 997 992 980
KAPASKHALI 31-Dec-12 1360 DOWN 1360 1368 1375 1390 1353 1345 1330
KAPASKHALI 30-Apr-13 1486.5 DOWN 1504 1538 1589 1674 1453 1419 1334
KAPASKHALI 30-Mar-13 1452.5 DOWN 1455 1461 1469 1483 1447 1441 1427
KAPASKHALI 28-Feb-13 1412.5 DOWN 1416 1422 1431 1446 1407 1401 1386
KAPASKHALI 31-Jan-13 1380 DOWN 1381 1391 1402 1423 1370 1360 1339
LEAD 28-Mar-13 128.1 UP 128 129 130 131 127 126 124
LEAD 28-Feb-13 127.85 UP 127 128 129 130 127 126 125
LEAD 31-Jan-13 127.6 UP 127 128 128 130 127 126 125
LEAD 31-Dec-12 127.3 UP 127 128 128 129 127 126 125
LEADMINI 28-Mar-13 127.7 UP 127 128 129 130 127 126 125
LEADMINI 28-Feb-13 127.65 UP 127 128 129 130 127 126 125
LEADMINI 31-Jan-13 127.5 UP 127 128 128 129 127 126 125
LEADMINI 31-Dec-12 127.25 UP 127 128 128 130 127 126 125
MENTHAOIL 30-Mar-13 1468.4 UP 1452 1488 1508 1564 1432 1396 1341
MENTHAOIL 28-Feb-13 1475.1 UP 1458 1495 1514 1571 1438 1402 1345
MENTHAOIL 31-Dec-12 1448.5 UP 1431 1470 1491 1551 1410 1371 1311
MENTHAOIL 31-Jan-13 1464.7 UP 1447 1486 1508 1568 1426 1387 1327
NATURALGAS 25-Mar-13 193.5 UP 193 195 197 200 192 190 186
NATURALGAS 25-Feb-13 190.6 UP 190 192 194 198 189 187 183
NATURALGAS 28-Jan-13 188.3 UP 188 190 192 196 186 184 180
NICKEL 28-Mar-13 965.3 DOWN 968 971 977 987 962 958 948
NICKEL 28-Feb-13 961.3 DOWN 963 968 974 985 956 952 940
NICKEL 31-Jan-13 954.1 DOWN 956 961 968 981 949 944 931
NICKEL 31-Dec-12 946.8 DOWN 949 954 962 975 941 935 922
NICKELM 28-Mar-13 965.1 DOWN 967 971 976 985 962 958 949
NICKELM 28-Feb-13 960.9 DOWN 962 967 972 983 957 952 942
NICKELM 31-Jan-13 954.2 DOWN 956 961 968 980 949 944 932
NICKELM 31-Dec-12 946.8 DOWN 949 954 962 975 941 936 923
POTATO 15-Apr-13 714.1 UP 711 720 726 740 705 697 682
POTATO 15-May-13 715 UP 711 722 728 746 704 693 676
POTATO 15-Mar-13 756 UP 754 761 766 778 749 742 729
SILVER 05-Jul-13 60833 UP 60578 61255 61678 62778 60155 59478 58378
SILVER 04-May-13 59483 UP 59245 59988 60494 61743 58739 57996 56747
SILVER 05-Mar-13 58175 UP 57949 58670 59166 60383 57453 56732 55515
SILVER1000 28-Feb-13 57500 DOWN 57567 58133 58766 59965 56934 56368 55169
SILVER1000 31-Dec-12 56483 UP 56015 57023 57564 59113 55474 54466 52917
SILVER1000 31-Jan-13 56997 UP 56716 57381 57766 58816 56331 55666 54616
SILVERM 29-Jun-13 60784 UP 60591 61273 61761 62931 60103 59421 58251
SILVERM 30-Apr-13 59512 UP 59274 60007 60503 61732 58778 58045 56816
SILVERM 28-Feb-13 58206 UP 57966 58710 59215 60464 57461 56717 55468
SILVERMIC 29-Jun-13 60822 UP 60599 61293 61764 62929 60128 59434 58269
Keynote Capitals Ltd.
The Ruby,
9th Floor,
Senapati Bapat Marg,
Dadar (W), Mumbai, India – 400028
Tel: 30266000 / 22694322
www.keynotecapitals.com
3. MCX Commodities Intra-day Technical Levels For - 28/12/12
Commodity Contract Close Intra Day Pivot Resistance Support
Symbol Expiry 27/12/12 Trend Point R1 R2 R3 S1 S2 S3
SILVERMIC 30-Apr-13 59502 UP 59269 59988 60474 61679 58783 58064 56859
SILVERMIC 28-Feb-13 58205 UP 57964 58707 59210 60456 57461 56718 55472
STEELRPR 20-Mar-13 32420 UP 32360 32530 32640 32920 32250 32080 31800
STEELRPR 20-Feb-13 32000 UP 31893 32137 32273 32653 31757 31513 31133
STEELRPR 18-Jan-13 31480 UP 31393 31637 31793 32193 31237 30993 30593
ZINC 28-Mar-13 115.3 UP 115 116 116 116 115 115 114
ZINC 28-Feb-13 114.8 UP 115 115 116 117 114 114 113
ZINC 31-Jan-13 114.35 UP 114 115 115 116 114 113 112
ZINC 31-Dec-12 113.55 UP 113 114 114 115 113 112 111
ZINCMINI 28-Mar-13 115.3 UP 115 116 116 117 115 114 113
ZINCMINI 28-Feb-13 114.8 UP 115 115 116 116 114 114 113
ZINCMINI 31-Jan-13 114.35 UP 114 115 115 116 114 113 112
ZINCMINI 31-Dec-12 113.55 UP 113 114 115 116 113 112 111
Sanjay Bhatia (AVP – Technical Research),
Email Id sanjay@keynotecapitals.net
Pivot Point: Intra- Day Trading Tool. - The key to the use of this tool is the use of Stop Loss
Intra Day Trend: It is valid only till the point where Price trades above Pivot Point. For Eg. “UP” would be valid till Price
remains above Pivot Point. It would become “DOWN” in event Price trades below Pivot Point.
Pivot Point (PP): This is a trigger point for Intra Day Buy / Sell based on the price range of the previous day.
R1: Resistance 1: 1st Resistance level over Pivot Point, R2: Resistance 2: Next Resistance level after R1.
R3: Resistance 3: Next Resistance level after R2.
S1: Support 1: 1st Support level after Pivot Point, S2: Support 2: Next Support level after S1.
S3: Support 3: Next Support level after S2.
Note: As per this tool, the trader should take BUY position just above the Pivot Point and keep the Pivot Point level as stop
loss and the first target would be R1 level (Resistance 1). If R1 is crossed then R2 (Resistance 2) becomes the next target
with the stop loss placed at R1 level. If R2 is crossed then R3 (Resistance 3) becomes the next target with the stop loss
placed at R2 level.
Similarly if price goes below the Pivot Point the trader should take a SELL position and keep the Pivot Point level as the
stop loss and the first target would be S1 level (Support 1). If S1 level is breached then S2 level (Support 2) becomes the
next target with the stop loss placed at S1 level. If S2 level is breached then S3 level (Support 3) becomes the next target
with the stop loss placed at S2 level.
Disclaimer: This document is not for public distribution and has been furnished to you solely for your information and must not be reproduced or
redistributed to any other person. Persons into whose possession this document may come are required to observe these restrictions. This material is
for the personal information of the authorized recipient, and we are not soliciting any action based upon it. This report is not to be construed as an offer
to sell or the solicitation of an offer to buy any security in any jurisdiction where such an offer or solicitation would be illegal. It is for the general
information of clients of Keynote Capitals Ltd. It does not constitute a personal recommendation or take into account the particular investment
objectives, financial situations, or needs of individual clients. We have reviewed the report, and in so far as it includes current or historical information, it
is believed to be reliable though its accuracy or completeness cannot be guaranteed. Neither Keynote Capitals Ltd., nor any person connected with it,
accepts any liability arising from the use of this document. The recipients of this material should rely on their own investigations and take their own
professional advice. Price and value of the investments referred to in this material may go up or down. Past performance is not a guide for future
performance. Certain transactions -including those involving futures, options and other derivatives as well as non-investment grade securities - involve
substantial risk and are not suitable for all investors. Reports based on technical analysis centers on studying charts of a stock’s price movement and
trading volume, as opposed to focusing on a company’s fundamentals and as such, may not match with a report on a company’s fundamentals.
Opinions expressed are our current opinions as of the date appearing on this material only. While we endeavor to update on a reasonable basis the
information discussed in this material, there may be regulatory, compliance, or other reasons that prevent us from doing so. Prospective investors and
others are cautioned that any forward-looking statements are not predictions and may be subject to change without notice. Our proprietary trading and
investment businesses may make investment decisions that are inconsistent with the recommendations expressed herein. We and our affiliates,
officers, directors, and employees world wide may: (a) from time to time, have long or short positions in, and buy or sell the securities thereof, of
company (ies) mentioned herein or (b) be engaged in any other transaction involving such securities and earn brokerage or other compensation or act
as a market maker in the financial instruments of the company (ies) discussed herein or act as advisor or lender / borrower to such company (ies) or
have other potential conflict of interest with respect to any recommendation and related information and opinions. The analyst for this report certifies that
all of the views expressed in this report accurately reflect his or her personal views about the subject company or companies and its or their securities,
and no part of his or her compensation was, is or will be, directly or indirectly related to specific recommendations or views expressed in this report. No
part of this material may be duplicated in any form and/or redistributed without Keynote Capitals Ltd’s., prior written consent.
Keynote Capitals Ltd.
The Ruby,
9th Floor,
Senapati Bapat Marg,
Dadar (W), Mumbai, India – 400028
Tel: 30266000 / 22694322
www.keynotecapitals.com