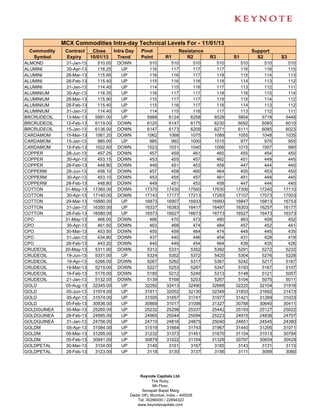
2. MCX Commodities Intra-day Technical Levels For - 11/01/13
Commodity Contract Close Intra Day Pivot Resistance Support
Symbol Expiry 10/01/13 Trend Point R1 R2 R3 S1 S2 S3
GOLDPETAL 31-Jan-13 3092.00 UP 3087 3099 3106 3125 3080 3068 3049
GOLDPTLDEL 31-Jan-13 3122.00 UP 3119 3133 3143 3167 3109 3095 3071
GOLDPTLDEL 28-Feb-13 3164.00 UP 3155 3207 3251 3347 3111 3059 2963
KAPAS 30-Mar-13 918.40 DOWN 921 927 935 950 912 906 891
KAPAS 30-Apr-13 938.00 DOWN 938 944 950 961 932 927 915
KAPASKHALI 30-Apr-13 1444.00 DOWN 1446 1455 1467 1487 1435 1426 1405
KAPASKHALI 30-Mar-13 1423.00 UP 1417 1432 1442 1467 1407 1392 1367
KAPASKHALI 31-Jan-13 1361.50 UP 1354 1372 1382 1410 1344 1326 1298
KAPASKHALI 28-Feb-13 1392.50 UP 1386 1402 1411 1436 1377 1361 1336
LEAD 30-Apr-13 128.70 UP 128 129 129 130 128 128 127
LEAD 28-Mar-13 128.50 UP 128 129 129 130 128 127 126
LEAD 28-Feb-13 128.20 UP 128 129 129 130 128 127 126
LEAD 31-Jan-13 127.65 UP 127 128 129 130 127 126 125
LEADMINI 30-Apr-13 128.50 UP 128 129 129 130 128 127 126
LEADMINI 28-Mar-13 128.50 UP 128 129 129 130 128 127 126
LEADMINI 28-Feb-13 128.20 UP 128 129 129 130 128 127 126
LEADMINI 31-Jan-13 127.65 UP 127 128 129 130 127 126 125
MENTHAOIL 30-Apr-13 1416.70 DOWN 1421 1430 1444 1467 1407 1398 1375
MENTHAOIL 30-Mar-13 1417.40 DOWN 1423 1437 1456 1490 1403 1390 1356
MENTHAOIL 28-Feb-13 1409.40 DOWN 1413 1429 1448 1483 1394 1378 1343
MENTHAOIL 31-Jan-13 1393.60 DOWN 1397 1413 1433 1468 1378 1362 1326
NATURALGAS 25-Mar-13 179.60 UP 179 182 184 188 177 175 171
NATURALGAS 25-Feb-13 176.10 UP 176 178 180 185 174 171 166
NATURALGAS 28-Jan-13 174.10 UP 174 176 179 184 171 169 164
NICKEL 30-Apr-13 978.90 UP 978 984 989 999 973 968 957
NICKEL 28-Mar-13 966.80 DOWN 970 976 985 1000 961 955 940
NICKEL 28-Feb-13 961.10 DOWN 964 971 980 996 954 948 932
NICKEL 31-Jan-13 954.40 DOWN 958 964 974 991 948 941 924
NICKELM 30-Apr-13 974.20 DOWN 977 981 988 1000 970 965 954
NICKELM 28-Mar-13 966.30 DOWN 970 975 985 999 961 955 940
NICKELM 28-Feb-13 961.20 DOWN 964 970 979 995 955 949 934
NICKELM 31-Jan-13 954.50 DOWN 958 964 974 991 948 941 925
POTATO 15-Apr-13 775.40 UP 771 788 801 831 758 741 711
POTATO 15-May-13 780.50 UP 770 794 807 844 757 733 696
POTATO 15-Mar-13 787.80 UP 787 797 806 825 778 767 748
SILVER 05-Jul-13 61188.00 UP 61017 61481 61774 62531 60724 60260 59503
SILVER 04-May-13 60001.00 UP 59759 60292 60582 61405 59469 58936 58113
SILVER 05-Mar-13 58680.00 UP 58430 58980 59279 60128 58131 57581 56732
SILVER1000 28-Feb-13 57919.00 UP 57896 58213 58508 59120 57601 57284 56672
SILVER1000 31-Jan-13 57687.00 UP 57511 58016 58346 59181 57181 56676 55841
SILVERM 29-Jun-13 61285.00 UP 61055 61535 61785 62515 60805 60325 59595
SILVERM 30-Apr-13 60005.00 UP 59757 60307 60610 61463 59454 58904 58051
SILVERM 28-Feb-13 58694.00 UP 58450 58989 59285 60120 58154 57615 56780
SILVERMIC 29-Jun-13 61271.00 UP 61029 61547 61823 62617 60753 60235 59441
SILVERMIC 30-Apr-13 60006.00 UP 59741 60325 60645 61549 59421 58837 57933
SILVERMIC 28-Feb-13 58695.00 UP 58448 58987 59279 60110 58156 57617 56786
Keynote Capitals Ltd.
The Ruby,
9th Floor,
Senapati Bapat Marg,
Dadar (W), Mumbai, India – 400028
Tel: 30266000 / 22694322
www.keynotecapitals.com
3. MCX Commodities Intra-day Technical Levels For - 11/01/13
Commodity Contract Close Intra Day Pivot Resistance Support
Symbol Expiry 10/01/13 Trend Point R1 R2 R3 S1 S2 S3
STEELRPR 20-Mar-13 33510.00 DOWN 33587 33723 33937 34287 33373 33237 32887
STEELRPR 18-Apr-13 34170.00 UP 34157 34413 34657 35157 33913 33657 33157
STEELRPR 18-Jan-13 32020.00 DOWN 32090 32240 32460 32830 31870 31720 31350
STEELRPR 20-Feb-13 32910.00 DOWN 32970 33070 33230 33490 32810 32710 32450
ZINC 30-Apr-13 112.95 DOWN 113 113 114 114 113 112 112
ZINC 28-Mar-13 112.65 UP 112 113 114 115 112 111 110
ZINC 28-Feb-13 112.00 UP 112 113 113 114 111 110 109
ZINC 31-Jan-13 110.95 UP 111 111 112 113 110 109 108
ZINCMINI 30-Apr-13 113.10 UP 113 114 114 115 113 112 111
ZINCMINI 28-Mar-13 112.65 UP 112 113 114 115 112 111 110
ZINCMINI 28-Feb-13 112.00 UP 112 113 113 114 111 110 109
ZINCMINI 31-Jan-13 110.95 UP 111 111 112 113 110 109 108
Sanjay Bhatia (AVP – Technical Research),
Email Id sanjay@keynotecapitals.net
Pivot Point: Intra- Day Trading Tool. - The key to the use of this tool is the use of Stop Loss
Intra Day Trend: It is valid only till the point where Price trades above Pivot Point. For Eg. “UP” would be valid till Price
remains above Pivot Point. It would become “DOWN” in event Price trades below Pivot Point.
Pivot Point (PP): This is a trigger point for Intra Day Buy / Sell based on the price range of the previous day.
R1: Resistance 1: 1st Resistance level over Pivot Point, R2: Resistance 2: Next Resistance level after R1.
R3: Resistance 3: Next Resistance level after R2.
S1: Support 1: 1st Support level after Pivot Point, S2: Support 2: Next Support level after S1.
S3: Support 3: Next Support level after S2.
Note: As per this tool, the trader should take BUY position just above the Pivot Point and keep the Pivot Point level as stop
loss and the first target would be R1 level (Resistance 1). If R1 is crossed then R2 (Resistance 2) becomes the next target
with the stop loss placed at R1 level. If R2 is crossed then R3 (Resistance 3) becomes the next target with the stop loss
placed at R2 level.
Similarly if price goes below the Pivot Point the trader should take a SELL position and keep the Pivot Point level as the
stop loss and the first target would be S1 level (Support 1). If S1 level is breached then S2 level (Support 2) becomes the
next target with the stop loss placed at S1 level. If S2 level is breached then S3 level (Support 3) becomes the next target
with the stop loss placed at S2 level.
Disclaimer: This document is not for public distribution and has been furnished to you solely for your information and must not be reproduced or
redistributed to any other person. Persons into whose possession this document may come are required to observe these restrictions. This material is
for the personal information of the authorized recipient, and we are not soliciting any action based upon it. This report is not to be construed as an offer
to sell or the solicitation of an offer to buy any security in any jurisdiction where such an offer or solicitation would be illegal. It is for the general
information of clients of Keynote Capitals Ltd. It does not constitute a personal recommendation or take into account the particular investment
objectives, financial situations, or needs of individual clients. We have reviewed the report, and in so far as it includes current or historical information, it
is believed to be reliable though its accuracy or completeness cannot be guaranteed. Neither Keynote Capitals Ltd., nor any person connected with it,
accepts any liability arising from the use of this document. The recipients of this material should rely on their own investigations and take their own
professional advice. Price and value of the investments referred to in this material may go up or down. Past performance is not a guide for future
performance. Certain transactions -including those involving futures, options and other derivatives as well as non-investment grade securities - involve
substantial risk and are not suitable for all investors. Reports based on technical analysis centers on studying charts of a stock’s price movement and
trading volume, as opposed to focusing on a company’s fundamentals and as such, may not match with a report on a company’s fundamentals.
Opinions expressed are our current opinions as of the date appearing on this material only. While we endeavor to update on a reasonable basis the
information discussed in this material, there may be regulatory, compliance, or other reasons that prevent us from doing so. Prospective investors and
others are cautioned that any forward-looking statements are not predictions and may be subject to change without notice. Our proprietary trading and
investment businesses may make investment decisions that are inconsistent with the recommendations expressed herein. We and our affiliates,
officers, directors, and employees world wide may: (a) from time to time, have long or short positions in, and buy or sell the securities thereof, of
company (ies) mentioned herein or (b) be engaged in any other transaction involving such securities and earn brokerage or other compensation or act
as a market maker in the financial instruments of the company (ies) discussed herein or act as advisor or lender / borrower to such company (ies) or
have other potential conflict of interest with respect to any recommendation and related information and opinions. The analyst for this report certifies that
all of the views expressed in this report accurately reflect his or her personal views about the subject company or companies and its or their securities,
and no part of his or her compensation was, is or will be, directly or indirectly related to specific recommendations or views expressed in this report. No
part of this material may be duplicated in any form and/or redistributed without Keynote Capitals Ltd’s., prior written consent.
Keynote Capitals Ltd.
The Ruby,
9th Floor,
Senapati Bapat Marg,
Dadar (W), Mumbai, India – 400028
Tel: 30266000 / 22694322
www.keynotecapitals.com