- The daily commodity report summarizes prices and trading activity for gold, silver, crude oil, and other commodities on the MCX exchange on January 3rd, 2013.
- Gold and silver prices closed modestly lower while crude oil prices closed with moderate gains. Trading volumes declined significantly compared to the previous day.
- Technical indicators show buying support for gold, silver and crude oil but also the potential for profit taking, as indicators are in overbought zones for some commodities. The report provides resistance and support price levels.
- Gold and silver prices were mostly flat while crude oil prices rose slightly.
- Technical indicators pointed to potential downward pressure on gold and silver but continued buying support for crude oil.
- The report provided resistance and support price levels for gold, silver, and crude futures contracts.
The daily commodity report summarizes movements in gold, silver, and crude oil futures on the MCX exchange. It notes that gold and silver closed slightly lower while crude oil closed flat. The technical indicators for all three commodities show selling pressure, with signs of short-term short covering. Resistance and support levels are provided. The report also includes commodity news, economic calendar items, and a disclaimer.
Gold and silver prices fell slightly while crude oil rose marginally according to the daily commodity report. Technical indicators for gold, silver, and crude oil showed selling pressure but crude oil indicators pointed to buying support. Global market prices for gold, silver, and crude changed little. The economic calendar highlighted upcoming economic data releases from India, the US, Japan, and the UK. A disclaimer noted the information is for clients and not a solicitation.
- Gold and silver futures fell on the MCX on December 20th due to year-end selling pressure. Crude oil futures rose slightly.
- On the daily commodity report, gold faced resistance at 30,758, 30,837 and 30,916 levels, while support was at 30,475, 30,366 and 30,150. Silver faced resistance at 59,483, 61,484 and 63,224, and support at 57,049, 56,372 and 55,952. Crude oil was recommended as a buy above 4950 with a target of 5125.
- In commodity news, gold hit a near 4-month low due to selling pressure at year-end. Pepper futures
- The daily commodity report summarizes movements in gold, silver, crude oil, and other commodities on the MCX exchange on January 2nd, 2013.
- Gold and silver prices opened lower but recovered to close with small gains of 0.09%. Crude oil opened higher and closed up 0.32%.
- Technical indicators for gold, silver, and crude oil show buying support, although crude may see profit taking due to being in overbought territory. Positional advice is given to buy crude oil futures above 4950 level.
The document provides a daily report on commodity prices and analysis. It summarizes that on February 21st, gold and silver prices opened lower but closed with moderate gains, while crude oil closed with moderate losses. The technical indicators show selling pressure on metals but short covering may provide buying support. Crude oil indicators show sellers gaining strength. The report also includes volume and turnover data, resistance and support price levels, and commentary on global commodity prices and economic calendar events.
The daily commodity report summarizes prices and trading activity for gold, silver, and crude oil futures on the MCX exchange in India. On February 27th, gold and silver prices closed lower by 1.16% and 1.46% respectively, while crude oil closed lower by 0.42%. Trading volumes declined significantly across all three commodities compared to the previous day. Technical indicators show buying support for gold and silver but strengthening sellers for crude oil. Key support and resistance price levels are provided.
- The daily commodity report summarizes prices and trading activity for gold, silver, crude oil, and other commodities on the MCX exchange in India.
- On February 11th, prices for gold, silver, and crude oil all declined slightly except for crude oil which rose 1.49%. Trading volumes increased substantially across commodities compared to the previous day.
- Technical indicators show selling pressure for gold and silver, while crude oil technicals suggest a range-bound trend and potential for further buying. The report provides resistance and support price levels for each commodity.
Gold and silver prices fell over 1% while crude oil declined nearly 2% on February 20th. Most commodities ended the day lower with losses as metals faced selling pressure and crude oil dropped due to signs of economic recovery reducing safe haven demand. The report provides technical analysis indicating further downside potential in the short-term for commodities.
Gold and silver prices were higher at the beginning of the day but closed with modest gains and losses, respectively. Crude oil prices were higher and closed with marginal losses. The RSI and stochastic indicators for gold and crude oil signal support for prices, while those for silver signal selling pressure. Commodity markets face resistance and support at various price levels detailed in the report. The Cabinet approved an increase in MSP for copra.
The daily commodity report summarizes prices and trends in gold, silver, and crude oil futures on the MCX exchange in India on January 31st, 2013. Gold and silver prices declined over 1% and 2% respectively, while crude oil fell slightly. Technical indicators suggest selling pressure on metals but prices may find support at lower levels. Crude oil faced a range-bound trend. The report provides resistance and support price levels for trading on February 5th and analysis of economic indicators and commodity news.
- The daily commodity report summarizes prices and trading activity for gold, silver, and crude oil on the MCX exchange on February 16th, 2013.
- Gold prices opened higher but fell to an intraday low before closing with small gains. Silver and crude oil closed near their opening prices with small losses and gains respectively.
- Technical indicators like the RSI and Stochastic showed selling pressure across commodities, but signs of oversold conditions that could lead to short-term rebounds.
The daily commodity report summarizes the movement of gold, silver, and crude prices on the MCX exchange on March 6th, 2013. Gold prices opened lower but rose intraday before closing with modest losses. Silver opened higher and peaked intraday but also closed with losses. Crude opened and closed higher with moderate gains. Technical indicators for all three commodities showed sellers were in control but covering shorts, suggesting prices may rise. Upcoming economic reports and data were also summarized.
The daily commodity report summarizes prices and trading activity for gold, silver, and crude oil futures on the MCX exchange. On February 12th, gold and silver prices closed slightly lower while crude oil closed higher. Technical indicators show selling pressure on gold and silver but buying support for crude oil. The report also provides volumes, turnover and closing prices for the previous day on MCX as well as international prices on COMEX.
- Gold, silver, and crude oil prices fell on the commodity market while the dollar index was mostly flat.
- Brent oil rose above $109 due to expectations that the U.S. budget crisis will be resolved, avoiding a recession.
- The report provides an analysis of movements in gold, silver, and crude oil prices and makes buy/sell recommendations.
This document summarizes the daily commodity report from MCX for June 14th, 2012. It provides opening, high, low, and closing prices for gold, silver, and crude on that date. It also includes intraday resistance and support levels as well as analysis of indicators like RSI and stochastic. The report concludes with comments on US economic calendar events and a disclaimer.
- The daily commodity report summarizes prices and trading activity for gold, silver, and crude on the MCX exchange on January 31, 2012.
- Gold and silver prices opened higher but saw selling pressure and fell to intraday lows before closing near unchanged. Crude opened lower and saw little change over the day.
- Technical indicators like the RSI and Stochastic showed buying and selling pressures across commodities, suggesting a range-bound trend in the short term. The report provides resistance and support price levels.
- Gold opened higher at its highest price of the day but failed to sustain gains and closed with a marginal increase.
- Silver also opened higher but moved lower intraday before closing with a small gain.
- Crude oil opened lower, reached a daily low, but recovered slightly to close with a minor loss.
- Technical indicators show mixed signals for gold and silver, suggesting a range-bound trend, while crude oil indicators point to continued buying support.
- Gold, silver and crude oil futures opened higher on the MCX on April 30th, with gold seeing marginal gains and silver and crude oil posting modest losses by the end of the day.
- Technical indicators like the RSI, stochastic and ADX signals support buying, but also suggest the markets may be overbought and prone to profit taking.
- Key resistance and support levels are identified for each commodity futures contract.
The daily commodity report summarizes the movement of gold, silver, and crude futures contracts on the MCX exchange. Gold futures closed slightly higher after fluctuating during the day, while silver futures had large gains. Crude futures closed lower after being higher early in the session. Technical indicators show mixed signals for further direction, with some pointing to potential further buying and others signaling the markets may be overbought. The report provides resistance and support price levels for the contracts.
The document provides a daily commodity outlook and summarizes movements in gold, silver, and crude futures contracts. Gold prices opened higher but saw profit taking, ending slightly up for the day. Silver saw lower intraday prices but recovered to close marginally higher. Crude opened at its high and fell through the day, ending with moderate losses. Technical indicators suggest sellers have an advantage in gold and crude, while short-term buyers may provide support in silver.
Gold and silver prices opened higher but later declined intraday before recovering to close with moderate gains. Crude oil also opened higher but dipped before closing modestly up. Technical indicators show buying support could continue for gold and silver but profit-taking is possible, while crude may see further short covering and buying. Near-term resistance and support levels are given for each commodity. The report also provides US economic calendar details and disclaimers.
- The daily commodity report summarizes the movement of gold, silver, and crude prices on the MCX exchange on January 24, 2012.
- Gold prices ended the day marginally higher after recovering from an intra-day low. Silver prices closed flat after failing to sustain earlier gains. Crude oil prices closed moderately higher after bouncing back from an intra-day low.
- Technical indicators like the RSI, Stochastic, and ADX provided mixed signals for the different commodities, suggesting the potential for both further gains and intermittent bouts of selling pressure across gold, silver, and crude.
1) Gold, silver, and crude oil futures opened lower on the MCX on March 29th, with all three closing the day in negative territory between 0.52-1.44%.
2) Technical indicators like the RSI and Stochastic showed selling pressure across commodities, though crude oil and silver remained in oversold zones.
3) Key resistance and support levels are given for the three commodities over the near term.
The document summarizes the daily outlook for commodities gold, silver and crude on the MCX exchange in India. Gold prices opened higher but fell to close near lows, pressured by profit taking and selling. Silver also opened lower and fell over 4% due to sustained selling pressure. Crude opened lower but saw some gains before closing down over 2% on lack of buying support. Technical indicators signal further downside potential for crude while short covering may support gold and silver at lower levels. Key resistance and support levels are given.
The daily commodity report summarizes prices and trading activity for gold, silver, and crude oil on the MCX exchange in India on June 4th, 2012. Gold prices closed slightly higher after dropping to an intra-day low but recovering. Silver prices closed marginally higher as well after dropping intra-day. Crude oil prices closed marginally lower after attempts to rise were overcome by selling pressure. Technical indicators provided mixed signals for the short-term direction of all three commodities. The report also lists key support and resistance price levels.
The document provides the intra-day technical levels for various stocks trading on the NSE for January 4, 2013. It lists the closing price from January 3, the trend (up or down), pivot point, and resistance and support levels for each stock to analyze its movement during the trading day. The levels are used to identify potential reversal or breakout points for the stocks.
The document provides an outlook on daily derivatives and recommends several option trades. It recommends buying Nifty 5900 PUT at 32 with a stop loss of 18 and buying Bank Nifty 12500 PUT at 98 with a stop loss of 45. It also recommends directional stock call option trades such as buying Infosys 2750 CALL at 44. Additionally, it provides a ready reckoner on basic option strategies and technical indicators that can be used for option strategies.
The domestic markets witnessed a flat opening but buying later picked up, helping the markets end the day with marginal gains. The Nifty failed to breach the 5741 resistance level due to profit taking. Technically, market breadth was positive amid lower volumes. The prevailing positive technical indicators continue to support buying, but intermediate bouts of profit taking may occur due to the RSI being in overbought territory. The markets are expected to take cues from global cues, the rupee, and crude oil prices.
The document provides daily technical levels for various commodities traded on the MCX commodity exchange in India. It lists the commodity, contract expiry date, previous day's close price, pivot point, and resistance and support levels for intra-day trading. The levels are used to identify potential price points where buying and selling pressure may occur during the trading day.
Indian markets closed flat on Friday as investors awaited the outcome of nationwide protests planned against recent fuel price hikes. Asian markets dropped on Monday morning due to concerns over the Greek debt crisis. The document provides an analysis of factors impacting Indian and global markets including the fuel price issue in India, European debt concerns, and expected flat opening for Indian markets on Monday.
Indian markets rose 1.7% on Thursday, its biggest percentage gain in nearly two months, after the government hiked petrol prices. Oil marketing companies rose on hopes that other fuel prices may also increase. European stocks and US index futures also rose after strong results from HP. The Sensex rose to 16,222.30 and the Nifty rose to 4,921.40. FIIs were net sellers of Indian stocks. The government may discuss raising diesel and LPG prices on Friday. Tyre stocks rose as rubber prices fell. Bharti Airtel surged after announcing an agreement to acquire a stake in Qualcomm's Indian broadband entity. Asian markets dropped in volatile trading, mirroring global uncertainties.
- Indian stock markets rose for the second consecutive day, with the Sensex gaining 1.08% and Nifty up 1.03%, as rate-sensitive companies rallied on hopes of an interest rate cut. Comments from the new Finance Minister on Monday boosted stocks that would benefit from lower rates.
- Software exporters such as Infosys also rallied after U.S. rival Cognizant Technology Solutions raised its profit forecast. Education stocks rose across the board.
- The government has decided to release additional 4.2 lakh tonnes of sugar in the open market this month to control prices that have risen significantly year-over-year in most parts of the country.
The domestic stock markets opened higher but then declined due to selling pressure. Overall the markets remained range-bound. Lower inflation numbers raised expectations of an interest rate cut, which increased buying in the afternoon. However, lack of follow-up buying support and continued selling pressure caused the markets to close near the day's lows, with modest losses. Technically, market breadth was negative with lower trading volumes. The markets are expected to have a flat to positive opening as some technical indicators remain positive, but overall technical weaknesses may lead to further selling pressure.
This document provides the intra-day technical levels for various stocks on the NSE for November 9, 2012. It lists the closing price, intra-day pivot point, resistance and support levels for over 50 companies. The pivot, resistance and support levels are determined based on the previous day's trend and price movements and can be used to identify entry and exit points for trading.
The document provides intra-day technical levels for various commodities traded on the MCX, including the pivot point and resistance and support levels for each commodity on different contract expiry dates. Details include the commodity name, contract expiry, previous day's close price, intra-day trend, and key technical levels that traders can use to identify potential resistance and support levels for each commodity on intra-day trading.
- The key Indian stock indices declined on Thursday led by losses in banking and IT stocks. The Sensex fell 51 points to close at 18,618 and the Nifty fell 17 points to close at 5,667.
- State Bank of India fell 0.9% and HDFC Bank shed 0.7%. Tata Motors closed 1.1% lower. Six of the 13 BSE sectoral indices closed in negative territory with BSE IT down 0.67% and BSE Bankex down 0.42%.
- Asian stocks are expected to open weak on Friday, tracking global market declines and lower volumes due to holidays.
The markets remained range bound with marginal losses. The top losers for the day were from sectors like banking, infrastructure, and technology. Technically, market breadth remained robust but negative conditions weighed on sentiment. Support levels are at 5665, 5554, and 5447 while resistance levels are at 5747, 5816, and 5885. Stocks to watch out for today are from sectors like banking, infrastructure, technology, and pharmaceuticals.
Indian markets edged higher for a second consecutive session as hopes for further interest rate cuts boosted bank stocks, while data showing a pick up in the services sector also supported the market. The Sensex rose 0.20% to close above 16,000 supported by gains in infrastructure stocks on reports that stalled projects may be revived. Telecom stocks fell ahead of an EGoM meeting to decide on spectrum auction base prices.
The domestic stock markets witnessed negative trading due to weak global cues. The key indices ended the day with moderate losses, closing near their daily lows. Technically, most indicators showed bearish signals, suggesting further downside pressure. Key support levels for the Nifty are at 4824, 4777 and 4742.
- Indian markets fell for a fourth straight session yesterday to hit their lowest level in over three weeks, as the RBI governor maintained a hawkish tone and euro zone debt worries weighed on sentiment.
- FMCG stocks rose on expectations of a recovery in monsoon-driven crop yields, while aviation shares declined as crude oil prices remain high. ONGC fell after an analyst downgrade.
- Asian markets declined after weak economic data from Japan and falling commodity prices ahead of a speech by the Fed chief. The Indian markets are expected to open weak today following Asian cues and rising political uncertainty in India.
The document provides daily technical levels for various MCX commodities including pivot points and resistance and support levels. It lists the commodity, contract expiry date, previous day's close price, calculated pivot point, and resistance and support price levels for intraday trading. The levels are calculated based on previous price data to determine likely trading ranges and support/resistance thresholds for each commodity on the given date.
Megan robinsons orginal music video scriptPaigeward96
The video script is for Olly Murs' song "Dance With Me Tonight" and consists of 13 scenes showing Olly and his friends getting ready for prom. It begins with Olly trying to stop Jamie's dad from taking her away, then shows Olly and his friends shopping for suits and getting haircuts. At the prom, Olly serenades Jamie at her window before they dance together inside. However, Jamie's dad tries to intervene but eventually approves of Olly. The video ends with everyone dancing happily at the prom.
- Gold prices opened higher but fell to an intra-day low before recovering slightly to close with modest gains. Silver and crude oil also opened higher but closed with moderate gains and losses respectively.
- Technical indicators for gold and silver suggest a range-bound trend, while crude oil's indicators point to selling pressure. Positional advice is given to sell MCX crude oil below 5106.
- In commodity news, rice farmers in Bihar and eastern UP are forced to sell below the minimum support price due to lack of state intervention. Gold halted its three-day decline as the weaker dollar increased demand.
- The daily commodity report summarizes the performance of gold, silver, and crude oil on the MCX exchange on February 7th, 2013.
- Gold prices closed slightly higher at 30711 after falling to an intra-day low of 30565. Silver prices closed flat at 58376 after falling to 58076 intra-day. Crude oil prices closed marginally lower at 5139 after touching an intra-day low of 5070.
- Technical indicators for gold, silver, and crude oil suggest range-bound trading in the near future.
The daily commodity report summarizes prices and trends for gold, silver, and crude oil futures on the MCX exchange in India. Gold prices opened lower but gained modestly to close higher. Silver opened lower and gained moderately to close higher. Crude oil opened higher but saw limited movement to close modestly higher. The report provides technical analysis for each commodity and notes recent global market prices and economic news that may impact commodities.
- The daily commodity report summarizes movements in gold, silver, and crude prices on the MCX exchange on January 9th, 2013.
- Gold prices opened lower but rose intraday before ending with moderate losses. Silver and crude also saw intraday highs but closed lower.
- Technical indicators like the RSI and Stochastic were providing mixed signals for further direction. The report provides resistance and support price levels for the different commodities.
The daily commodity report summarizes prices and trends for gold, silver, and crude oil on the MCX exchange in India. Gold and silver prices saw marginal gains while crude oil closed slightly higher. Technical indicators show most commodities are in a range-bound trend. The report also provides global market prices and commentary on commodity news including increased coconut oil exports from India and falling premiums for arabica coffee.
The daily commodity report recaps the movement of gold, silver, and crude prices on the MCX exchange. Gold and crude prices closed nearly flat, while silver closed with moderate losses. Technical indicators suggest sellers are covering positions at lower price levels for gold and silver. Crude is supported by positive technical indicators. The report also provides international commodity prices and highlights recent news about changes to sugar regulations in India and gold import trends.
- Gold, silver, and crude oil prices moved higher today before closing with marginal losses or gains.
- The technical indicators show most commodities are in a range-bound trend. Resistance and support levels are provided.
- A sell recommendation is given for MCX crude oil based on technical analysis.
- Economic data releases are listed for the coming days from India, US, UK, Eurozone, and China that may impact commodity prices.
The daily commodity report summarizes the performance of gold, silver, crude oil, and other commodities. On January 11th, gold prices opened lower but gained modestly to close higher. Silver opened higher but fell during the day before closing with moderate gains. Crude oil opened higher and maintained gains to close above its opening price. Technical indicators suggest potential buying support for gold and silver, and mixed signals for crude oil.
- Gold, silver and crude oil prices increased slightly on the day, with gold up 0.41%, silver up 1.22% and crude oil up 0.18%.
- Technical indicators for gold, silver and crude oil were positive, suggesting buying support. Resistance and support levels for each commodity are given.
- Positional call was given to buy MCX crude oil above 4950 with a target of 5125 and stop loss of 4871.
The daily commodity report summarizes prices and trading activity for gold, silver, and crude oil futures contracts. On December 20th, gold and silver prices fell while crude oil prices rose slightly. Gold futures fell 1.09% to close at $30,482 per ounce. Silver futures dropped 3.78% to close at $57,351 per kilogram. Crude oil futures increased 0.61% to close at $4,977 per barrel. Trading volumes declined for gold and crude oil but increased sharply for silver. The report provides technical analysis for near-term futures contracts and identifies support and resistance price levels.
Gold and crude oil prices dipped slightly while silver fell more sharply. The daily commodity report analyzes movements in gold, silver, and crude oil futures contracts on the MCX exchange and provides technical analysis of trends, resistance and support levels. Analyst Sanjay Bhatia predicts gold will face resistance at 30150 and support at 30000, while silver may encounter resistance at 59483 and support at 57049. Crude oil is expected to meet resistance at 5300 and support at 5157. The report also includes commodity news briefs and an economic calendar of upcoming major economic data releases.
- Gold and silver prices rose on the domestic market due to higher global prices and increased demand from investors and stockists. Crude oil stabilized below $112 per barrel due to optimism around the Eurozone economy and increased US consumer spending.
- On the commodities markets, MCX gold ended higher at 30869 after fluctuating during the day between 30737 and 30887. MCX silver closed at 59459 after moving between 58853 and 59580. MCX crude oil finished at 5131 after reaching an intra-day low of 5105 and high of 5148.
- Technical indicators for gold, silver and crude oil showed mixed signals of range-bound trading in the near term with supports and resist
The daily commodity report summarizes prices and trading activity for gold, silver, and crude oil on the MCX exchange in India on February 25th, 2013. Gold prices were largely flat, opening lower but closing near the opening price, while silver saw modest gains and crude oil saw modest losses. Trading volumes increased significantly compared to the previous day for all three commodities. Technical indicators pointed to potential short-term buying or short covering for gold and silver at lower price levels.
The daily commodity report summarizes prices and trading activity for gold, silver, and crude oil on the MCX exchange from September 4th, 2012. Gold prices fell slightly while silver and crude oil saw modest gains. Technical indicators show markets remain in overbought territory, suggesting continued profit taking. The report also provides commentary on commodity price movements and economic news affecting markets.
Gold opened higher but ended the day with modest gains, closing at 30,947. Silver also opened higher and closed higher at 57,508. Crude opened unchanged but closed lower at 5,354. Technical indicators for gold and silver show buying support but both metals remain in overbought zones, which could lead to profit taking. Technical indicators for crude show a range-bound trend. The report provides closing prices and levels of resistance and support for gold, silver, and crude futures contracts.
- The document summarizes the daily performance of gold, silver and crude oil futures contracts on the MCX exchange on November 7th, 2012.
- Gold futures closed up 1.23% at Rs. 31,273 per 10 grams. Silver futures rose 2.28% to Rs. 59,910 per kg. Crude oil futures gained 2.77% to settle at Rs. 4,794 per barrel.
- Technical indicators for gold, silver and crude oil futures suggest buying momentum as the Relative Strength Index and stochastic indicators moved above their averages.
Gold and silver prices increased modestly while crude oil prices fell moderately. Technical indicators for gold, silver and crude oil showed they remain in overbought territory with buyers taking profits at higher levels. MCX gold faces resistance at higher price points while support levels are lower. MCX silver is expected to find resistance at higher levels with support at 59,000. MCX crude faces resistance at 5,408 with support at 5,366.
Gold and silver prices rose slightly while crude oil prices were nearly unchanged. Technical indicators show gold and silver are in overbought territory and may see selling pressure. Analysts recommend selling gold and expect it to fall to Rs. 30800. Crude oil is range-bound with support at Rs. 5238-5093 and resistance at Rs. 5366-5600. The report provides an analysis of commodity prices, technical indicators, and analysts' recommendations.
The daily commodity report recaps the movement in gold, silver, and crude oil futures contracts on the MCX exchange. Gold and silver futures closed higher by 1.44% and 3.15% respectively, while crude oil futures rose 0.39%. The technical indicators for all three commodities signaled buying support, but some remained in overbought zones, raising the risk of intermittent profit-taking. The report also provides opening, high, low, and closing prices as well as recent volume and turnover data for each commodity.
The daily commodity report summarizes movements in gold, silver, and crude oil futures on the MCX exchange. On September 7th, gold futures opened higher but ended the day flat, silver futures gained over 0.7%, and crude oil futures rose 0.23%. Technical indicators suggest further selling pressure and profit-taking may occur across commodities. The report also provides resistance and support price levels.
Similar to Keynote commodity daily report for 040113 (20)
The domestic stock markets opened lower but bounced back to close flat, supported by the 200-day simple moving average. The Nifty closed slightly higher but technical indicators remain negative, suggesting further bouts of selling pressure. Key support levels are at 5624, 5571 and 5447, while resistance levels are at 5747, 5816 and 5885. Stocks such as Adani Ports, HDFC, and HUL are recommended for watching.
The document provides intra-day technical levels for currency futures contracts for various dates. It includes the previous day's close price, intra-day trend, pivot point, and resistance and support levels. The pivot point is used as a trigger for intra-day buy/sell decisions. Resistance levels above and support levels below the pivot point are also provided. The document advises using the pivot point as a stop loss level and taking successive profit targets at the resistance and support levels.
The document provides daily derivatives outlook and recommends several bullish and bearish positional option trades on indices and stocks. It recommends short strangle trades on Nifty, Bank Nifty and USD/INR based on highest call and put open interest levels. It also recommends bullish call option trades on specific stocks like Hindustan Unilever, Ranbaxy, ITC, HDFC and Titan. Bearish put option trades are recommended on stocks like Reliance, Tata Steel, Reliance Power, DLF, Hero Motors.
The key Indian stock indices closed slightly higher, recovering from a seven-day losing streak. The Sensex closed up 0.12% and the Nifty closed up 0.14%. Midcap and small cap shares continued declining with lack of buying support. Shares of Jet Airways and SpiceJet fell on concerns of increased competition from a new AirAsia India joint venture. GAIL shares fell on reports of delays to a gas pipeline project in Tamil Nadu. Overall, six sectors closed lower while seven closed higher. FIIs were net buyers of Indian stocks while domestic institutions were net sellers.
The document provides the intra-day technical levels for various stocks trading on the NSE for March 28, 2013, the day of monthly futures and options expiry. It lists the closing price of each stock from March 26, the intra-day pivot point, and resistance and support levels (R1-R3 and S1-S3). The levels are expected to act as upside and downside barriers for price movement during the trading session.
The document provides intra-day technical levels for various commodities futures contracts traded on the MCX commodity exchange in India. It lists the commodity, contract expiry date, previous day's close price, intra-day trend, pivot point, and resistance and support levels for each commodity contract. The levels are used to analyze the commodity's intra-day price movement and determine potential resistance and support areas.
The domestic markets witnessed negative openings and sustained selling pressure, trading with moderate losses on weak global cues. However, the markets managed to recover from the lows and end the day with modest losses near the highs, supported by short covering and selective buying. Technically, most indicators remain below their averages, signaling impending selling pressure. The markets will take cues from global factors as well as the rupee and crude oil prices.
The document provides technical analysis levels for various currency futures contracts traded on the NSE for intraday trading on March 5, 2013. It lists the pivot point, resistance and support levels for currency pairs such as EUR/INR, GBP/INR, JPY/INR and USD/INR. The pivot point is considered a trigger for intraday buy/sell decisions. Resistance levels R1, R2, R3 are above the pivot point and support levels S1, S2, S3 are below the pivot point. The analysis is meant to guide intraday traders on entry, exit and stop loss levels based on the currency pair's price action relative to the pivot point.
The document provides the intra-day technical levels for various stocks trading on the National Stock Exchange of India (NSE) on March 5, 2013. It lists the stocks, their closing prices from the previous day, identified trends (up or down), pivot points, and resistance and support levels for intra-day trading. The levels are intended to help traders identify potential highs and lows for the stocks during the trading day.
The domestic stock markets witnessed flat opening but selling pressure drove markets lower. However, markets bounced back from lower levels due to short covering and selective buying. The markets closed near the day's highs with modest gains. Technically, positive market breadth amid higher volumes supported the markets. The indices remain above key support levels. However, negative technical indicators could lead to selling pressure at higher levels. The markets will take cues from the upcoming Union Budget.
The document provides the intra-day technical levels for currency futures contracts on various dates. It includes the pivot point, which is a trigger for intra-day buy/sell decisions, and resistance and support levels (R1, R2, R3 and S1, S2, S3). The trader is advised to take a long position above the pivot point and use the pivot as the stop loss, with targets at the resistance levels; and take a short position below the pivot point, using it as the stop loss and targeting the support levels. The intra-day trend is valid until the price trades above or below the pivot point.
The document provides intra-day technical levels for various MCX commodities contracts for February 28, 2013. It lists the commodity, contract expiry date, previous day's close price, intra-day trend, pivot point, resistance and support levels. Technical analysis is used to identify levels of resistance and support for each commodity contract to determine likely price movement and trading opportunities on the given day.
This document provides a daily derivatives outlook and recommends various positional option trades. It summarizes the highest call and put open interest levels for various indices like Nifty and Bank Nifty. It recommends short-term strategies like short strangles and long-term strategies like short straddles. It also provides bullish and bearish positional stock option trades and discusses the US dollar-Indian rupee outlook.
The document provides the intra-day technical levels for various stocks trading on the National Stock Exchange of India (NSE) for February 28, 2013, the expiry date for futures and options contracts. It lists the stock name, previous day's close price, identified trend (up/down), pivot point, and potential resistance and support levels (R1, R2, R3, S1, S2, S3) for each stock based on technical analysis of recent price movements. This is intended to help traders identify potential price points where the market may reverse direction on an intra-day basis.
The domestic markets opened flat but saw selling pressure and losses, especially in mid-cap stocks due to margin funding issues. The markets recovered slightly in the afternoon on short-covering and selective buying but failed to sustain higher levels. Technically, market breadth was weak with higher volumes signaling more downside risk. Most technical indicators were below their averages, signaling impending selling pressure. However, some indicators were in oversold territory, which could lead to short-term bouts of buying at lower levels. The markets will take cues from the upcoming union budget, global markets, the rupee and crude oil prices.
- The document provides intra-day technical levels for currency futures contracts, including pivot points, resistance and support levels.
- The pivot point is a trigger point for intra-day buying and selling based on the previous day's price range, and is used to determine resistance and support levels.
- Traders are advised to take buy positions above the pivot point and sell positions below it, using the pivot point as a stop loss and targeting resistance or support levels.
The document provides intra-day technical levels for various commodities trading on the MCX exchange for February 26, 2013. It lists the commodity, contract expiry date, previous day's close price, intra-day trend, pivot point, resistance and support levels for each commodity. Technical analysis is used to determine the short-term outlook and key price levels.
This document provides a daily outlook on currency, indices, and stock positional option trades for February 26, 2013. It summarizes the highest call and put open interest levels for the Nifty and Bank Nifty indices and recommends short strangle strategies. It also recommends short strangle trades for the USD/INR currency pair in March. On the stock side, it recommends bullish positional calls on specific stocks and bearish positional puts on other stocks. The document provides a ready reckoner on various option strategies and techniques for managing risk.
This document provides the intra-day technical levels for various stocks trading on the NSE, including pivot points and resistance and support levels, to help analyze the market trend for day trading on February 26, 2013, with the futures and options contracts expiring on February 28, 2013. The levels indicated include important price points to watch for potential reversals in the movement of each stock.
- The Indian markets witnessed a gap down opening and sustained selling pressure, falling over 1.5% due to weak global cues.
- Increased selling pressure in the afternoon saw the markets close near the day's lows. Top sectoral losers were metals, banks, and oil & gas.
- Technically, market breadth remained weak with higher volumes, and indicators like stochastic, KST, and RSI slipped below averages, signaling more downside.
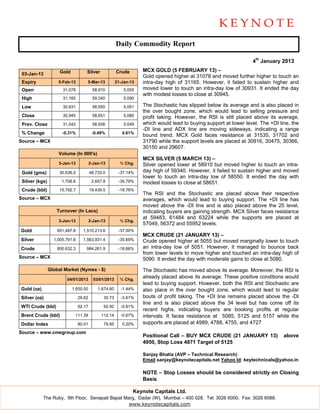
1. Daily Commodity Report
4th January 2013
Gold Silver Crude MCX GOLD (5 FEBRUARY 13) –
03-Jan-13
Gold opened higher at 31078 and moved further higher to touch an
Expiry 5-Feb-13 5-Mar-13 21-Jan-13 intra-day high of 31165. However, it failed to sustain higher and
Open 31,078 58,910 5,055 moved lower to touch an intra-day low of 30931. It ended the day
with modest losses to close at 30945.
High 31,165 59,340 5,090
Low 30,931 58,550 5,051 The Stochastic has slipped below its average and is also placed in
the over bought zone, which would lead to selling pressure and
Close 30,945 58,651 5,080 profit taking. However, the RSI is still placed above its average,
Prev. Close 31,042 58,938 5,049 which would lead to buying support at lower level. The +DI line, the
-DI line and ADX line are moving sideways, indicating a range
% Change -0.31% -0.49% 0.61%
bound trend. MCX Gold faces resistance at 31535, 31702 and
Source – MCX 31790 while the support levels are placed at 30916, 30475, 30366,
30150 and 29607.
Volume (In 000's)
MCX SILVER (5 MARCH 13) –
3-Jan-13 2-Jan-13 % Chg. Silver opened lower at 58910 but moved higher to touch an intra-
Gold (gms) 30,636.0 48,733.0 -37.14% day high of 59340. However, it failed to sustain higher and moved
lower to touch an intra-day low of 58550. It ended the day with
Silver (kgs) 1,706.6 2,657.8 -35.79% modest losses to close at 58651.
Crude (bbl) 15,792.7 19,439.5 -18.76%
The RSI and the Stochastic are placed above their respective
Source – MCX averages, which would lead to buying support. The +DI line has
moved above the -DI line and is also placed above the 25 level,
Turnover (In Lacs) indicating buyers are gaining strength. MCX Silver faces resistance
at 59483, 61484 and 63224 while the supports are placed at
3-Jan-13 2-Jan-13 % Chg.
57049, 56372 and 55952 levels.
Gold 951,487.8 1,510,213.6 -37.00%
MCX CRUDE (21 JANUARY 13) –
Silver 1,005,791.8 1,563,931.4 -35.69% Crude opened higher at 5055 but moved marginally lower to touch
Crude 800,632.3 984,261.9 -18.66% an intra-day low of 5051. However, it managed to bounce back
from lower levels to move higher and touched an intra-day high of
Source – MCX 5090. It ended the day with moderate gains to close at 5080.
Global Market (Nymex - $) The Stochastic has moved above its average. Moreover, the RSI is
04/01/2013 03/01/2013 % Chg.
already placed above its average. These positive conditions would
lead to buying support. However, both the RSI and Stochastic are
Gold (oz) 1,650.50 1,674.60 -1.44% also place in the over bought zone, which would lead to regular
Silver (oz) 29.62 30.73 -3.61% bouts of profit taking. The +DI line remains placed above the -DI
line and is also placed above the 34 level but has come off its
WTI Crude (bbl) 92.17 92.92 -0.81%
recent highs, indicating buyers are booking profits at regular
Brent Crude (bbl) 111.39 112.14 -0.67% intervals. It faces resistance at 5085, 5125 and 5157 while the
Dollar Index 80.01 79.85 0.20% supports are placed at 4989, 4788, 4755, and 4727
Source – www.cmegroup.com
Positional Call – BUY MCX CRUDE (21 JANUARY 13) above
4950, Stop Loss 4871 Target of 5125
Sanjay Bhatia (AVP – Technical Research)
Email sanjay@keynotecapitals.net Yahoo Id: keytechnicals@yahoo.in
NOTE – Stop Losses should be considered strictly on Closing
Basis
Keynote Capitals Ltd.
The Ruby, 9th Floor, Senapati Bapat Marg, Dadar (W), Mumbai – 400 028. Tel: 3026 6000. Fax: 3026 6088.
www.keynotecapitals.com
2. Commodity News:
Government may not lift the ban on guar futures
The government is unlikely to lift the suspension on guar futures in this financial year. The Forward Markets
Commission (FMC) is scheduled to review the ban with the Director General of Foreign Trade (DGFT) and the
stakeholders in Rajasthan before taking a decision. "The consumer ministry has asked FMC to conduct an on-ground
assessment with DGFT and the stakeholders in Rajasthan, which produces 80% of the crop. We will be able to take a
decision only after getting their views," said a consumer affairs ministry official.
HSBC cuts 2013 gold price outlook
Major bullion bank HSBC Holdings Plc cut its 2013 average gold price after factoring in a 2012 year-end price of
$1,675 an ounce. The bank cut its 2013 price forecast to $1,760 an ounce from $1,850. It kept its 2014 gold forecast at
$1,775 and introduced a 2015 forecast of $1,675 an ounce.
Source: ET
Economic Calendar:
Countries / Friday Monday Tuesday
Regions 04/13 07/13 08/13
India FX Reserves, USD (Dec 30)
Consumer Credit Change
US Nonfarm Payrolls (Dec)
(Nov)
Unemployment Rate (Dec)
ISM Non-Manufacturing PMI
(Dec)
HSBC China Services PMI Sentix Investor Confidence China Unemployment Rate
Global
(Dec) (Jan) n.s.a (MoM) (Dec)
Euro Markit Services PMI UK CB Leading Economic
Retail Sales (MoM) (Nov)
(Dec) Index (Dec)
Eruo Producer Price Euro Economic Sentiment
Index (MoM) (Nov) Indicator (Dec)
Keynote Capitals Ltd.
The Ruby, 9th Floor, Senapati Bapat Marg, Dadar (W), Mumbai – 400 028. Tel: 3026 6000. Fax: 3026 6088.
www.keynotecapitals.com
3. Disclaimer
This document is not for public distribution and has been furnished to you solely for your information and must not be reproduced or
redistributed to any other person. Persons into whose possession this document may come are required to observe these restrictions.
This material is for the personal information of the authorized recipient, and we are not soliciting any action based upon it. This report is not
to be construed as an offer to sell or the solicitation of an offer to buy any security in any jurisdiction where such an offer or solicitation
would be illegal. It is for the general information of clients of Keynote Capitals Ltd. It does not constitute a personal recommendation or
take into account the particular investment objectives, financial situations, or needs of individual clients.
We have reviewed the report, and in so far as it includes current or historical information, it is believed to be reliable though its accuracy or
completeness cannot be guaranteed. Neither Keynote Capitals Ltd., nor any person connected with it, accepts any liability arising from the
use of this document. The recipients of this material should rely on their own investigations and take their own professional advice. Price
and value of the investments referred to in this material may go up or down. Past performance is not a guide for future performance.
Certain transactions -including those involving futures, options and other derivatives as well as non-investment grade securities - involve
substantial risk and are not suitable for all investors. Reports based on technical analysis centers on studying charts of a stock’s price
movement and trading volume, as opposed to focusing on a company’s fundamentals and as such, may not match with a report on a
company’s fundamentals.
Opinions expressed are our current opinions as of the date appearing on this material only. While we endeavor to update on a reasonable
basis the information discussed in this material, there may be regulatory, compliance, or other reasons that prevent us from doing so.
Prospective investors and others are cautioned that any forward-looking statements are not predictions and may be subject to change
without notice. Our proprietary trading and investment businesses may make investment decisions that are inconsistent with the
recommendations expressed herein.
We and our affiliates, officers, directors, and employees world wide may: (a) from time to time, have long or short positions in, and buy or
sell the securities thereof, of company (ies) mentioned herein or (b) be engaged in any other transaction involving such securities and earn
brokerage or other compensation or act as a market maker in the financial instruments of the company (ies) discussed herein or act as
advisor or lender / borrower to such company (ies) or have other potential conflict of interest with respect to any recommendation and
related information and opinions.
The analyst for this report certifies that all of the views expressed in this report accurately reflect his or her personal views about the
subject company or companies and its or their securities, and no part of his or her compensation was, is or will be, directly or indirectly
related to specific recommendations or views expressed in this report.
No part of this material may be duplicated in any form and/or redistributed without Keynote Capitals Ltd’s., prior written consent.
Keynote Capitals Ltd.
The Ruby, 9th Floor, Senapati Bapat Marg, Dadar (W), Mumbai – 400 028. Tel: 3026 6000. Fax: 3026 6088.
www.keynotecapitals.com