1. Daily Derivatives Outlook
14 January 2013
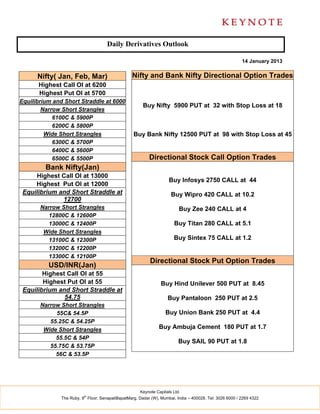
Nifty( Jan, Feb, Mar) Nifty and Bank Nifty Directional Option Trades
Highest Call OI at 6200
Highest Put OI at 5700
Equilibrium and Short Straddle at 6000
Buy Nifty 5900 PUT at 32 with Stop Loss at 18
Narrow Short Strangles
6100C & 5900P
6200C & 5800P
Wide Short Strangles Buy Bank Nifty 12500 PUT at 98 with Stop Loss at 45
6300C & 5700P
6400C & 5600P
6500C & 5500P Directional Stock Call Option Trades
Bank Nifty(Jan)
Highest Call OI at 13000
Buy Infosys 2750 CALL at 44
Highest Put OI at 12000
Equilibrium and Short Straddle at Buy Wipro 420 CALL at 10.2
12700
Narrow Short Strangles Buy Zee 240 CALL at 4
12800C & 12600P
13000C & 12400P Buy Titan 280 CALL at 5.1
Wide Short Strangles
13100C & 12300P Buy Sintex 75 CALL at 1.2
13200C & 12200P
13300C & 12100P
Directional Stock Put Option Trades
USD/INR(Jan)
Highest Call OI at 55
Highest Put OI at 55 Buy Hind Unilever 500 PUT at 8.45
Equilibrium and Short Straddle at
54.75 Buy Pantaloon 250 PUT at 2.5
Narrow Short Strangles
55C& 54.5P Buy Union Bank 250 PUT at 4.4
55.25C & 54.25P
Wide Short Strangles Buy Ambuja Cement 180 PUT at 1.7
55.5C & 54P
Buy SAIL 90 PUT at 1.8
55.75C & 53.75P
56C & 53.5P
Keynote Capitals Ltd.
th
The Ruby, 9 Floor, SenapatiBapatMarg, Dadar (W), Mumbai, India – 400028. Tel: 3026 6000 / 2269 4322
2. READY RECKONER ON BASIC OPTION AND TECHNICAL STRATEGIES :
1. Options are Wasting Assets with Option Pricing like Insurance Pricing.
2. Strike Price is similar to Age of the Assets.
3. OTM are Low Probability strikes (young assets), ATM are equal probability strikes
(average age assets) and ITM are High Probability strikes ( old assets).
4. Premium reduces from ITM to ATM to OTM as probability of event happening reduces.
5. Mirror Image Concept : OTM for Calls is same as ITM for Puts and ITM for Calls is
same as OTM for Puts.
6. View for Strike Selection : OTM - Strong conviction. ATM - Moderate conviction .
ITM – Low Conviction
7. Call-Put Parity : Futures Price = Strike Price + Call Premium – Put Premium
8. Greeks – Delta is the Probability. Gamma is the Change in Delta. Theta is the change
in time remaining.
9. Vega is the Change in Volatility (VIX) and Rho is the Change in Interest Rate.
10. If VIX ( Volatility Index) is above average selling options is preferred and if VIX is below
average buying options is preferred.
11. The skew between Historical Volatility(Realized Volatility) and Implied Volatility
and between Call Implied Volatility and Put Implied Volatility varies with Market
Sentiment.
12. Advantages of Options – Profit from Trading range Markets, High Leverage, Built-in
Stop Loss, Higher Probability of Profit using Spread Trades, Increase in trading
opportunities due to multiple legs, Lower Margin requirements due to high gearing in
options, Increase in Reward to Risk ratio.
13. Risk Management using options - Quantify the maximum risk and maximum reward
and the breakeven points of a position before committing capital. A risk manager always
focuses on how much can be lost in a position. Control the losses and the profits will
take care of themselves. Determine an exit strategy in advance for every trade initiated.
An exit strategy enables closure of loss-making positions unemotionally so that there is
no freeze or panic when confronted with the loss.
14. Trading is a business – fire your loss-making positions and keep your profitable
positions – like you would fire your underperforming employees and retain the
successful ones.
15. Stop Loss : Use 50% stop loss for bought options and 100% stop loss for sold
options.
16. Profit Taking : Book profits at 100% for bought options and 50% for sold options.
17. Put Call Ratio ( Open Interest) is bullish at levels between 0.8 to 1.2 and bearish
between 1.75 to 2.
18. Equilibrium strike is with equal Call and Put Open interest with Highest Call Open
interest strike as resistance and Highest Put Open interest as support.
19. Long Call and Long Put are Limited Risk and Unlimited Reward strategies.
Keynote Capitals Ltd.
th
The Ruby, 9 Floor, SenapatiBapatMarg, Dadar (W), Mumbai, India – 400028. Tel: 3026 6000 / 2269 4322
3. 20. Short Call and Short Put are Unlimited Risk and Limited Reward strategies.
21. Long Synthetic and Short Synthetic are Unlimited Risk and Unlimited Reward
strategies used instead of futures to save margin.
22. Long Straddle, Long Strangle and Long Guts are Long volatility strategies ahead of
events/results etc.
23. Short Straddle, Short Strangle and Short Guts are Short volatility strategies when
range-bound action is anticipated.
24. Protective Put and Protective Call protect futures positions by buying options.
25. Covered Call/Ratio Call Write Put and Covered Put/Ratio Put Write cover futures
positions by selling options. They involve unlimited risk and limited reward.
26. Collar is a combination of the Covered Call and the Protective Put or the Covered Put
and the Protective Call.
27. Bull Call Spread , Ratio Bull Call Spread and Bull Call Ladder are bullish debit
spreads which involve buying a lower call option and selling upper call options.
28. Bear Put Spread, Ratio Bear Spread and Bear Ladder are bearish debit spreads
which involve buying a upper Put option and selling a lower Put option.
29. Bull Put Spread is a bullish credit spread which involves selling a upper put option and
buying a lower put option.
30. Bear Call Spread is a bearish credit spread which involves selling a lower call option
and buying a upper call option.
31. Long Iron Butterfly is a combination of the Bull Put Spread and Bear Call Spread while
Short Iron Butterfly is a combination of the Bull Call Spread and Bear Put Spread.
32. Long Term Options can be used to create investment grade positions using spreads,
synthetics and covered /protective positions.
33. Calendar/Diagonal Calls is a debit spread involving buying a long-dated call option and
selling a short-dated call option against it ( Diagonal Calls involve different strikes).
34. Calendar/Diagonal Puts is a debit spread involves buying a long-dated put option and
selling a short-dated put option against it ( Diagonal Puts involve different strikes).
35. Delta hedging methods – The distance between consecutive delta adjustments should
be fixed so that the position is totally hedged by the time the breakeven point is
reached. Short gamma positions carry the maximum risk and using options instead of
futures to hedge is advisable since futures does not cover the gap risk, while using ITM
options covers the gap risk
36. Buy call options at Support ( Bottom-fishing) and above resistance ( Breakout) .
37. Buy Put options at Resistance ( Top-picking) and Below Support ( Breakdown).
38. Moving Average Crossovers – Buy call options if price crosses the moving average
from below and buy put options if price crosses moving average from above.
39. The one month options can be linked to the 20dma with the three month options
linked to the 50dma and the 1 year options linked to the 200dma.
Keynote Capitals Ltd.
th
The Ruby, 9 Floor, SenapatiBapatMarg, Dadar (W), Mumbai, India – 400028. Tel: 3026 6000 / 2269 4322
4. 40. RSI – Buy call options when RSI is below 30 and Buy put options when RSI is above
70. The RSI 50 crossover can be used to buy calls on the upside crossover and to buy
puts on the downside crossover.
41. MACD and Parabolic SAR early warning buy signals indicate buying of calls ( bottom-
fishing) and sell signals indicate buying of puts ( top-picking).
42. ADX indicates the strength of the trend and whether the market is in a trending or
trading mode. When ADX is above 25 and +DI is above –DI then buy calls and if –DI is
above +DI then buy puts. When ADX is below 25, then selling strangles and straddles
will be profitable.
43. Widening Bollinger Bands indicate increasing volatility and option buying is
advised as a trending move is expected.
44. Flat or Narrowing Bollinger Bands indicate reducing volatility and range-bound
option selling strategies are advised.
45. Market Breadth Indicators – Volume and Delivery Volume Expansion, Open Interest
Expansion and Contraction, Advance/Decline Ratio, 52 Week Highs/Lows.
46. Open Interest Expansion and Contraction Rules – Price Up and Open Interest Up –
Long Buildup, Price Up and Open Interest Down – Profit Taking, Price Down and
Open Interest Up – Short Buildup, Price Down and Open Interest Down – Short
Covering.
47. Defensive stocks have low to moderate beta in sectors like FMCG, Healthcare, IT,
Cement, Telecom.
48. Cyclical stocks have high beta like Financials and Rate Sensitives like Auto,
Infrastructure, Realty.
49. Stock Selection – Invest in the constituents from broadbased indices like Nifty, Junior
Nifty and Midcap as well as constituents of Sectoral Indices like Auto, Banking, Capital
Goods, IT, FMCG, HC etc.
50. Alpha Strategies - Long Stock and Short Index( Outperformance) or Short Stock and
Long Index ( Underperformance).
51. Pair Strategies - Long Stock and Short Stock within the same sector.
Keynote Capitals Ltd.
th
The Ruby, 9 Floor, SenapatiBapatMarg, Dadar (W), Mumbai, India – 400028. Tel: 3026 6000 / 2269 4322
5. Disclaimer
This document is not for public distribution and has been furnished to you solely for your information and must not be reproduced or
redistributed to any other person. Persons into whose possession this document may come are required to observe these restrictions.
This material is for the personal information of the authorized recipient, and we are not soliciting any action based upon it. This report
is not to be construed as an offer to sell or the solicitation of an offer to buy any security in any jurisdiction where such an offer or
solicitation would be illegal. It is for the general information of clients of Keynote Capitals Ltd. It does not constitute a personal
recommendation or take into account the particular investment objectives, financial situations, or needs of individual clients.
We have reviewed the report, and in so far as it includes current or historical information, it is believed to be reliable though its
accuracy or completeness cannot be guaranteed. Neither Keynote Capitals Ltd., nor any person connected with it, accepts any liability
arising from the use of this document. The recipients of this material should rely on their own investigations and take their own
professional advice. Price and value of the investments referred to in this material may go up or down. Past performance is not a guide
for future performance. Certain transactions -including those involving futures, options and other derivatives as well as non-investment
grade securities - involve substantial risk and are not suitable for all investors. Reports based on technical analysis centers on studying
charts of a stock’s price movement and trading volume, as opposed to focusing on a company’s fundamentals and as such, may not
match with a report on a company’s fundamentals.
Opinions expressed are our current opinions as of the date appearing on this material only. While we endeavor to update on a
reasonable basis the information discussed in this material, there may be regulatory, compliance, or other reasons that prevent us
from doing so. Prospective investors and others are cautioned that any forward-looking statements are not predictions and may be
subject to change without notice. Our proprietary trading and investment businesses may make investment decisions that are
inconsistent with the recommendations expressed herein.
We and our affiliates, officers, directors, and employees world wide may: (a) from time to time, have long or short positions in, and buy
or sell the securities thereof, of company (ies) mentioned herein or (b) be engaged in any other transaction involving such securities
and earn brokerage or other compensation or act as a market maker in the financial instruments of the company (ies) discussed herein
or act as advisor or lender / borrower to such company (ies) or have other potential conflict of interest with respect to any
recommendation and related information and opinions.
The analyst for this report certifies that all of the views expressed in this report accurately reflect his or her personal views about the
subject company or companies and its or their securities, and no part of his or her compensation was, is or will be, directly or indirectly
related to specific recommendations or views expressed in this report.
No part of this material may be duplicated in any form and/or redistributed without Keynote Capitals Ltd’s., prior written consent.
Keynote Capitals Ltd.
th
The Ruby, 9 Floor, SenapatiBapatMarg, Dadar (W), Mumbai, India – 400028. Tel: 3026 6000 / 2269 4322