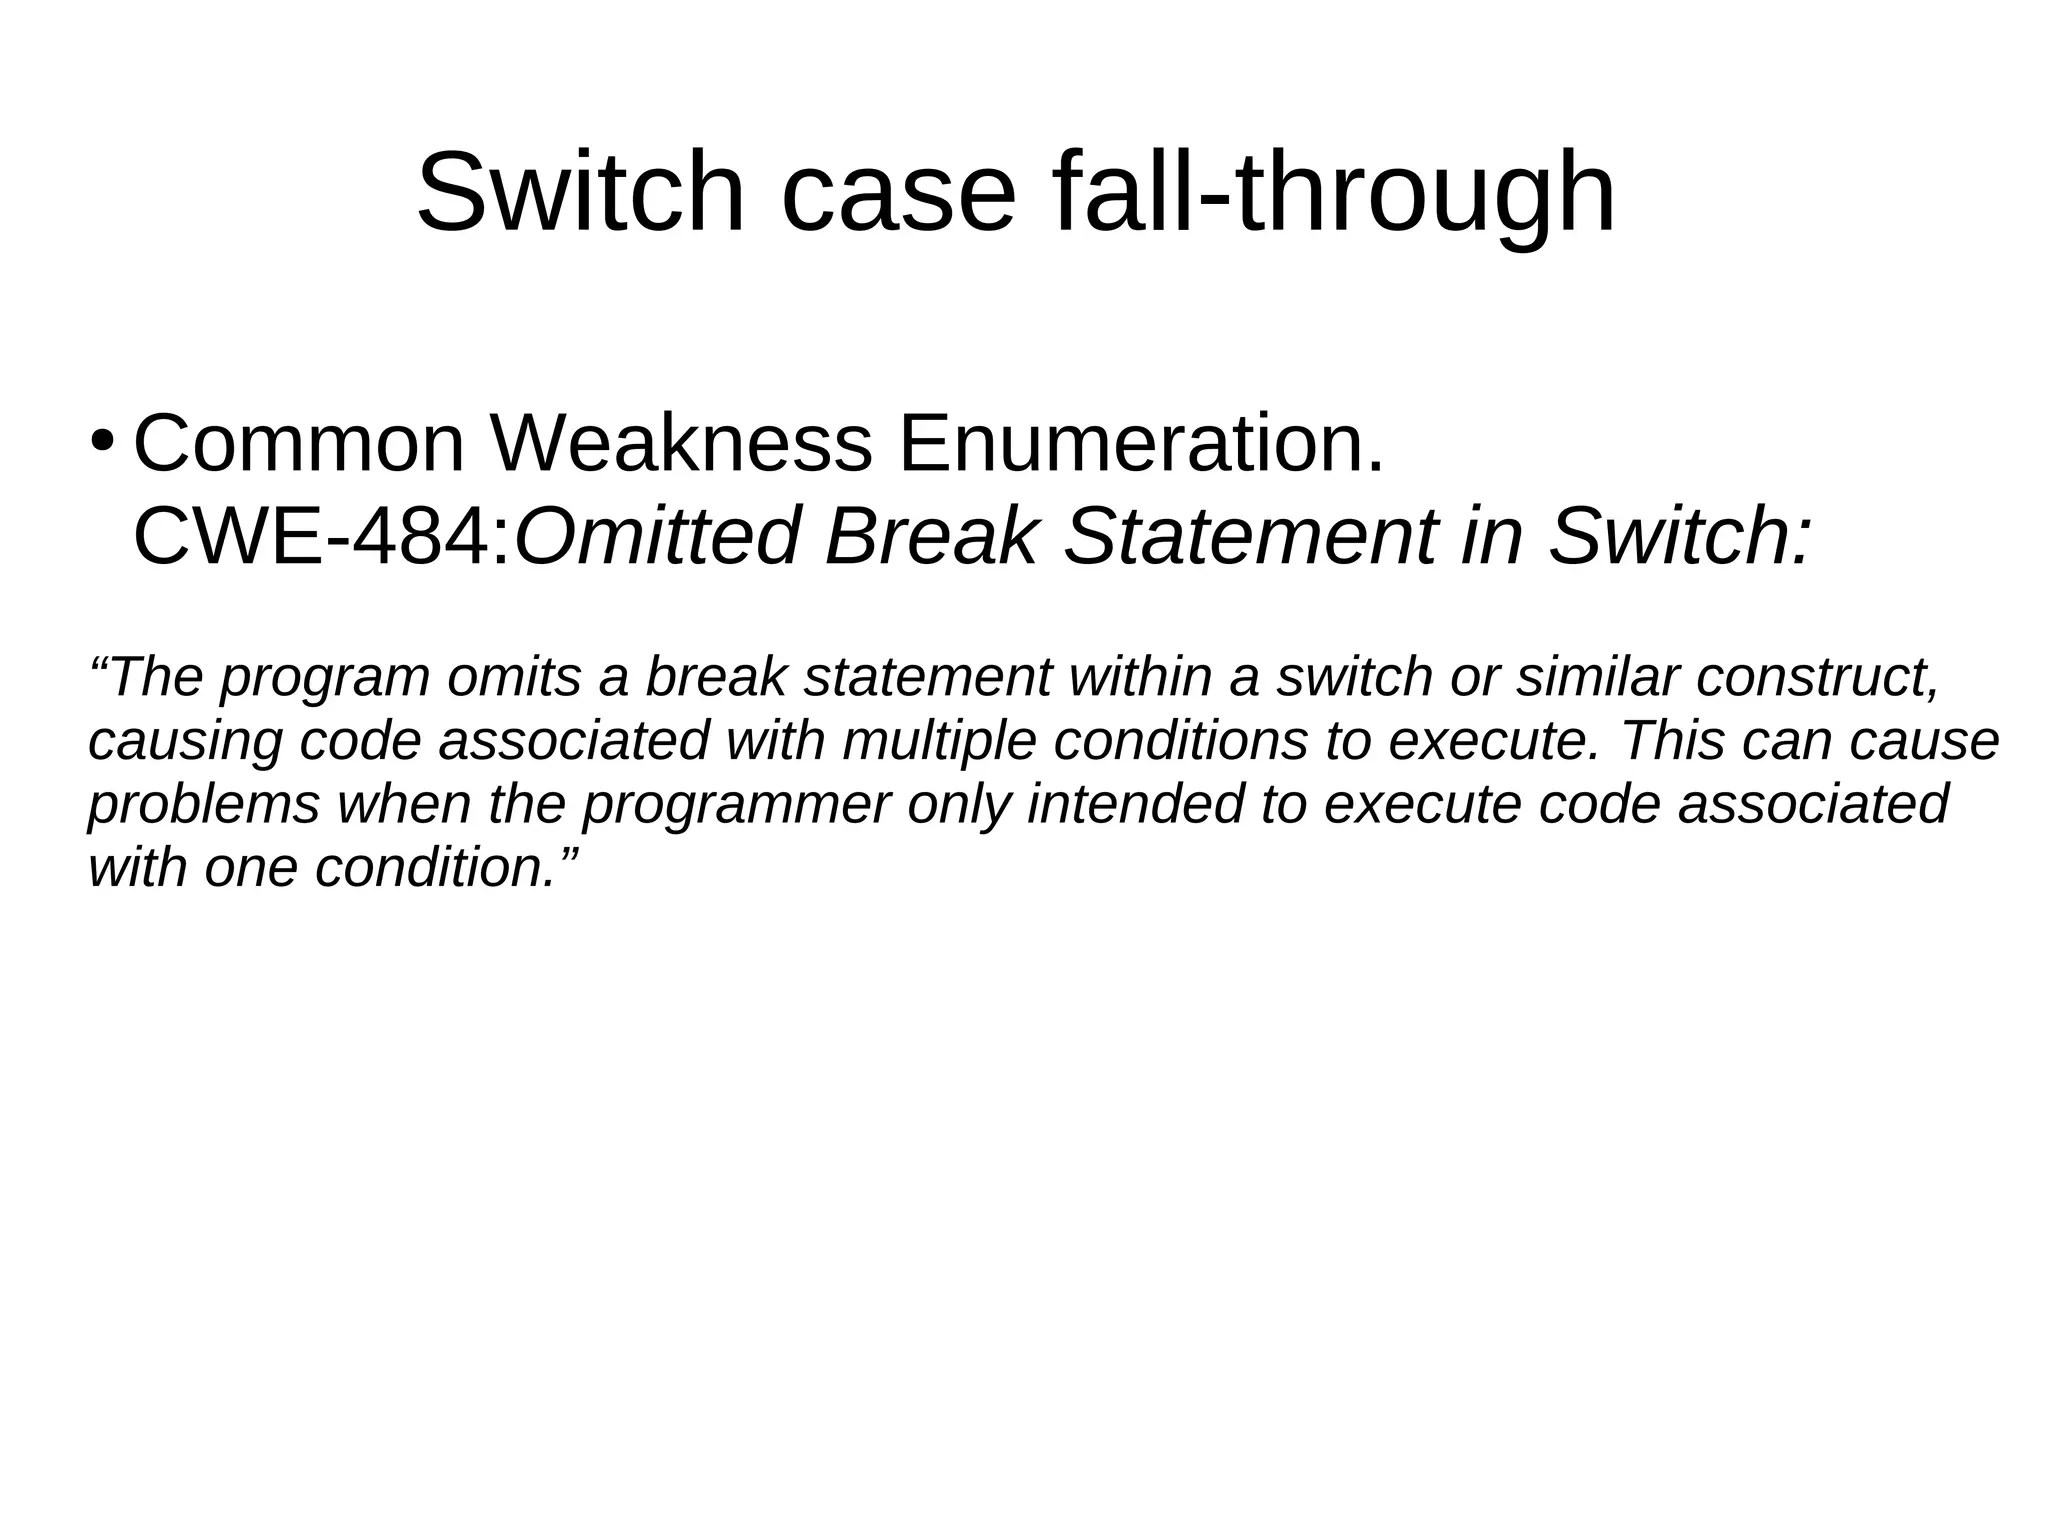
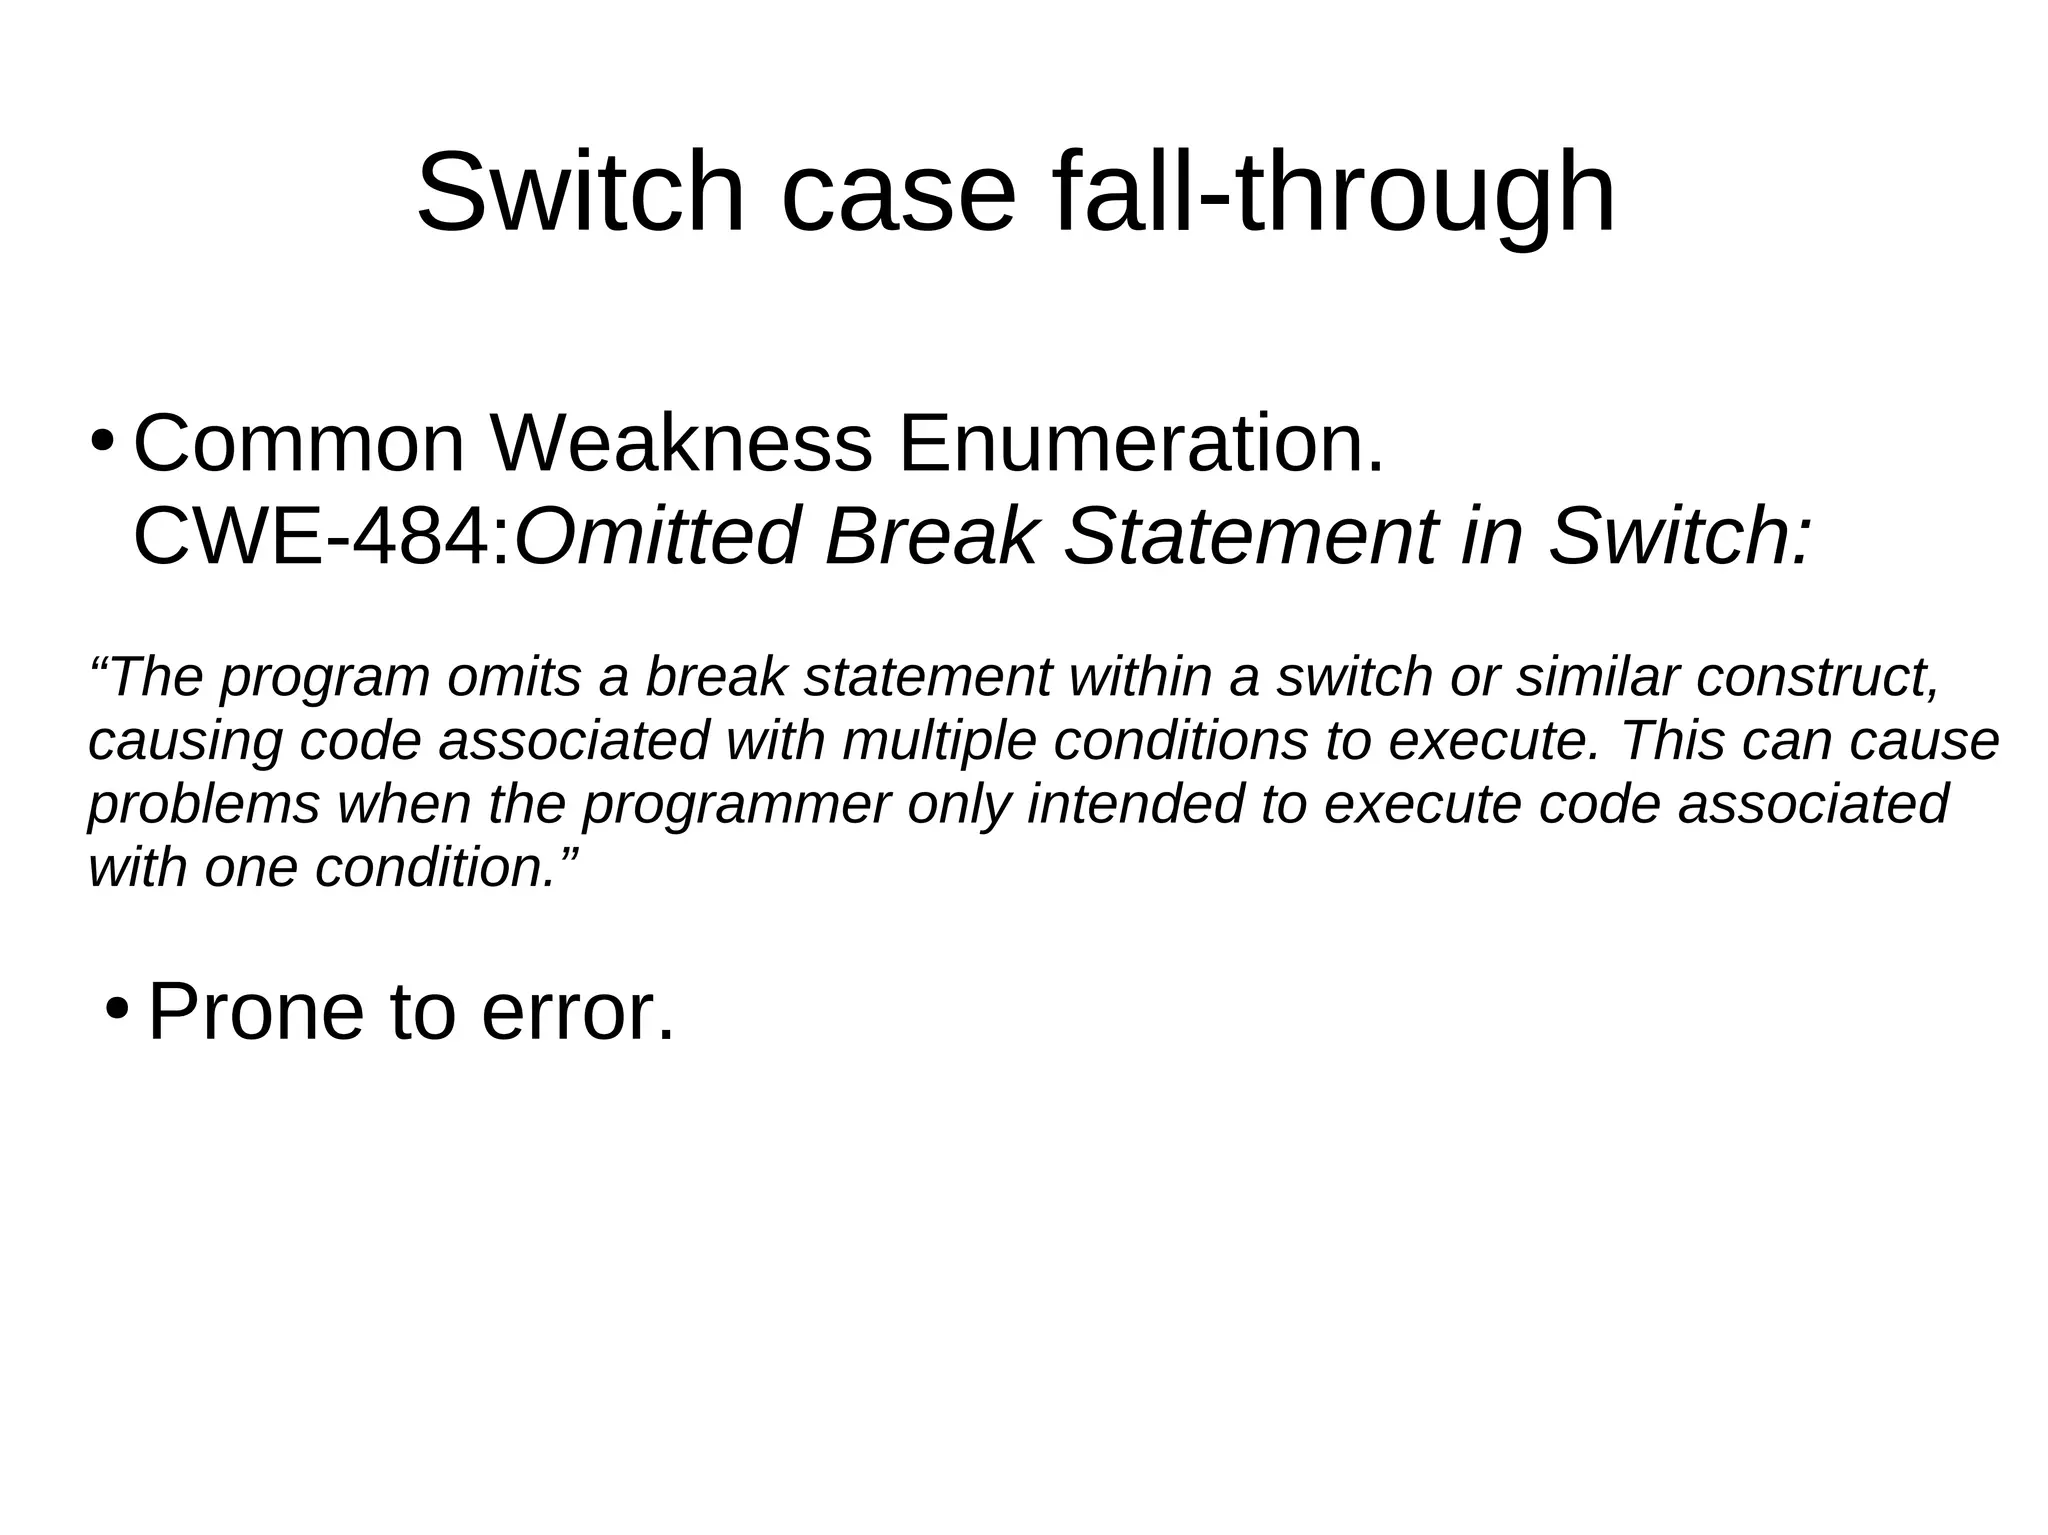
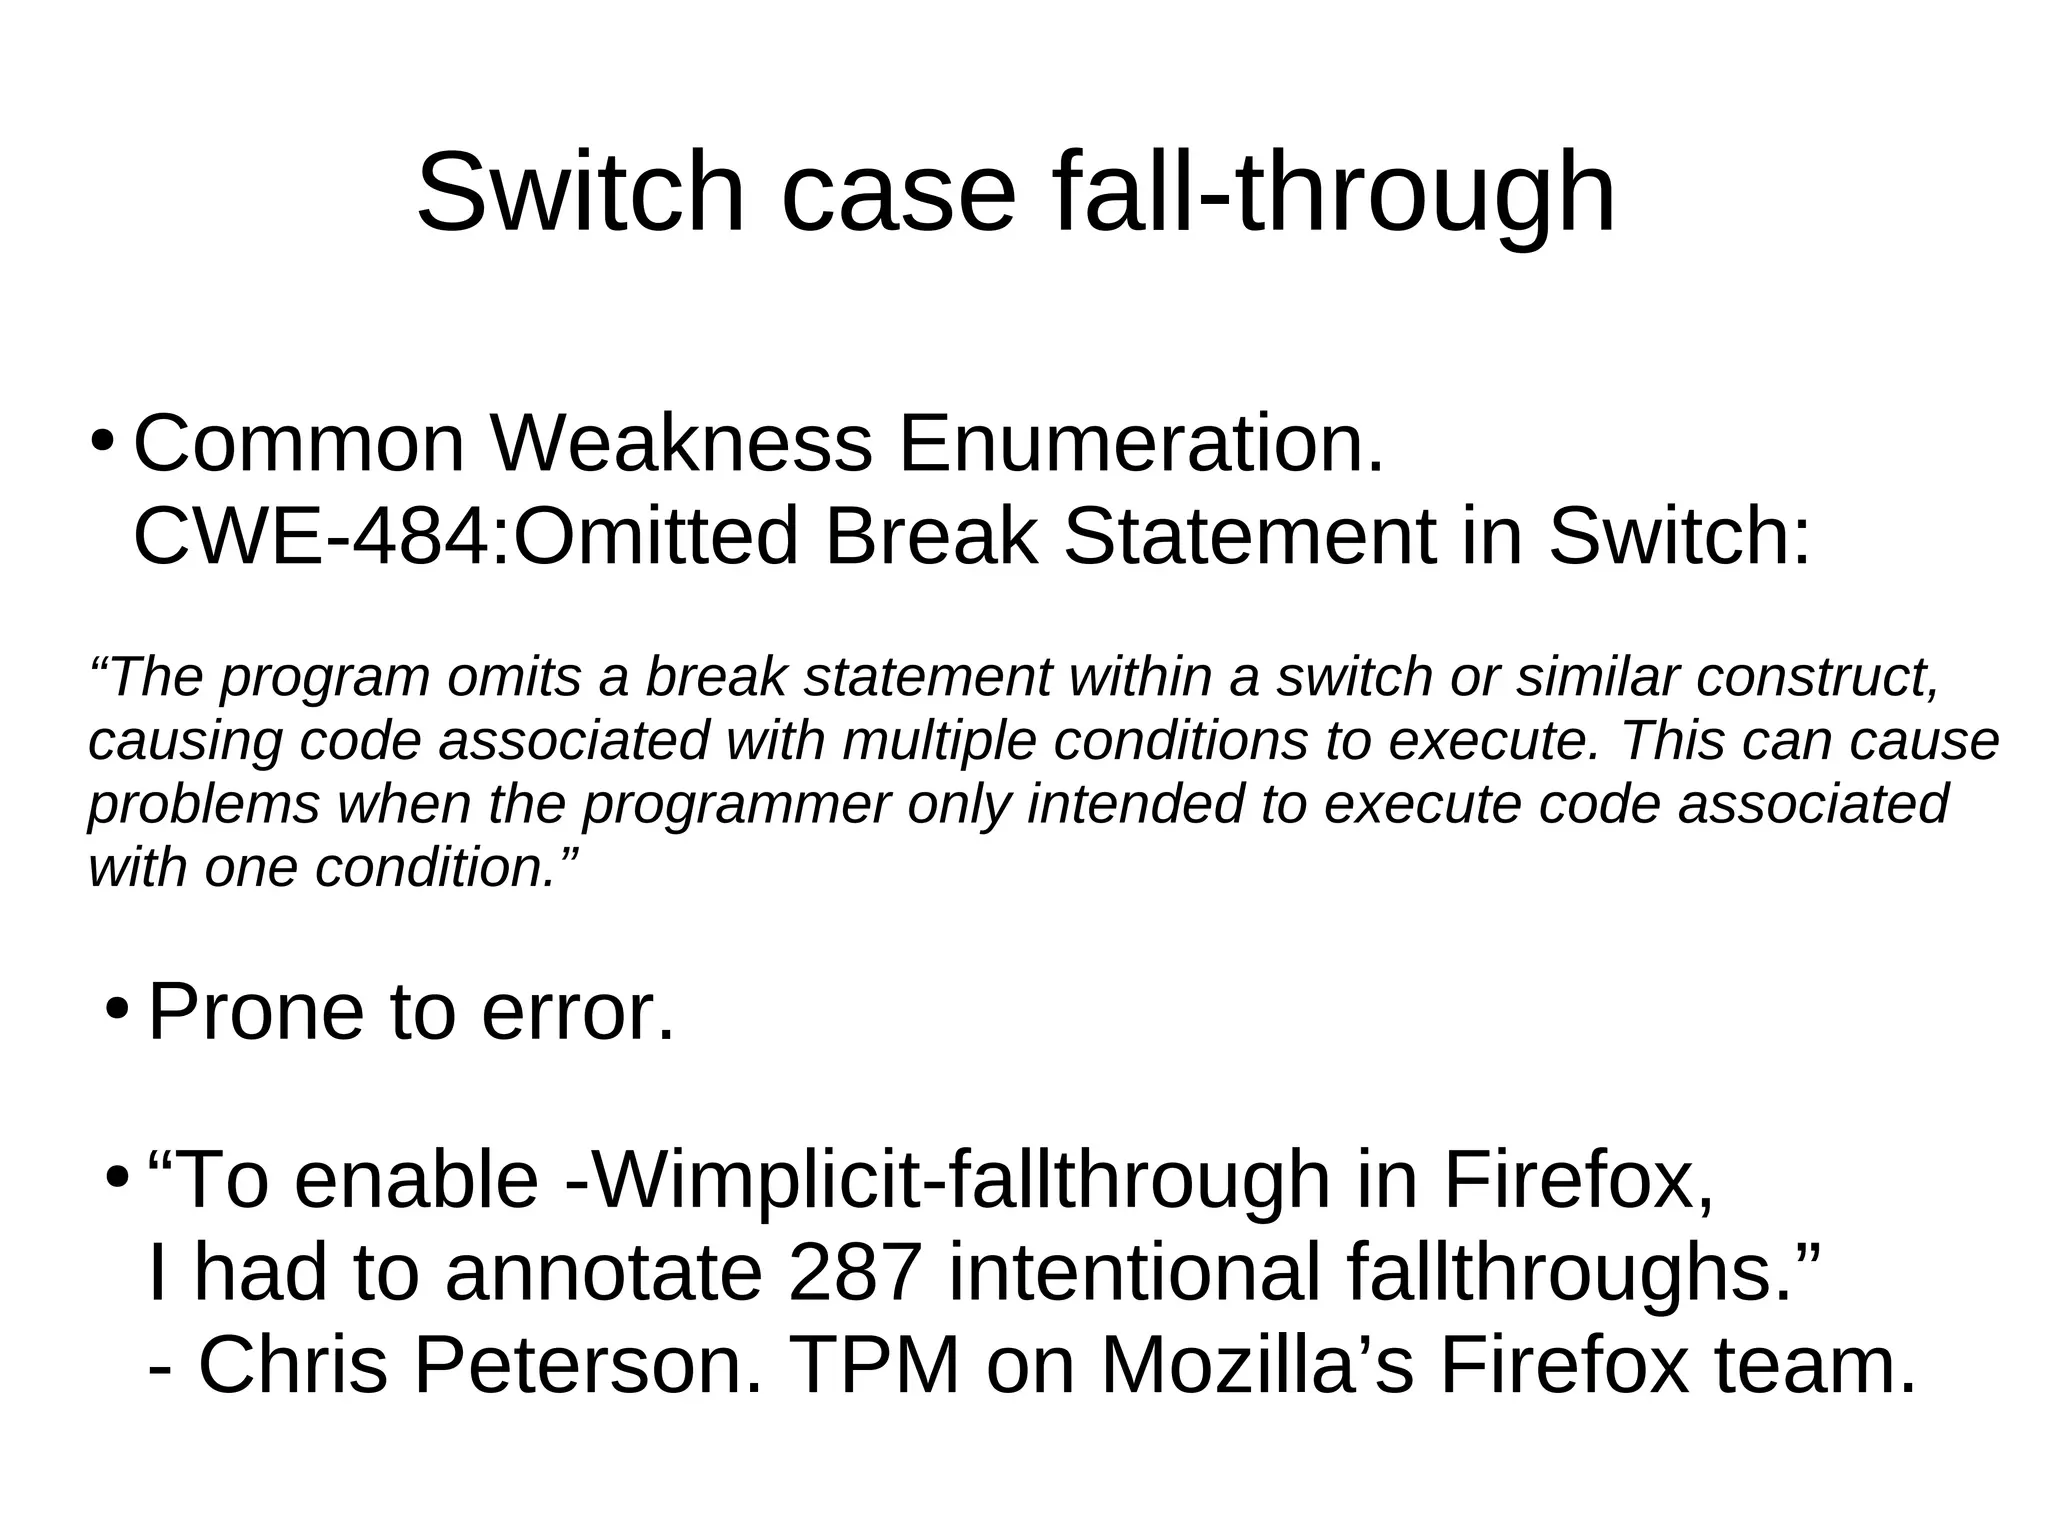
Downloaded 55 times
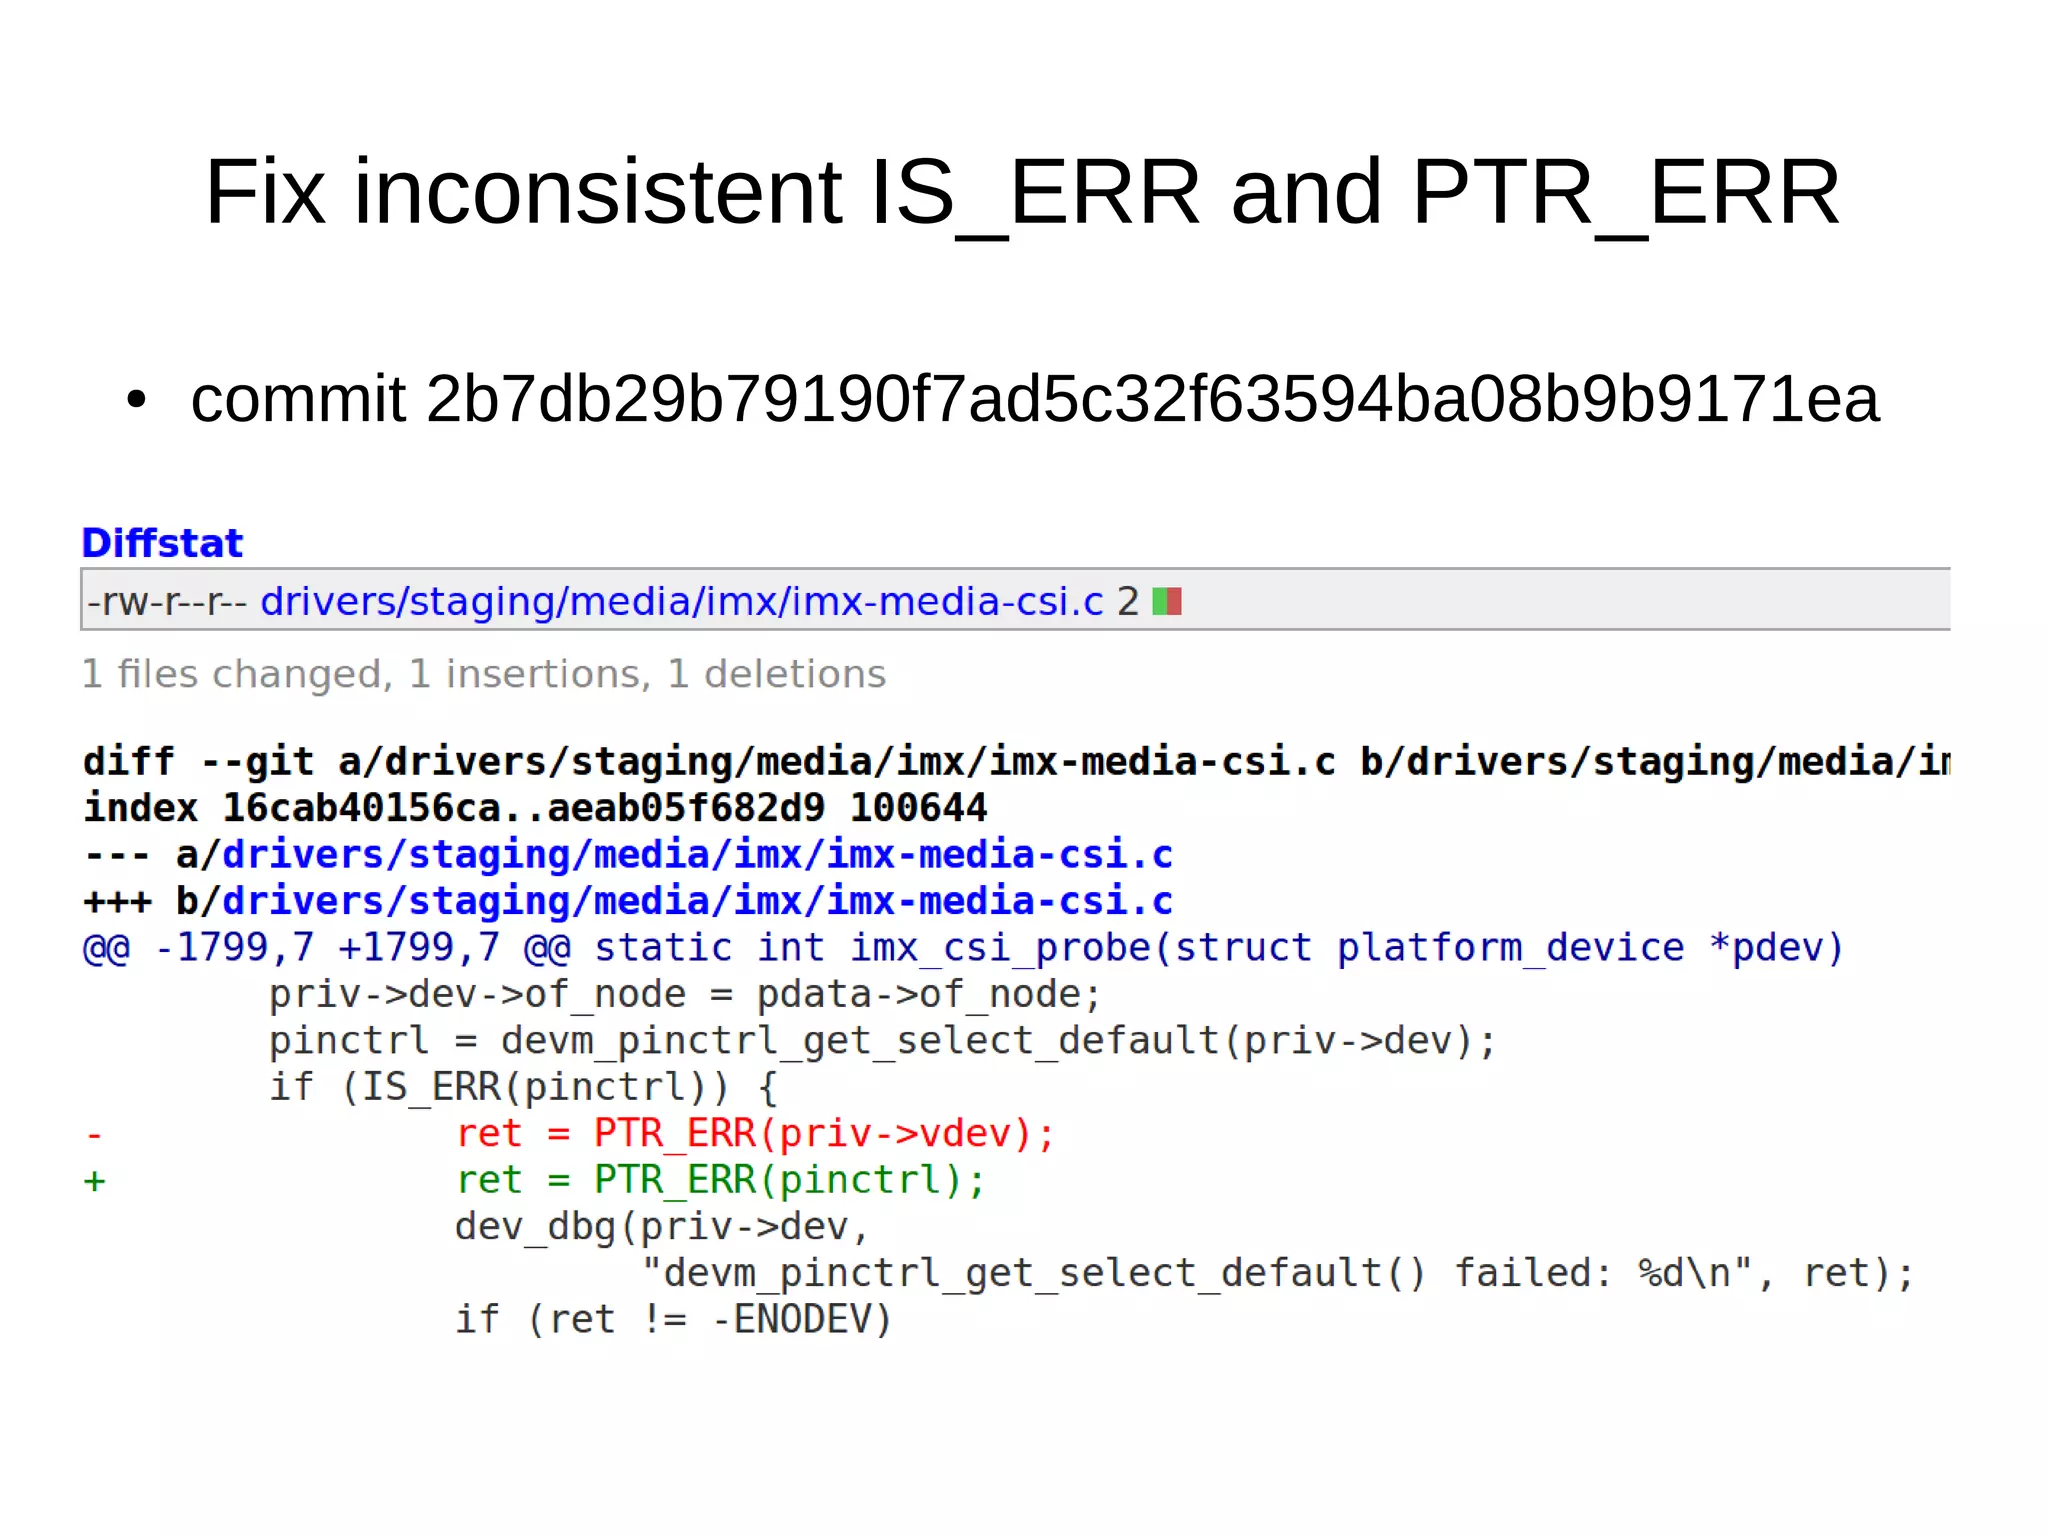
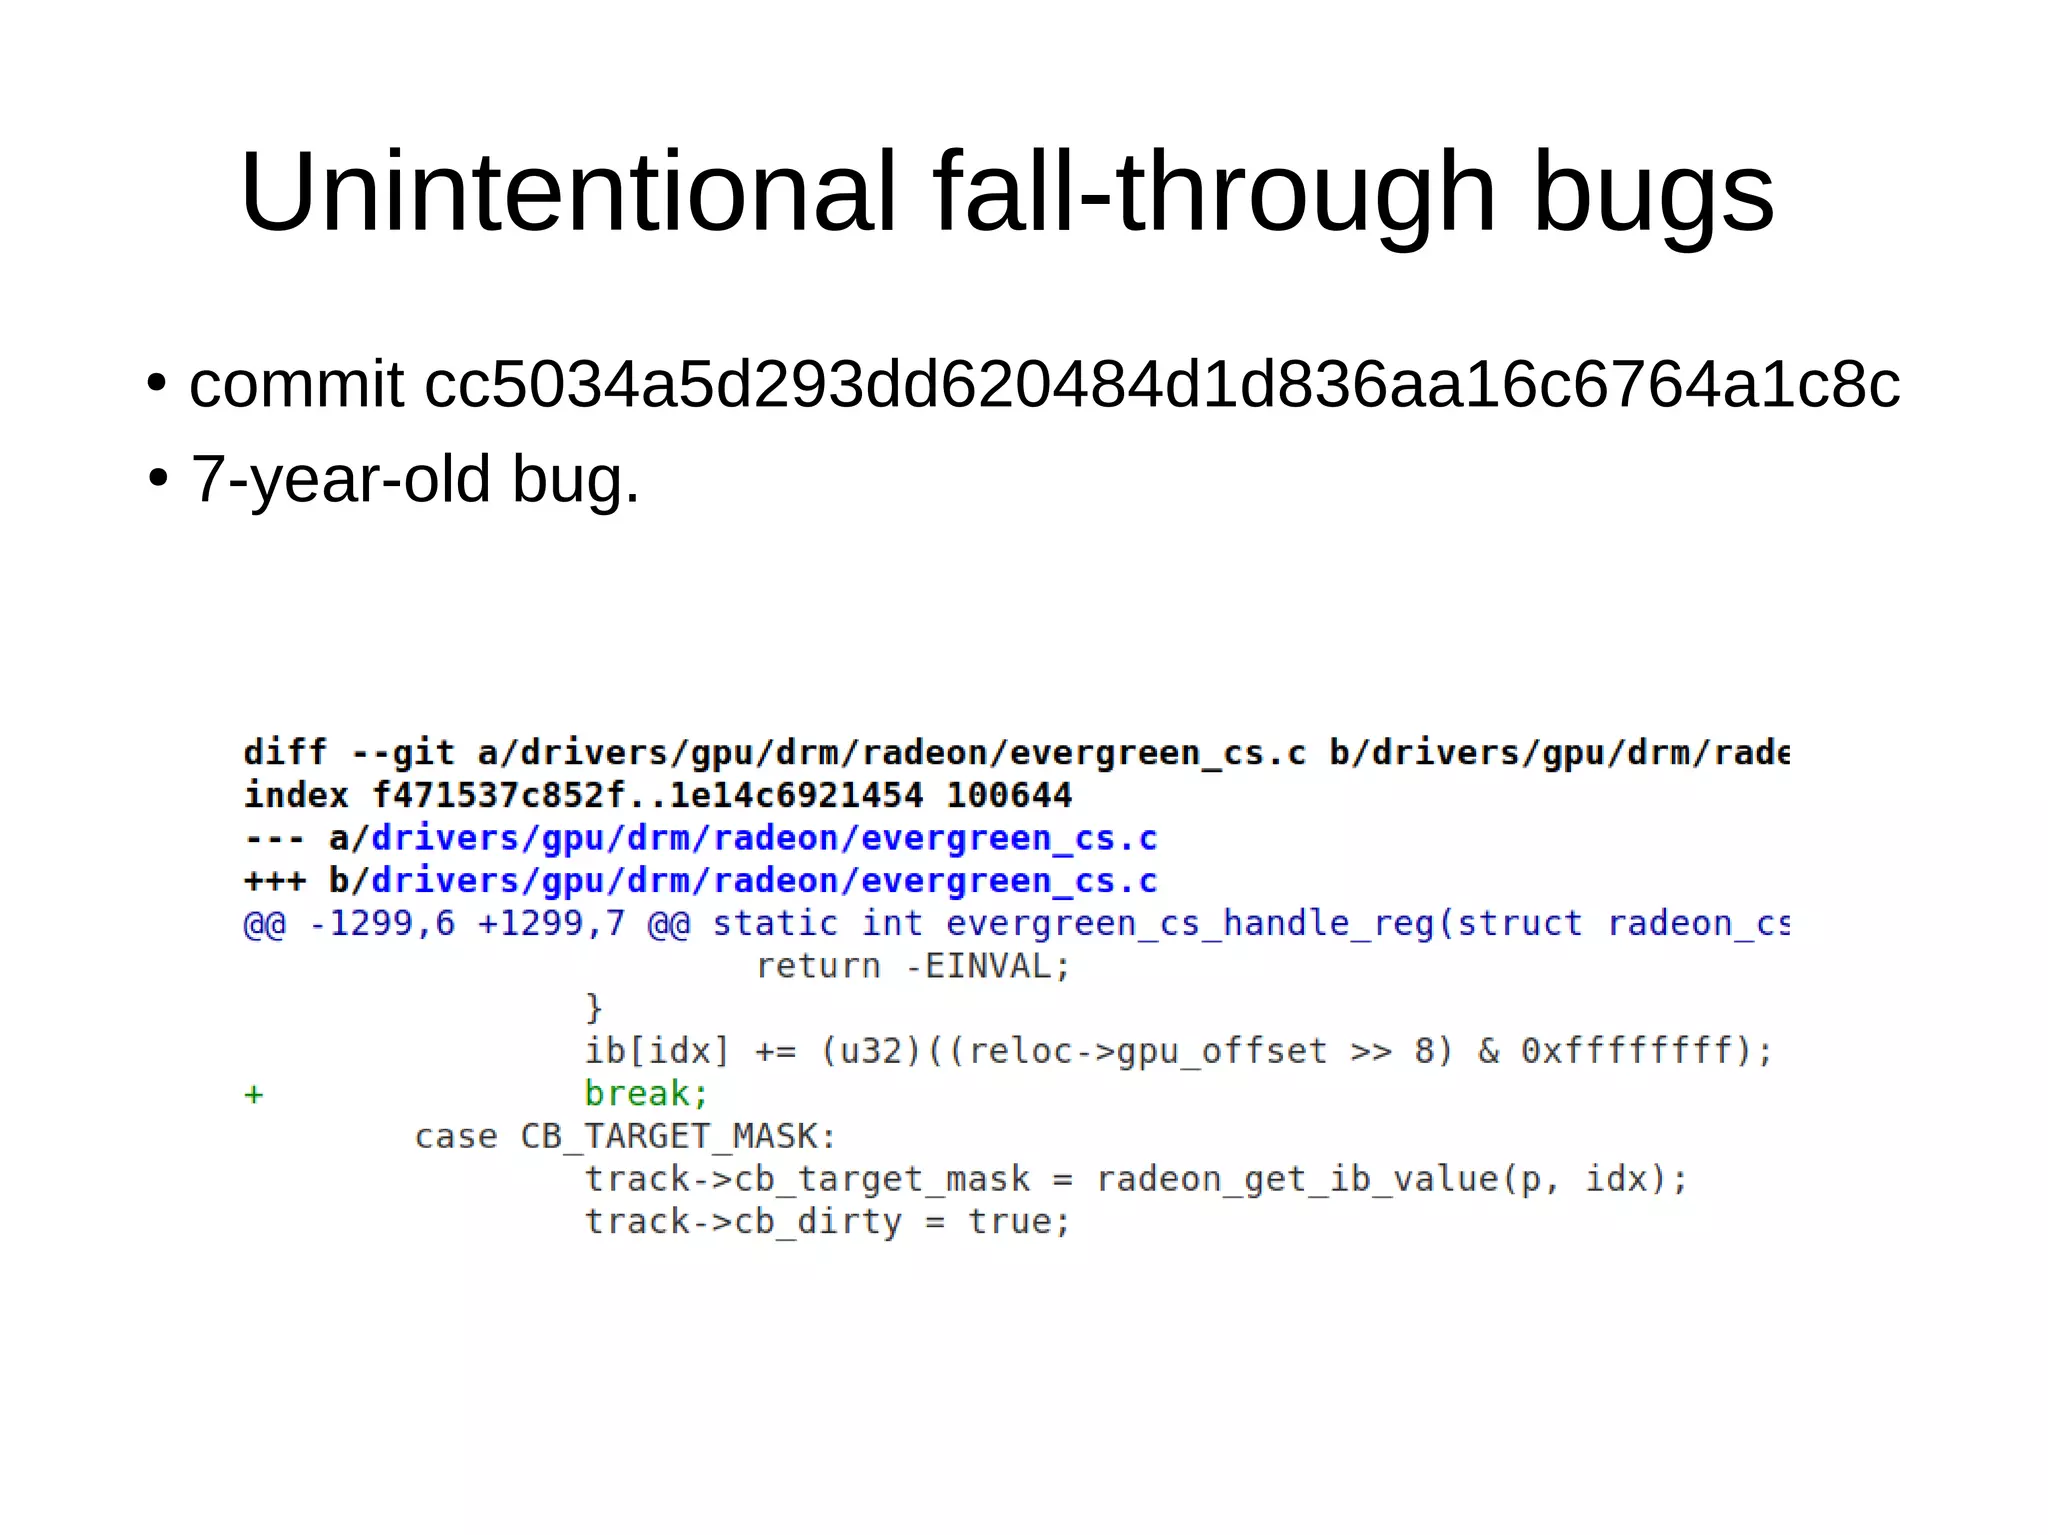
![● commit fe78627d430435d22316fe39f2012ece31bf23c2
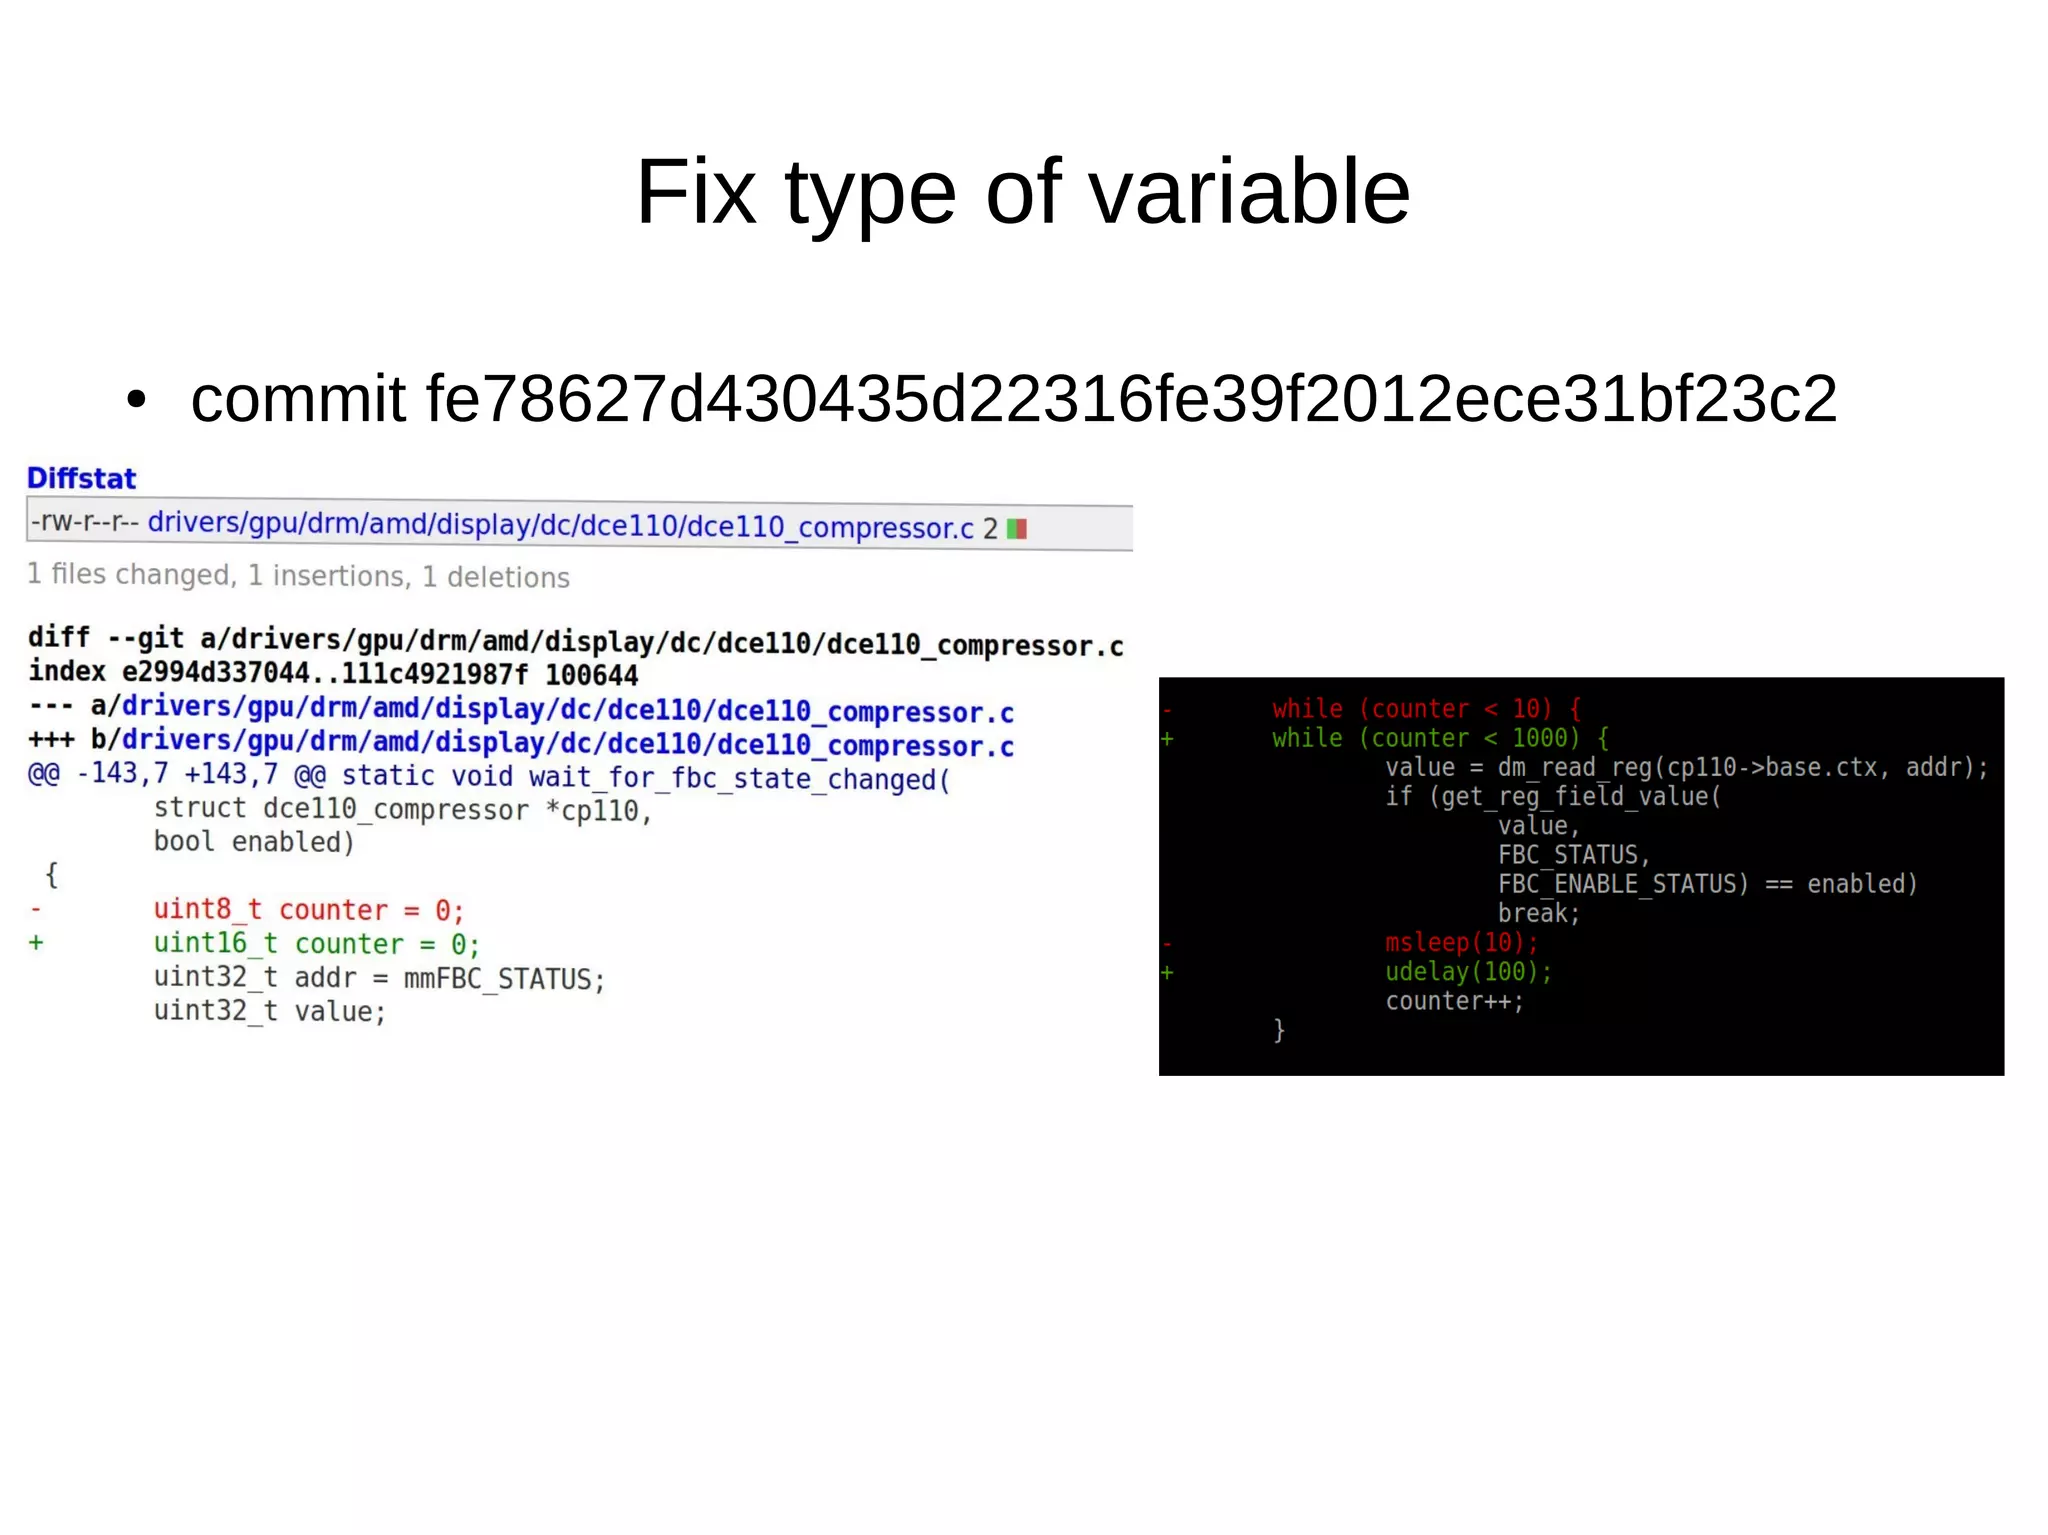
Fix type of variable
●
uint8_t → [0-255]](https://image.slidesharecdn.com/gustavoarsilvakr2019-191001155204/75/Kernel-Recipes-2019-Hunting-and-fixing-bugs-all-over-the-Linux-kernel-14-2048.jpg)
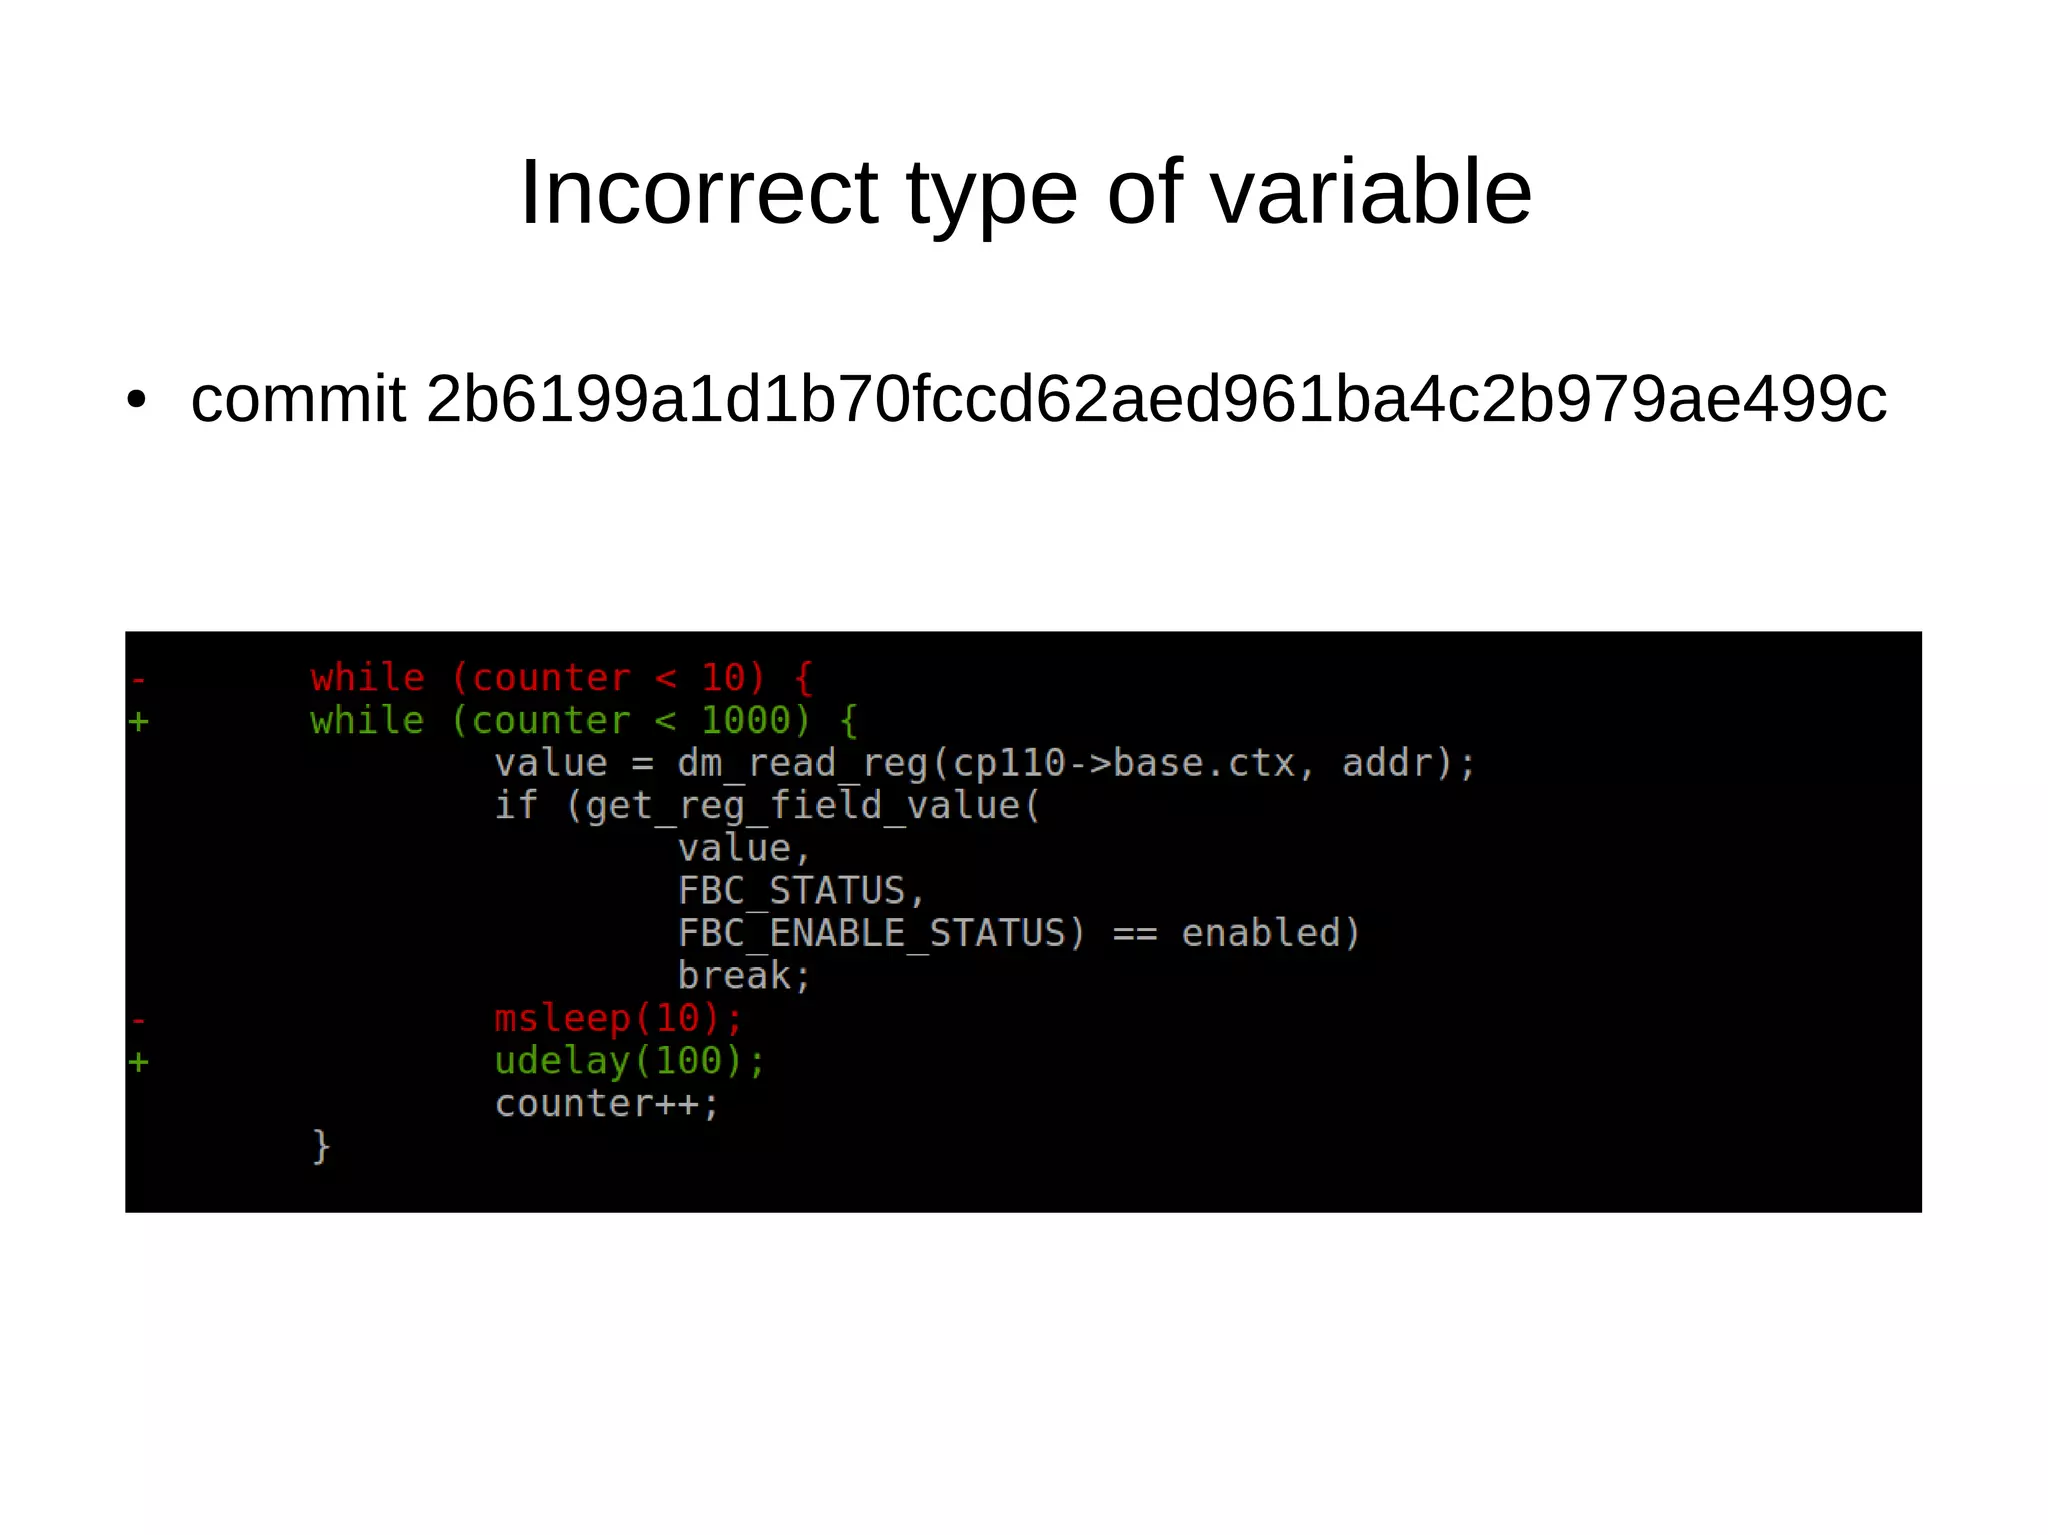
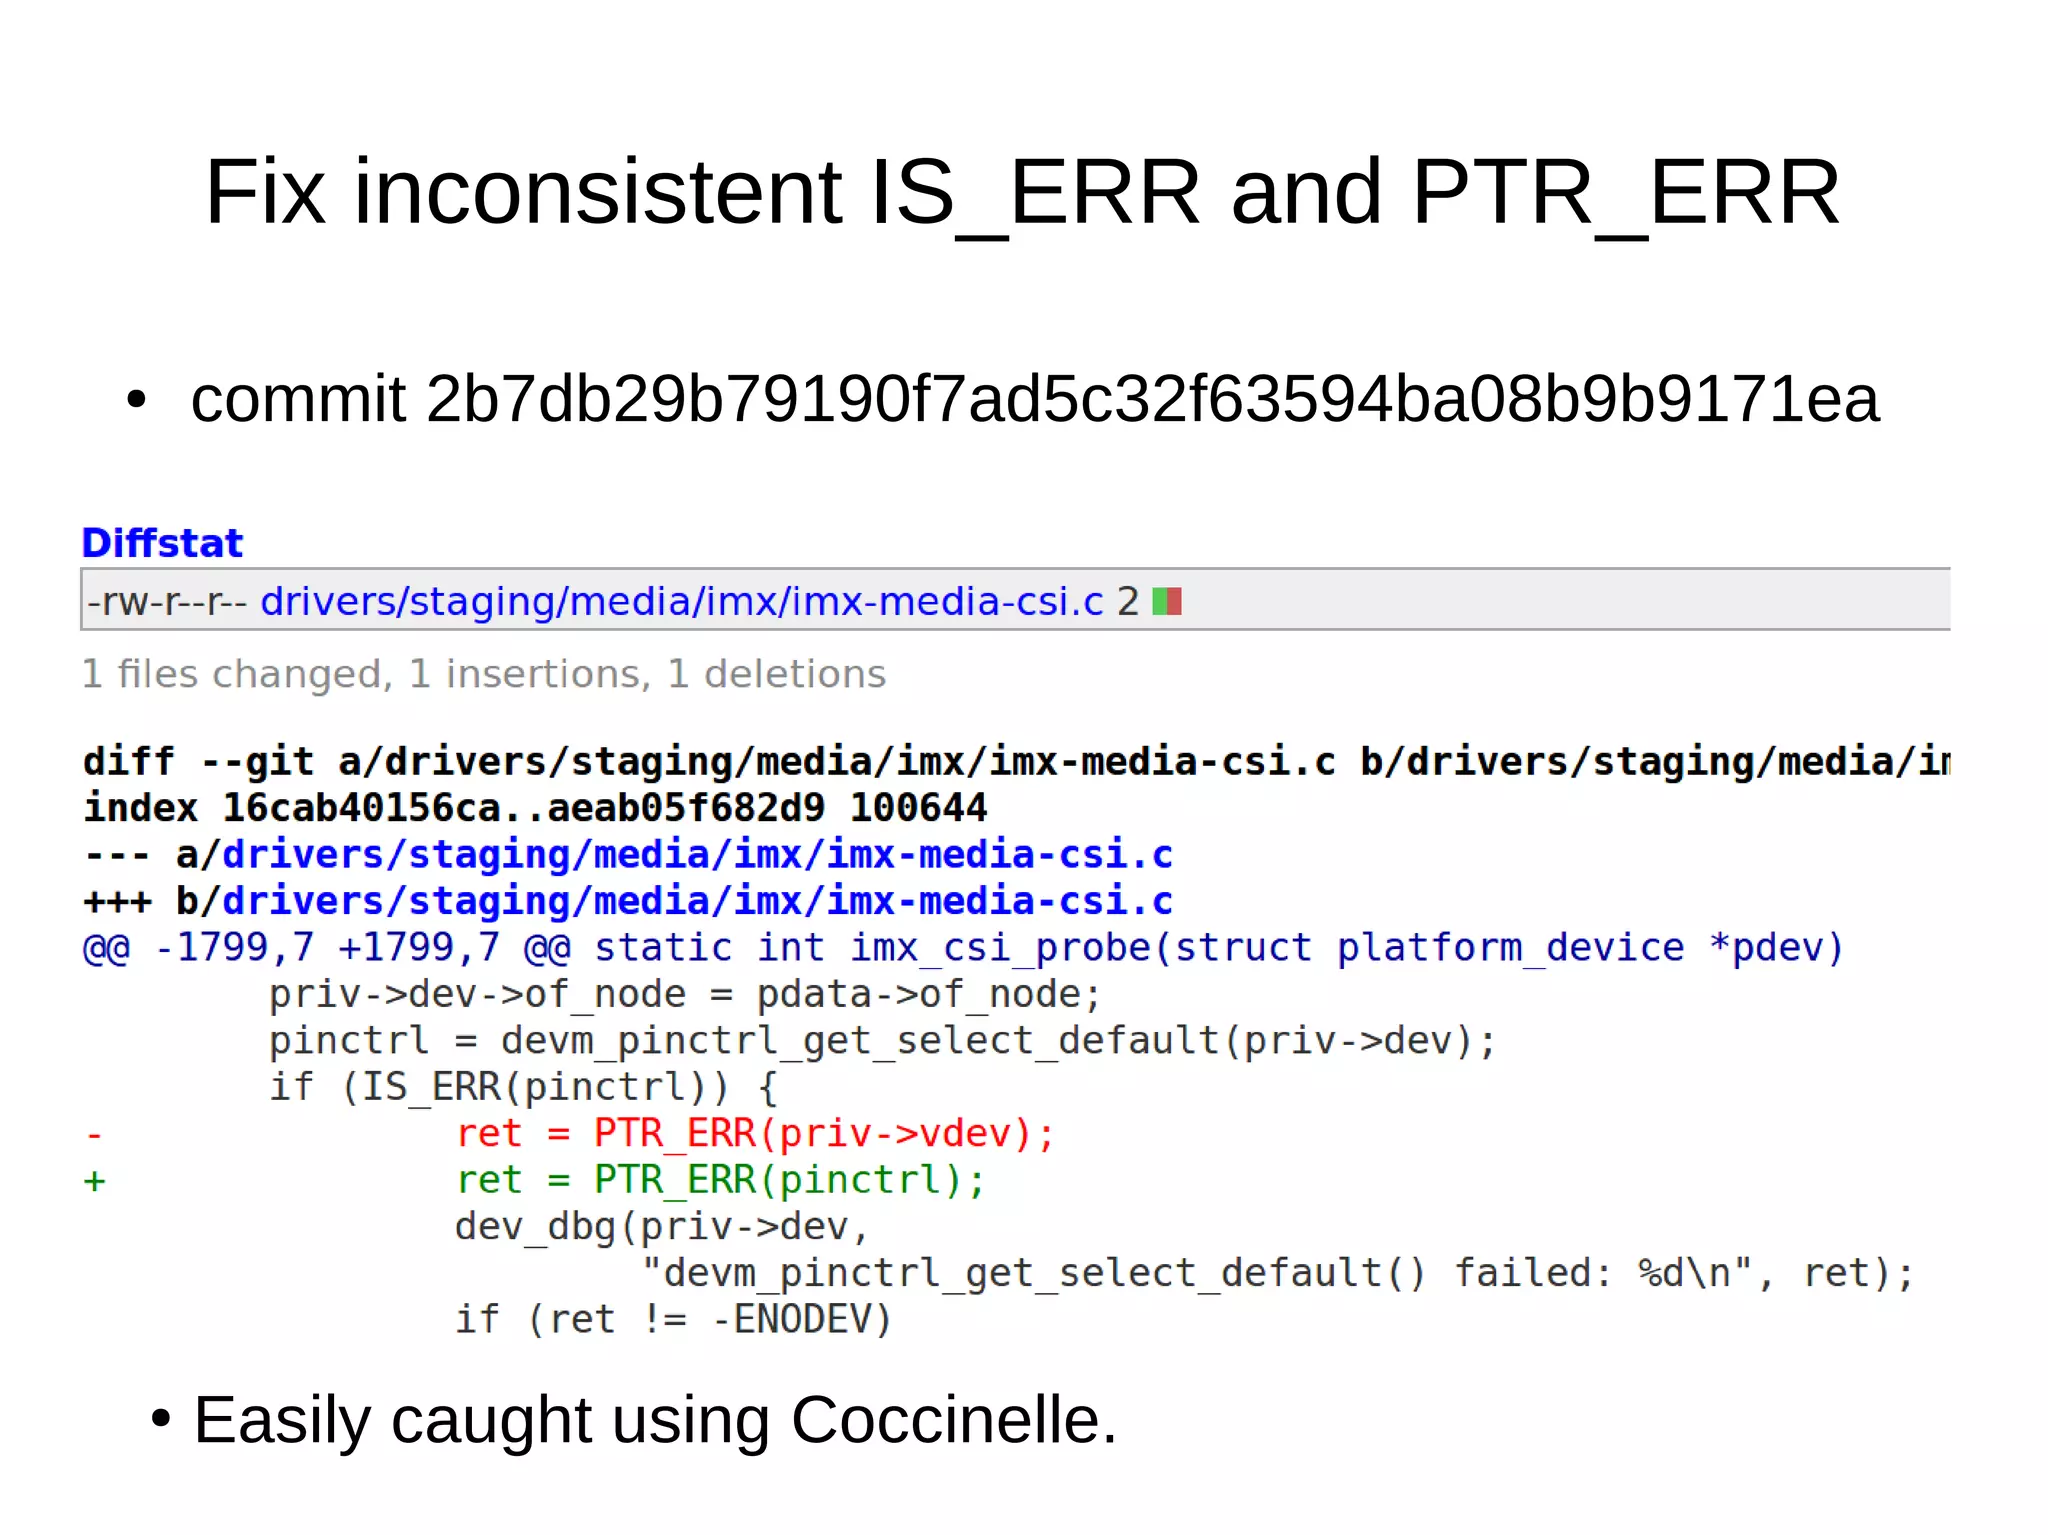
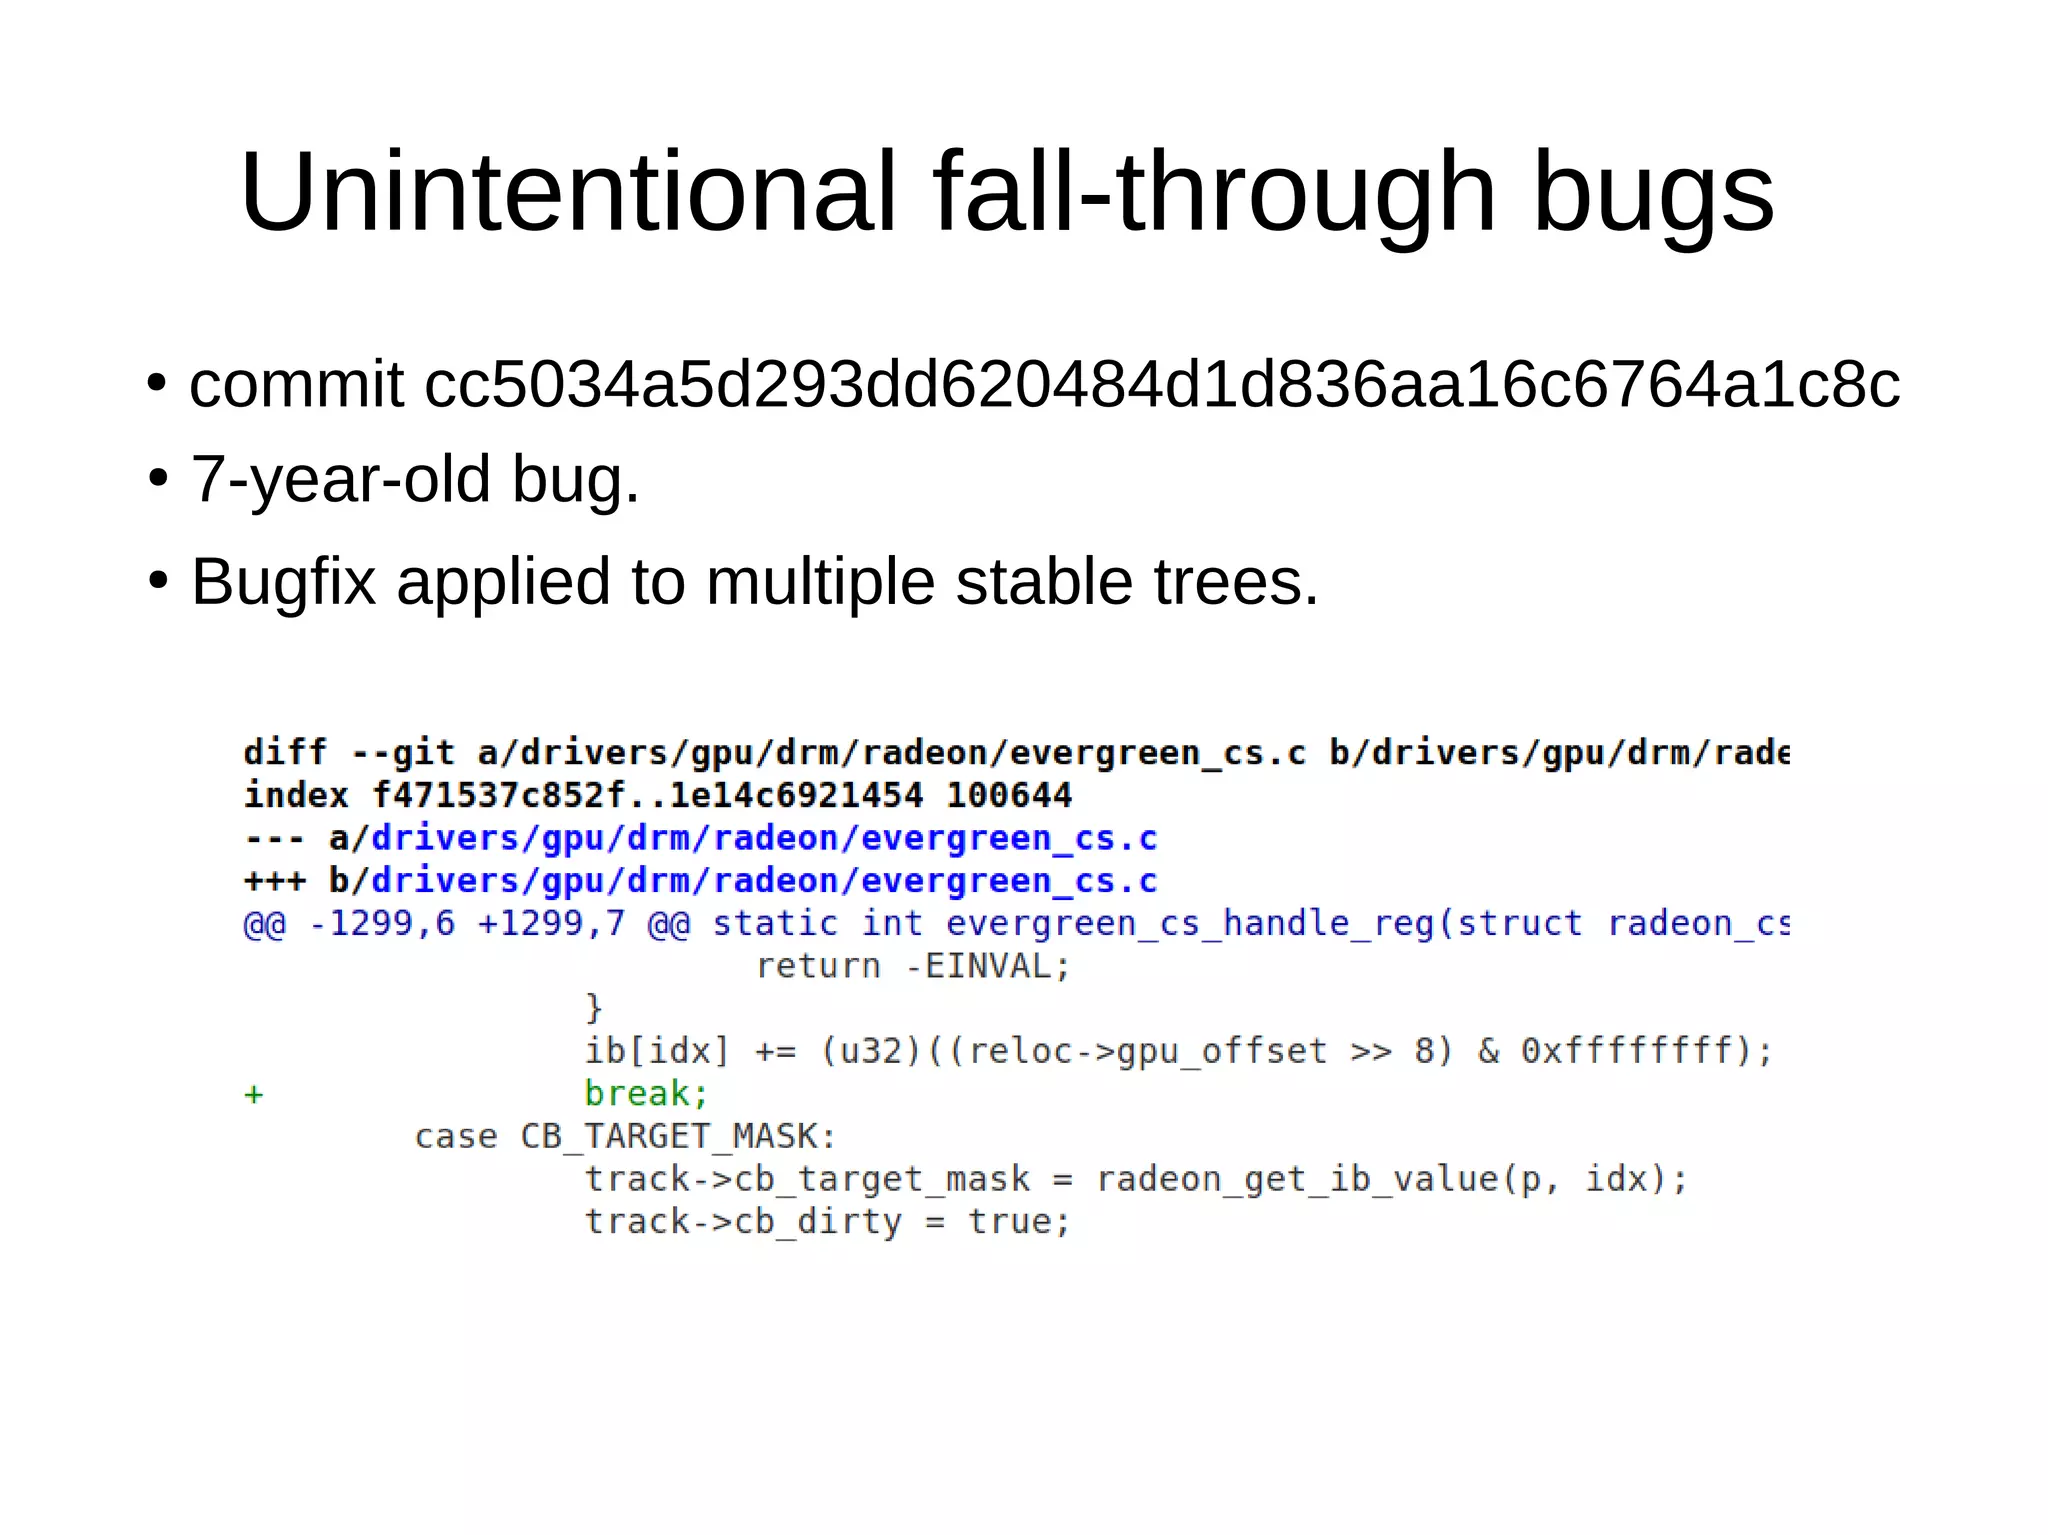
![● commit fe78627d430435d22316fe39f2012ece31bf23c2
Fix type of variable
●
uint8_t → [0-255]
●
while (counter < 1000) - is always true.](https://image.slidesharecdn.com/gustavoarsilvakr2019-191001155204/75/Kernel-Recipes-2019-Hunting-and-fixing-bugs-all-over-the-Linux-kernel-15-2048.jpg)
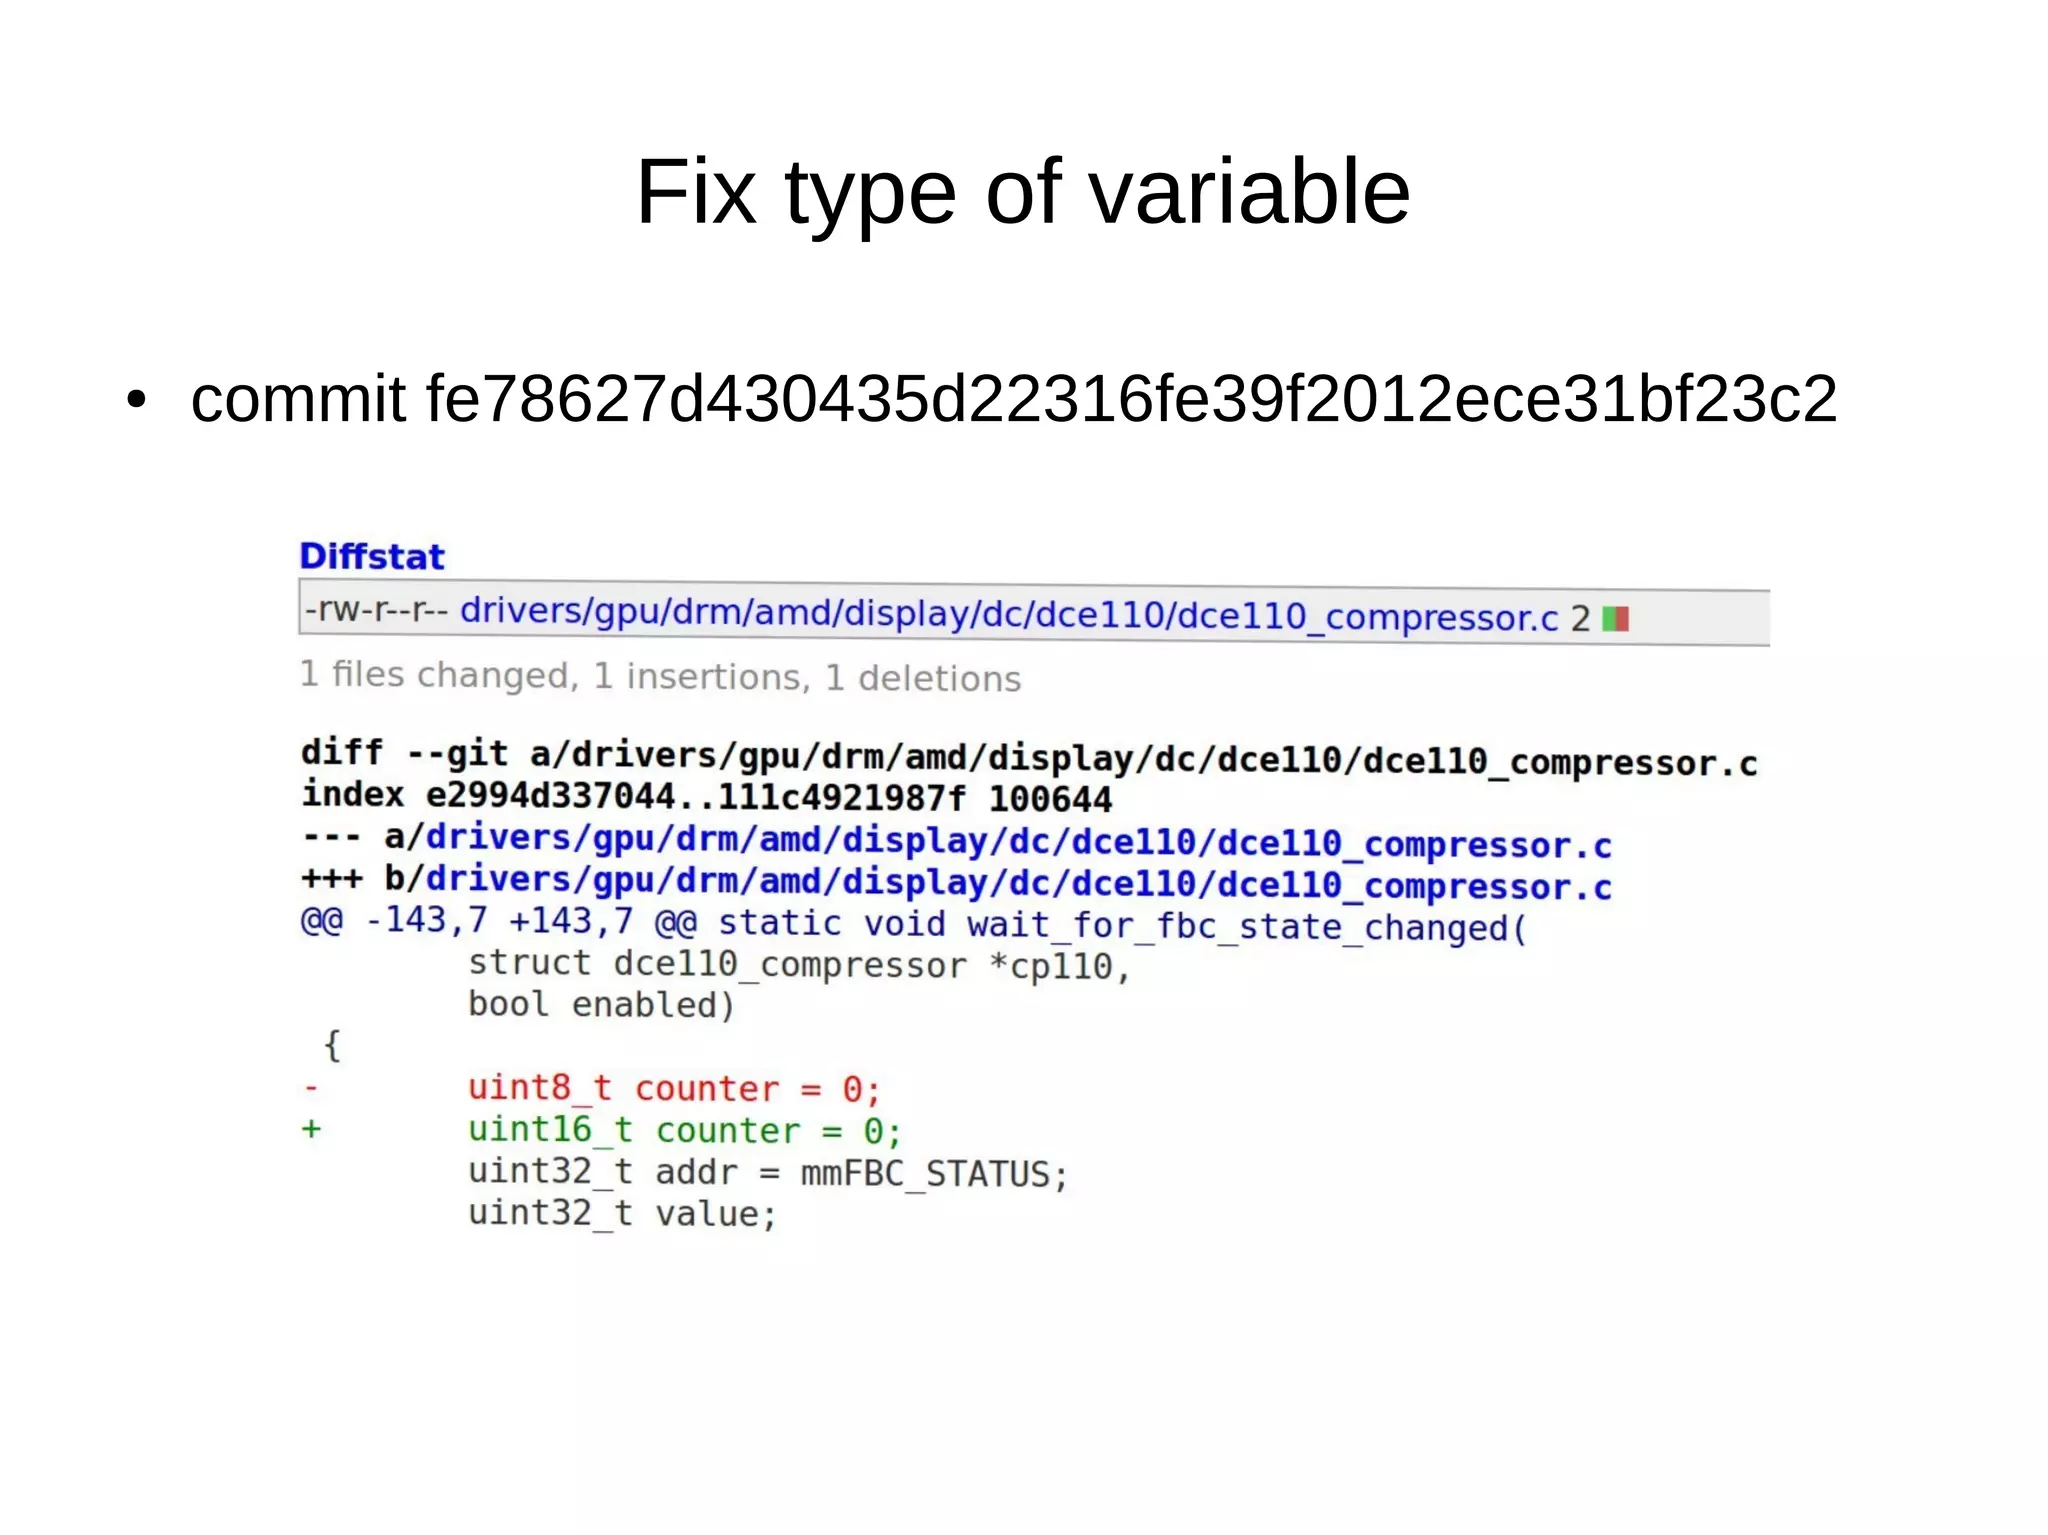
![● commit fe78627d430435d22316fe39f2012ece31bf23c2
Fix type of variable
●
uint8_t → [0-255]
●
while (counter < 1000) - is always true.
●
uint16_t → [0-65,535]](https://image.slidesharecdn.com/gustavoarsilvakr2019-191001155204/75/Kernel-Recipes-2019-Hunting-and-fixing-bugs-all-over-the-Linux-kernel-16-2048.jpg)
![● commit fe78627d430435d22316fe39f2012ece31bf23c2
Fix type of variable
●
uint8_t → [0-255]
●
while (counter < 1000) - is always true.
●
uint16_t → [0-65,535]
●
while (counter < 1000) - can be true or false.](https://image.slidesharecdn.com/gustavoarsilvakr2019-191001155204/75/Kernel-Recipes-2019-Hunting-and-fixing-bugs-all-over-the-Linux-kernel-17-2048.jpg)


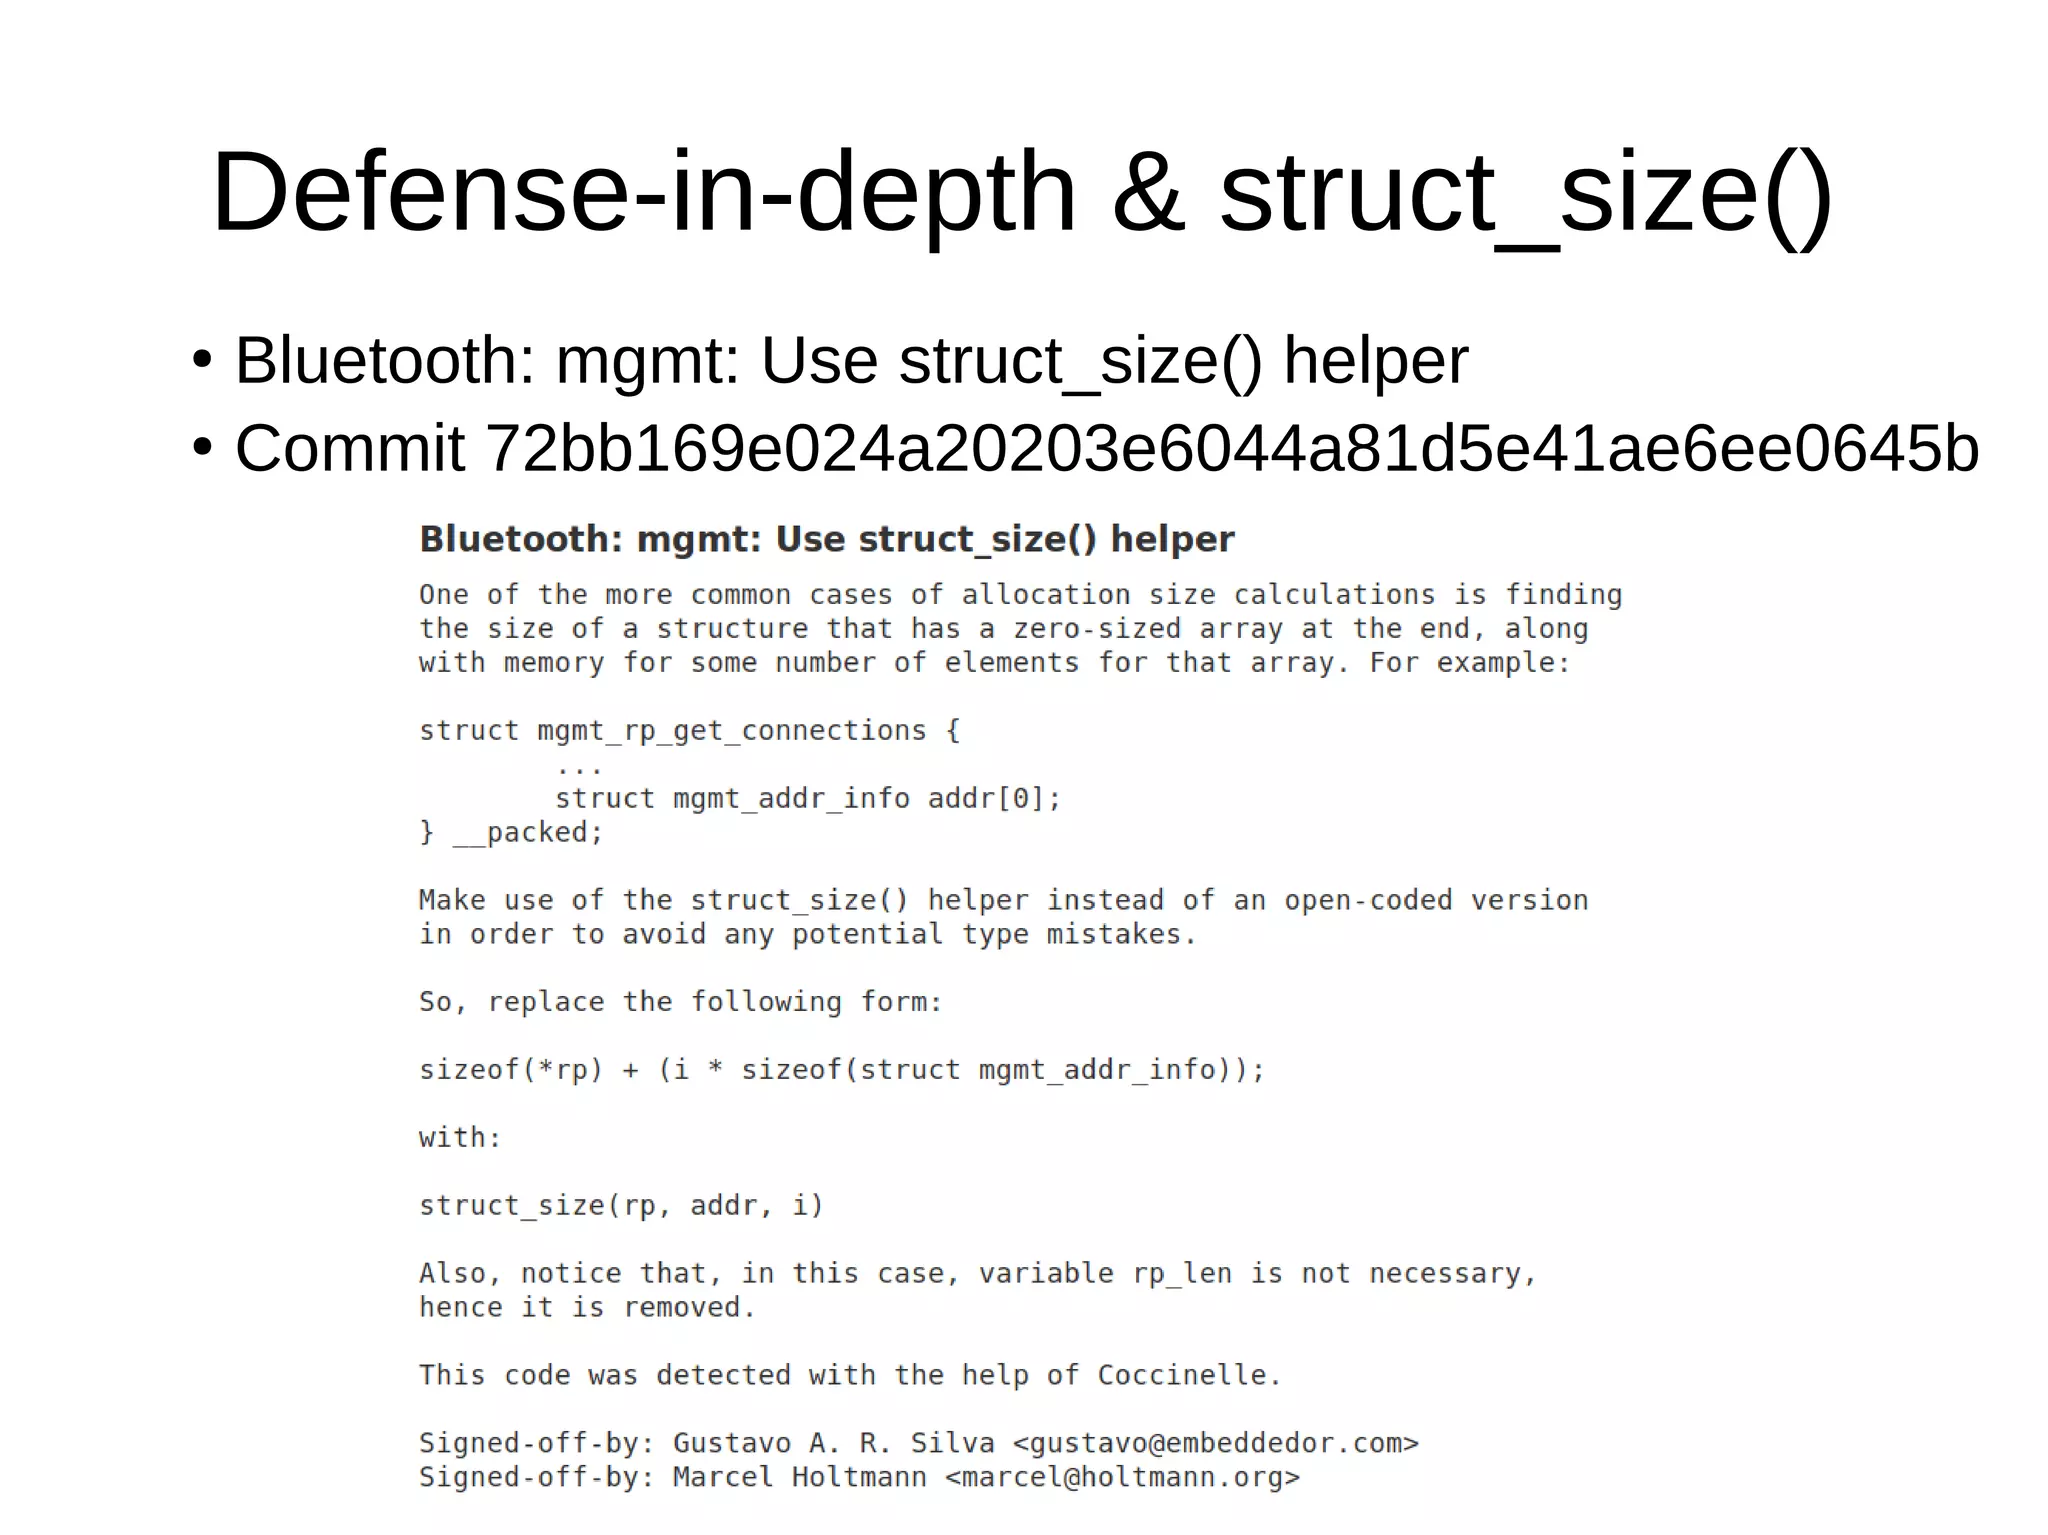
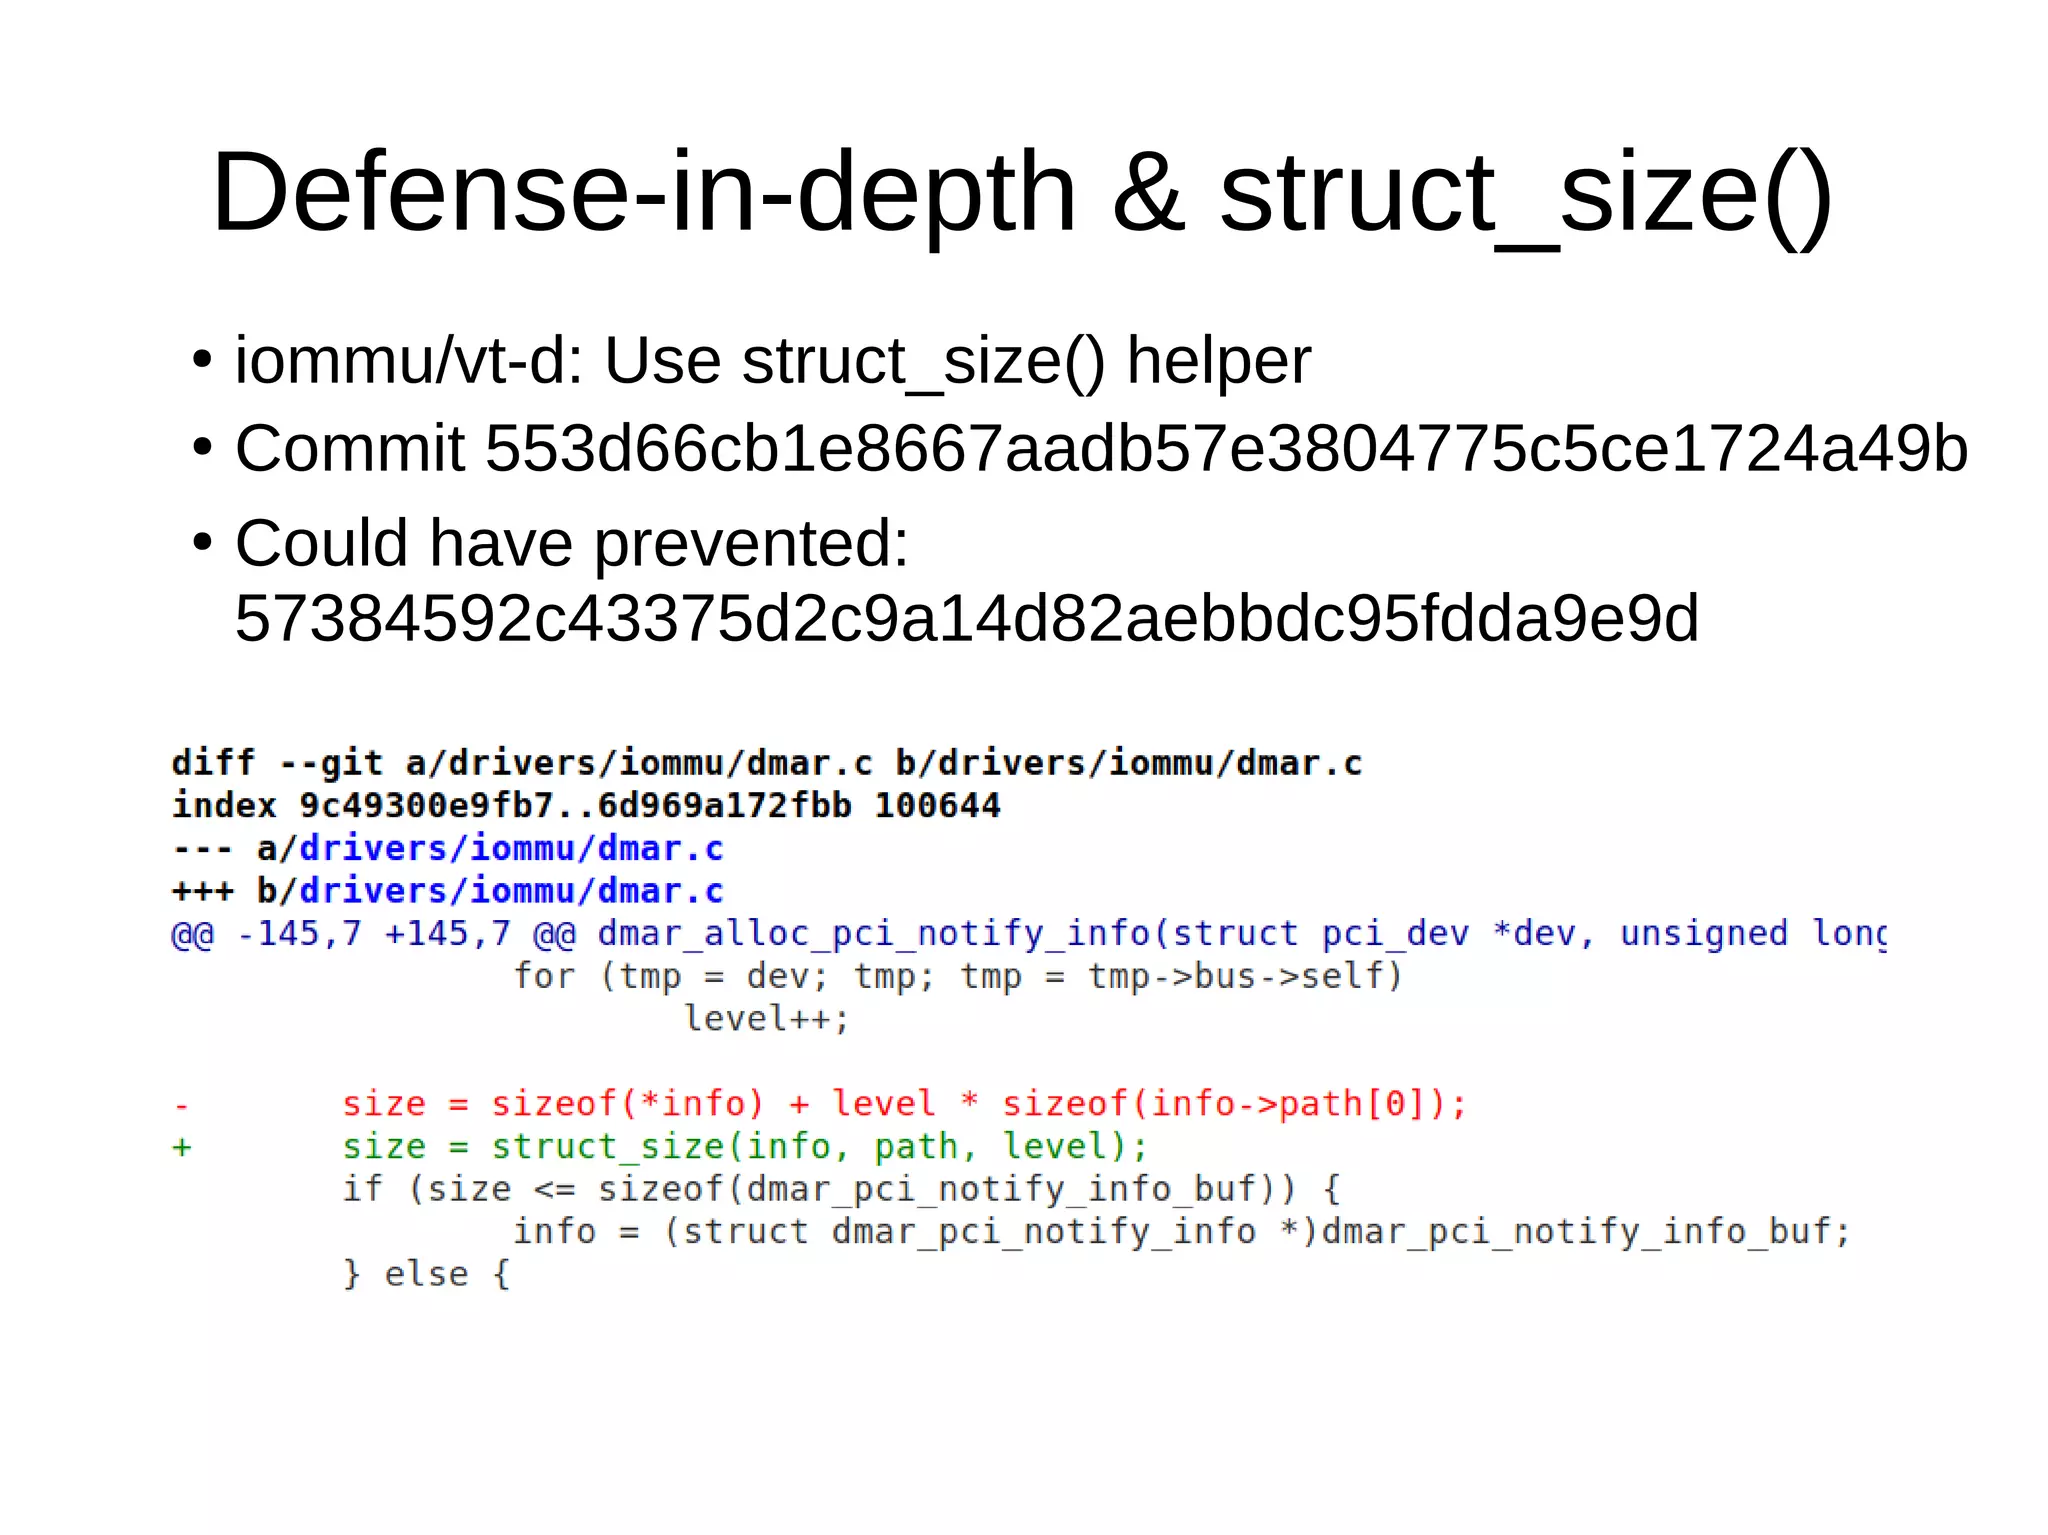
![Defense-in-depth & struct_size()
●
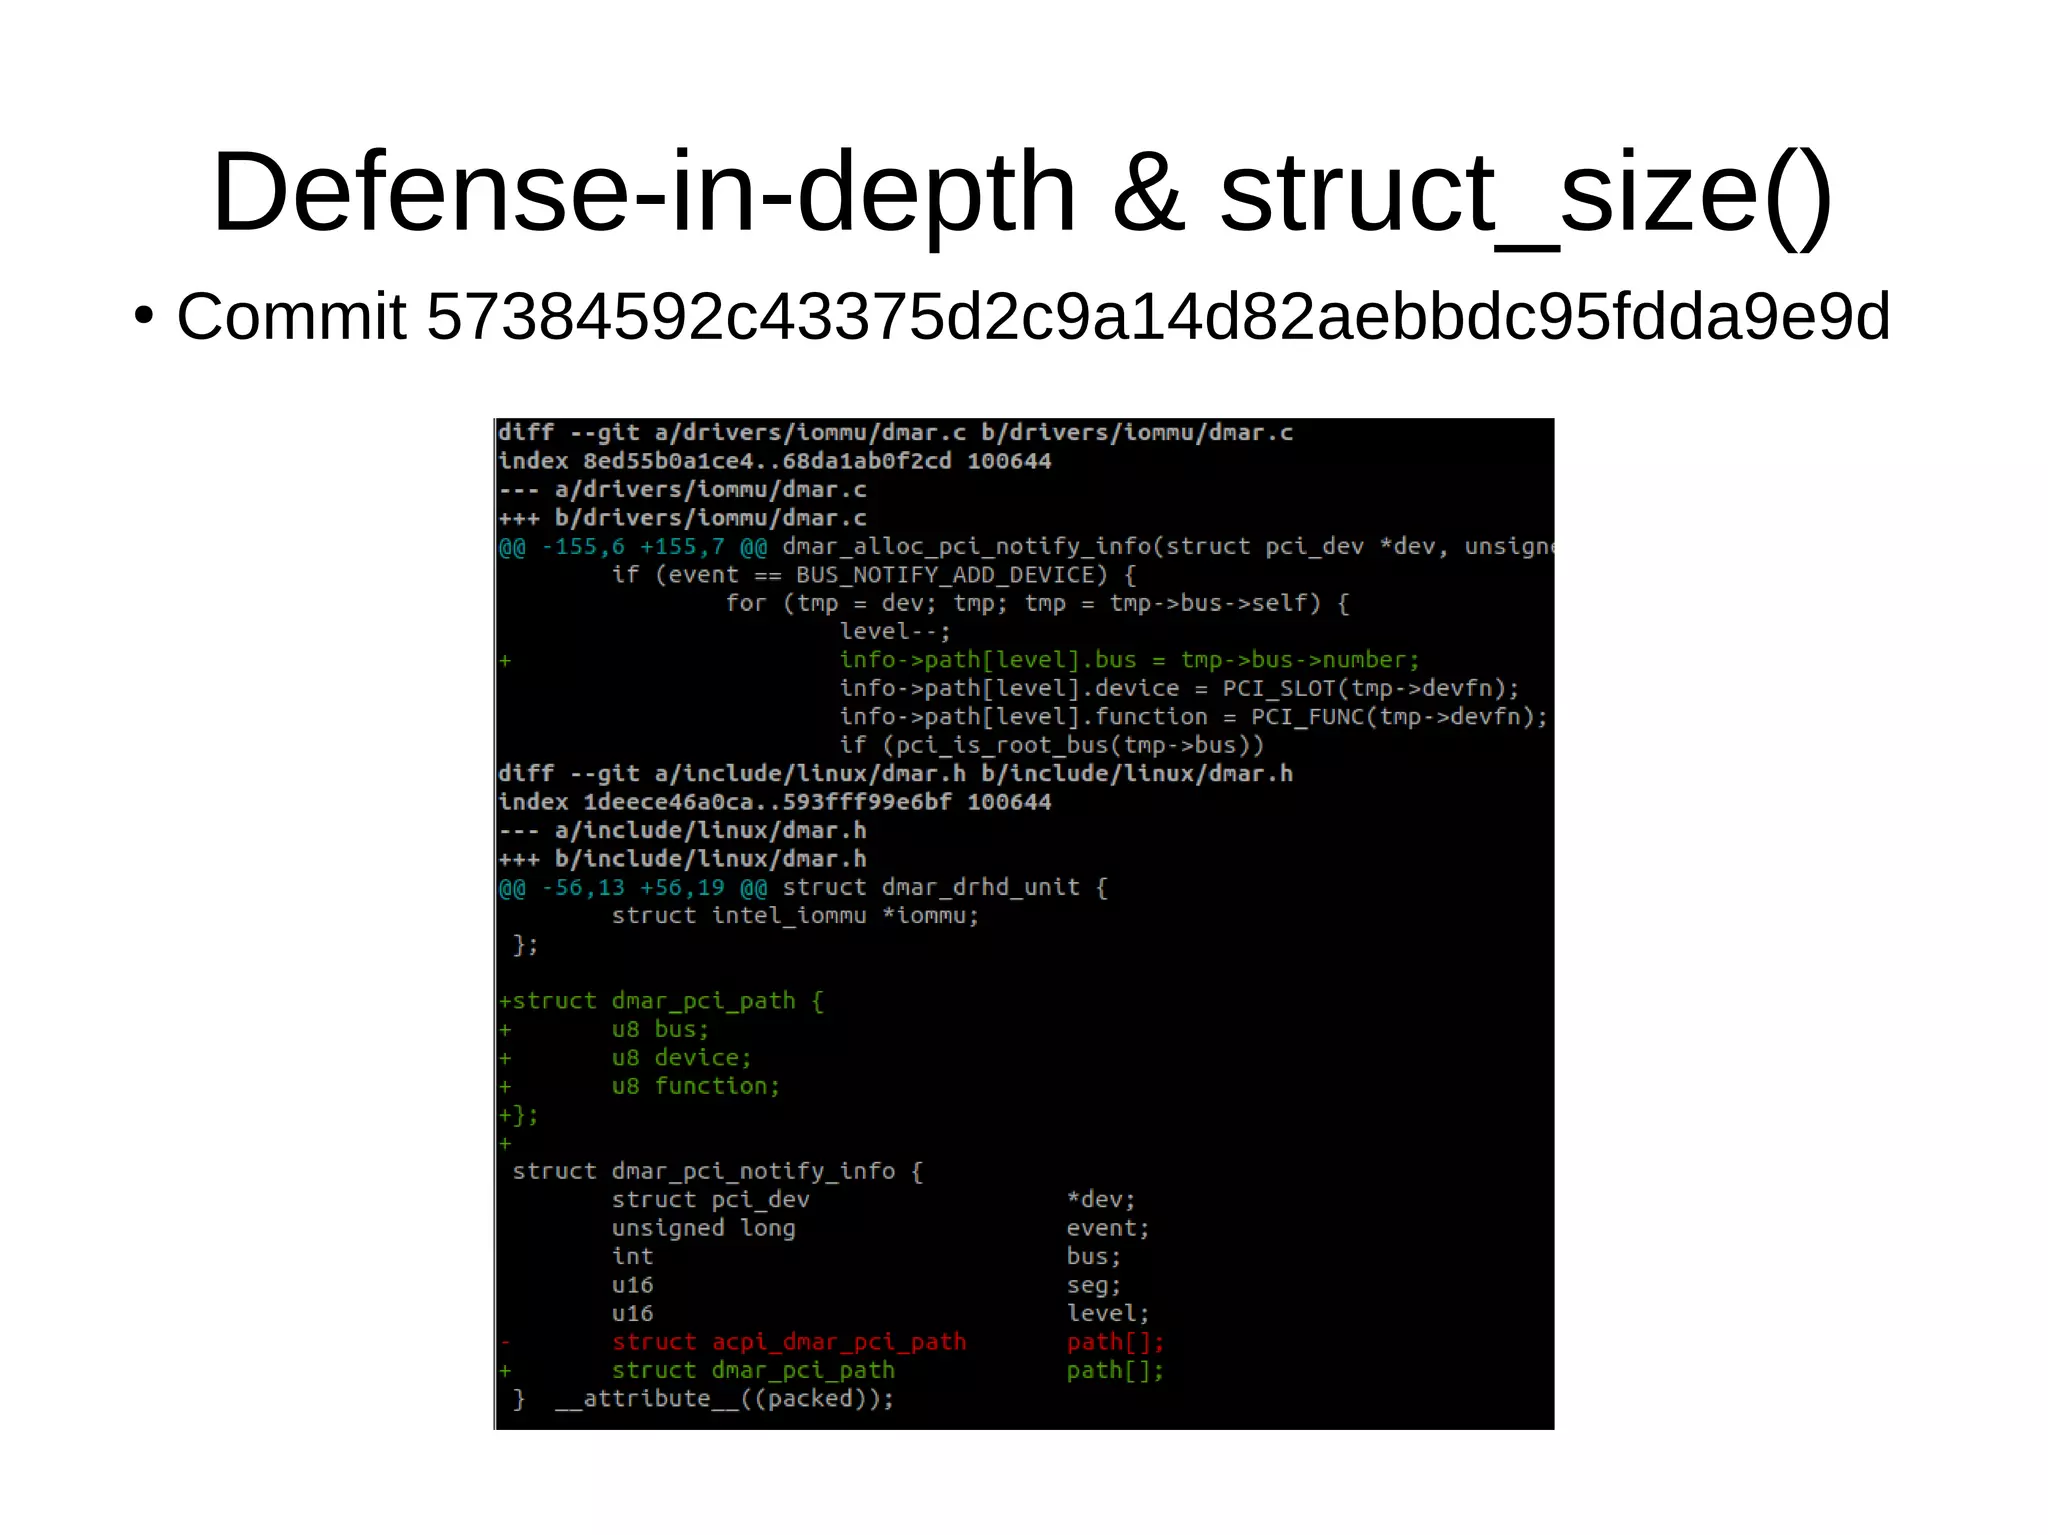
Commit 57384592c43375d2c9a14d82aebbdc95fdda9e9d
●
New structure dmar_pci_path
contains an extra field: u8 bus;
●
Overflow: info→path[level].bus = tmp→bus→number;](https://image.slidesharecdn.com/gustavoarsilvakr2019-191001155204/75/Kernel-Recipes-2019-Hunting-and-fixing-bugs-all-over-the-Linux-kernel-50-2048.jpg)
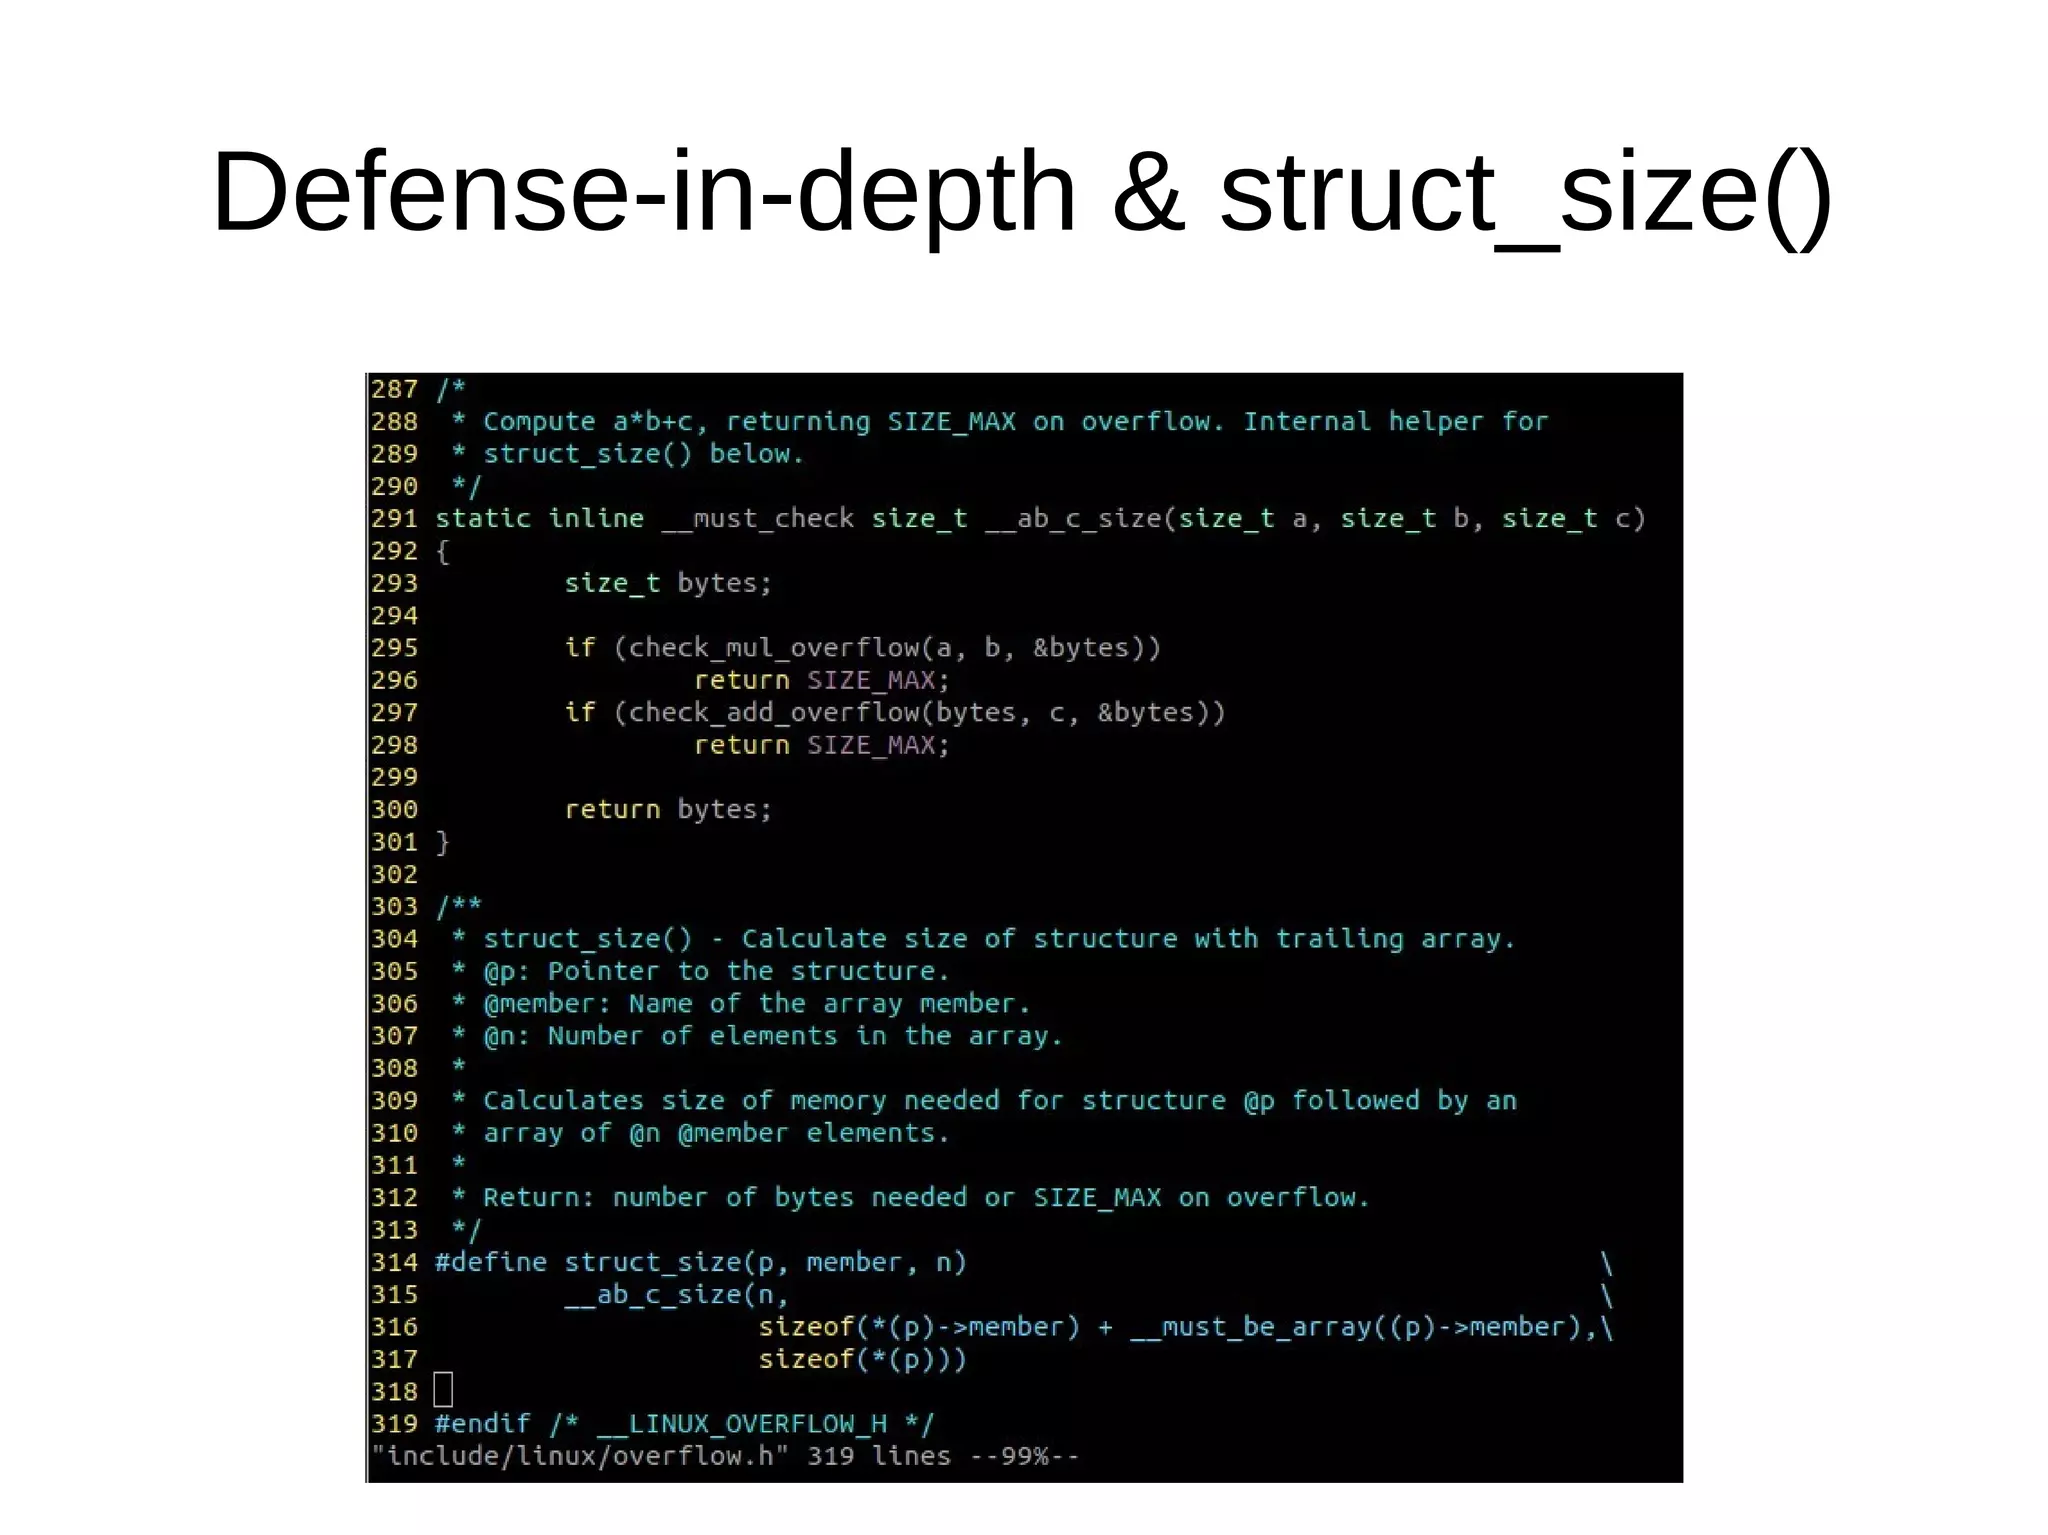
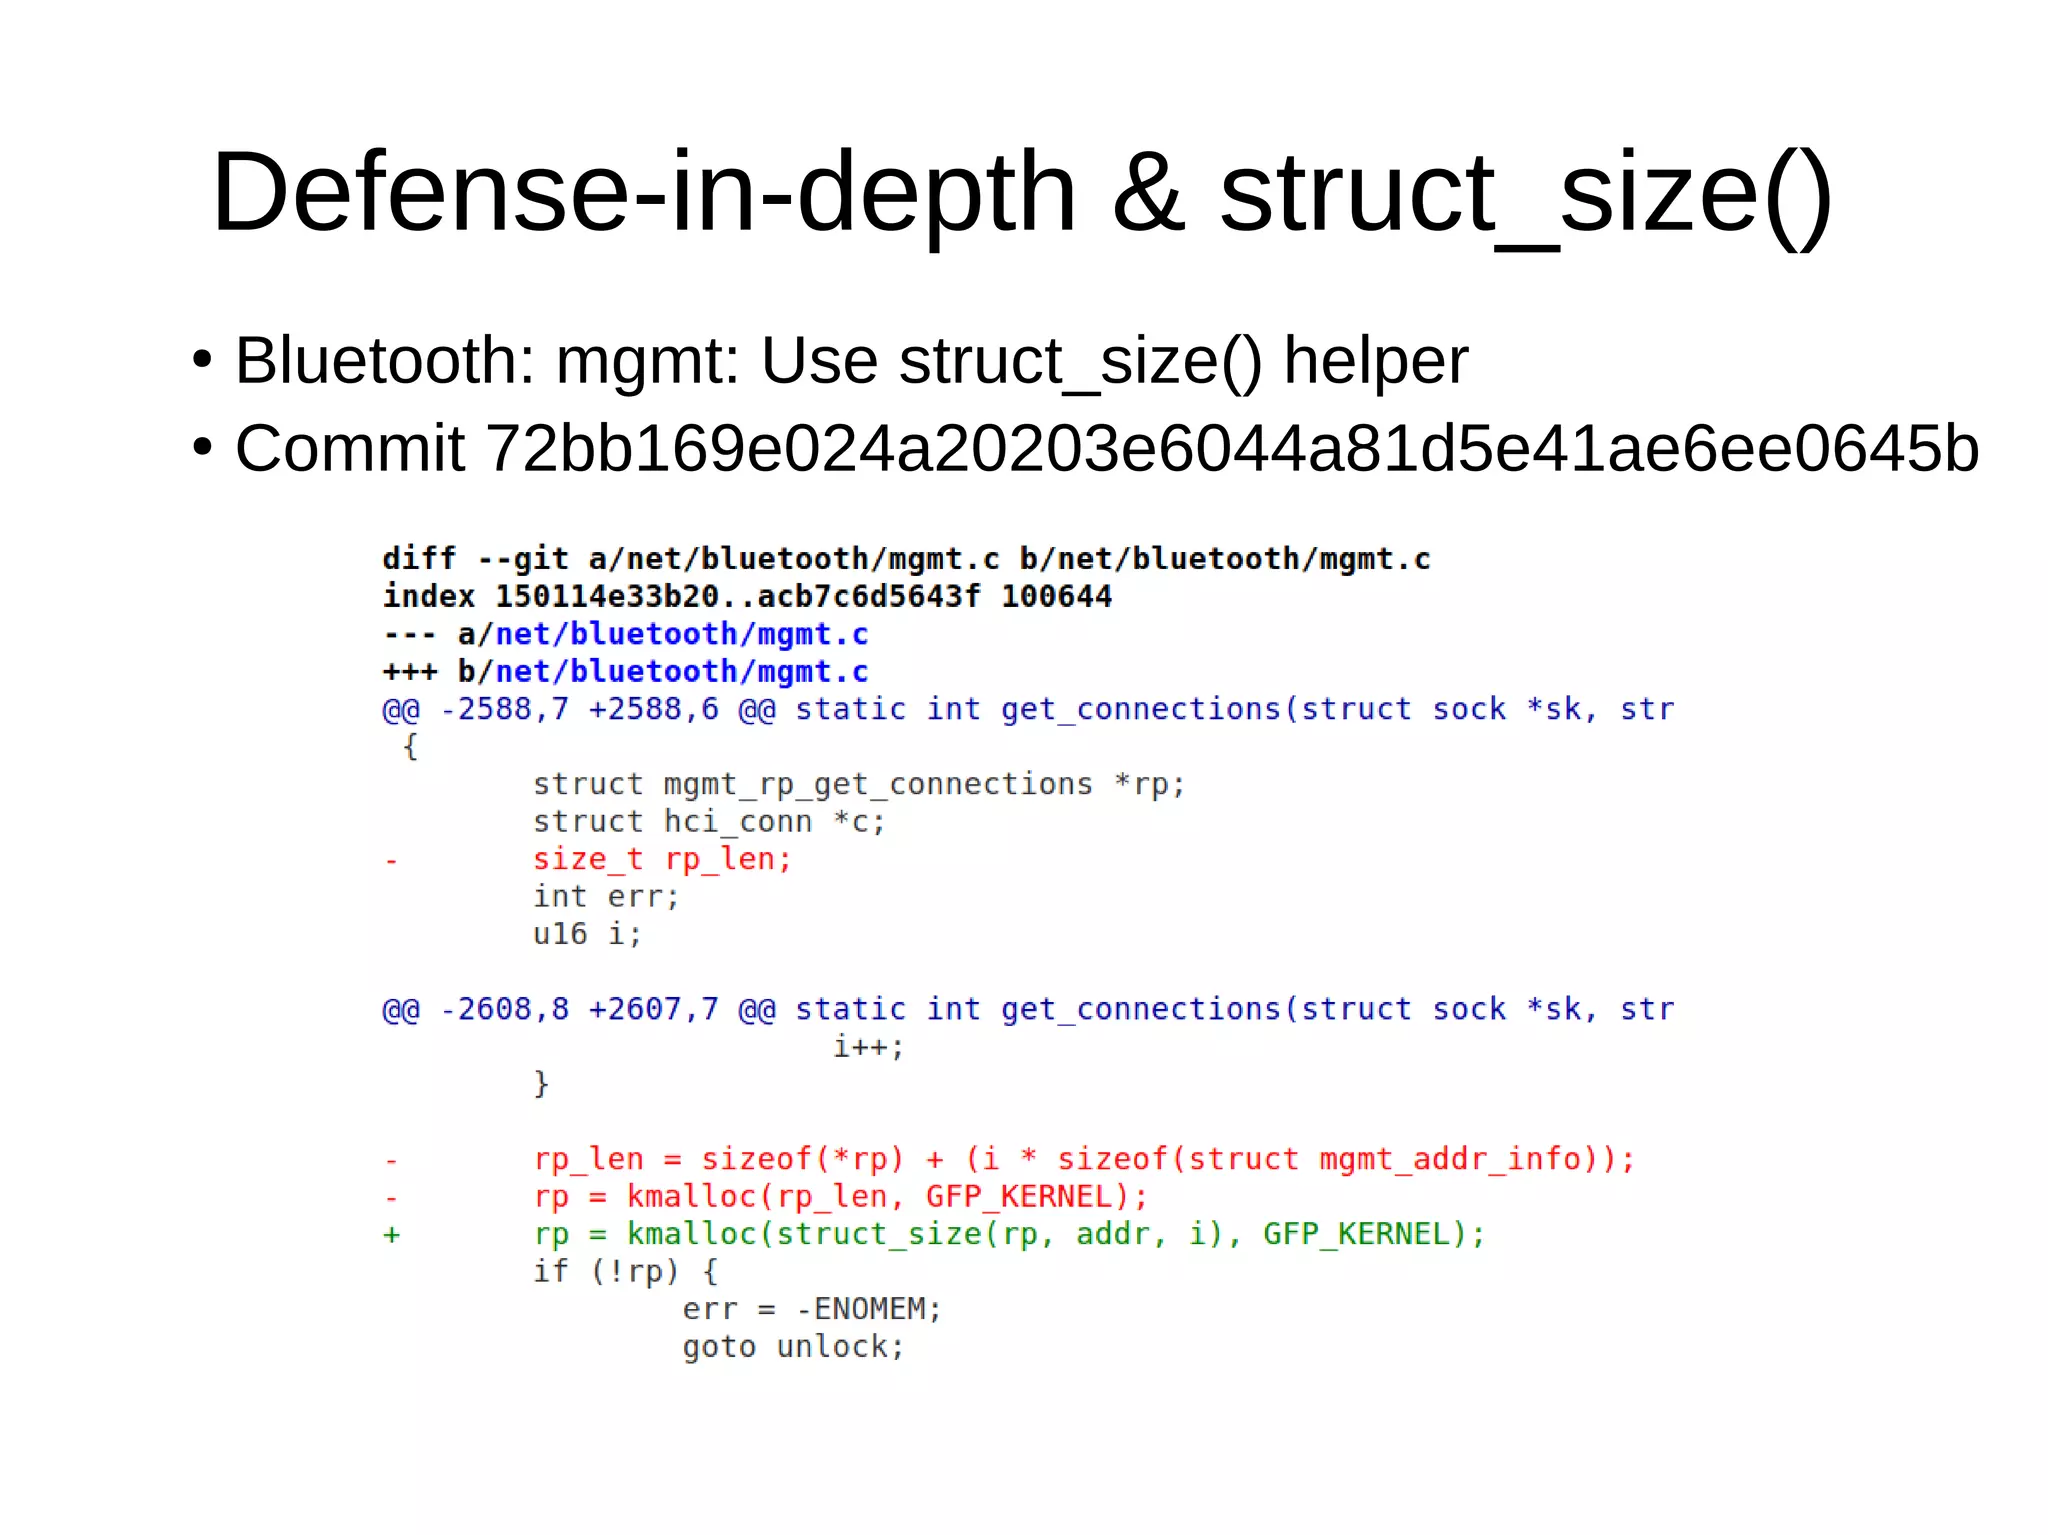
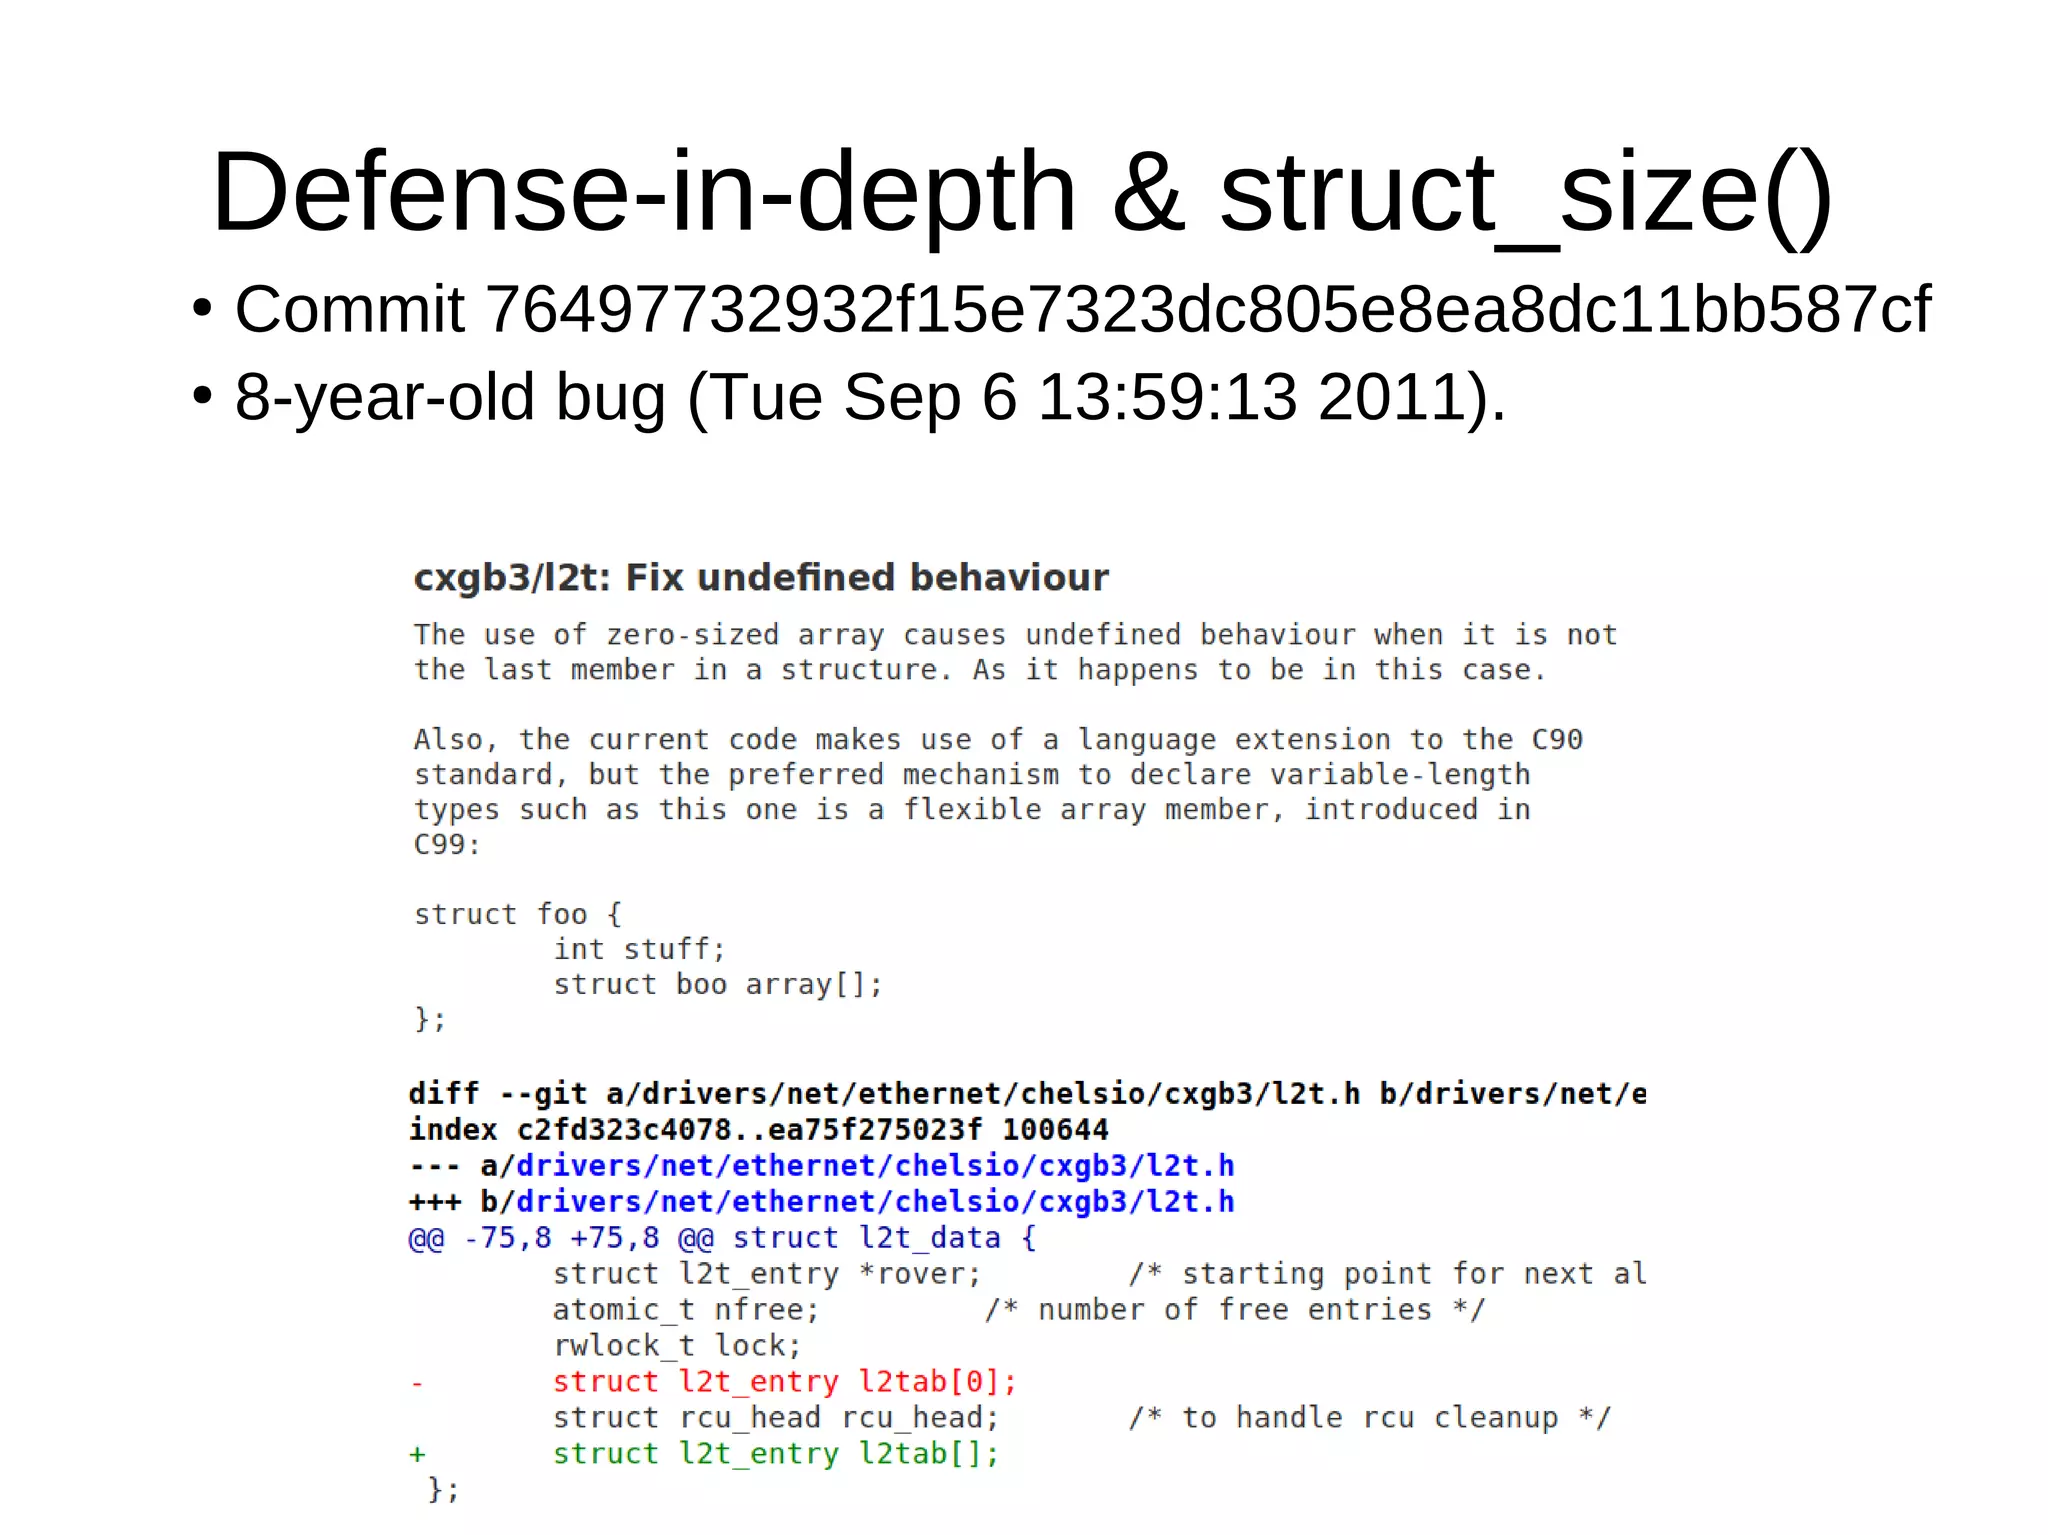
![Defense-in-depth & struct_size()
●
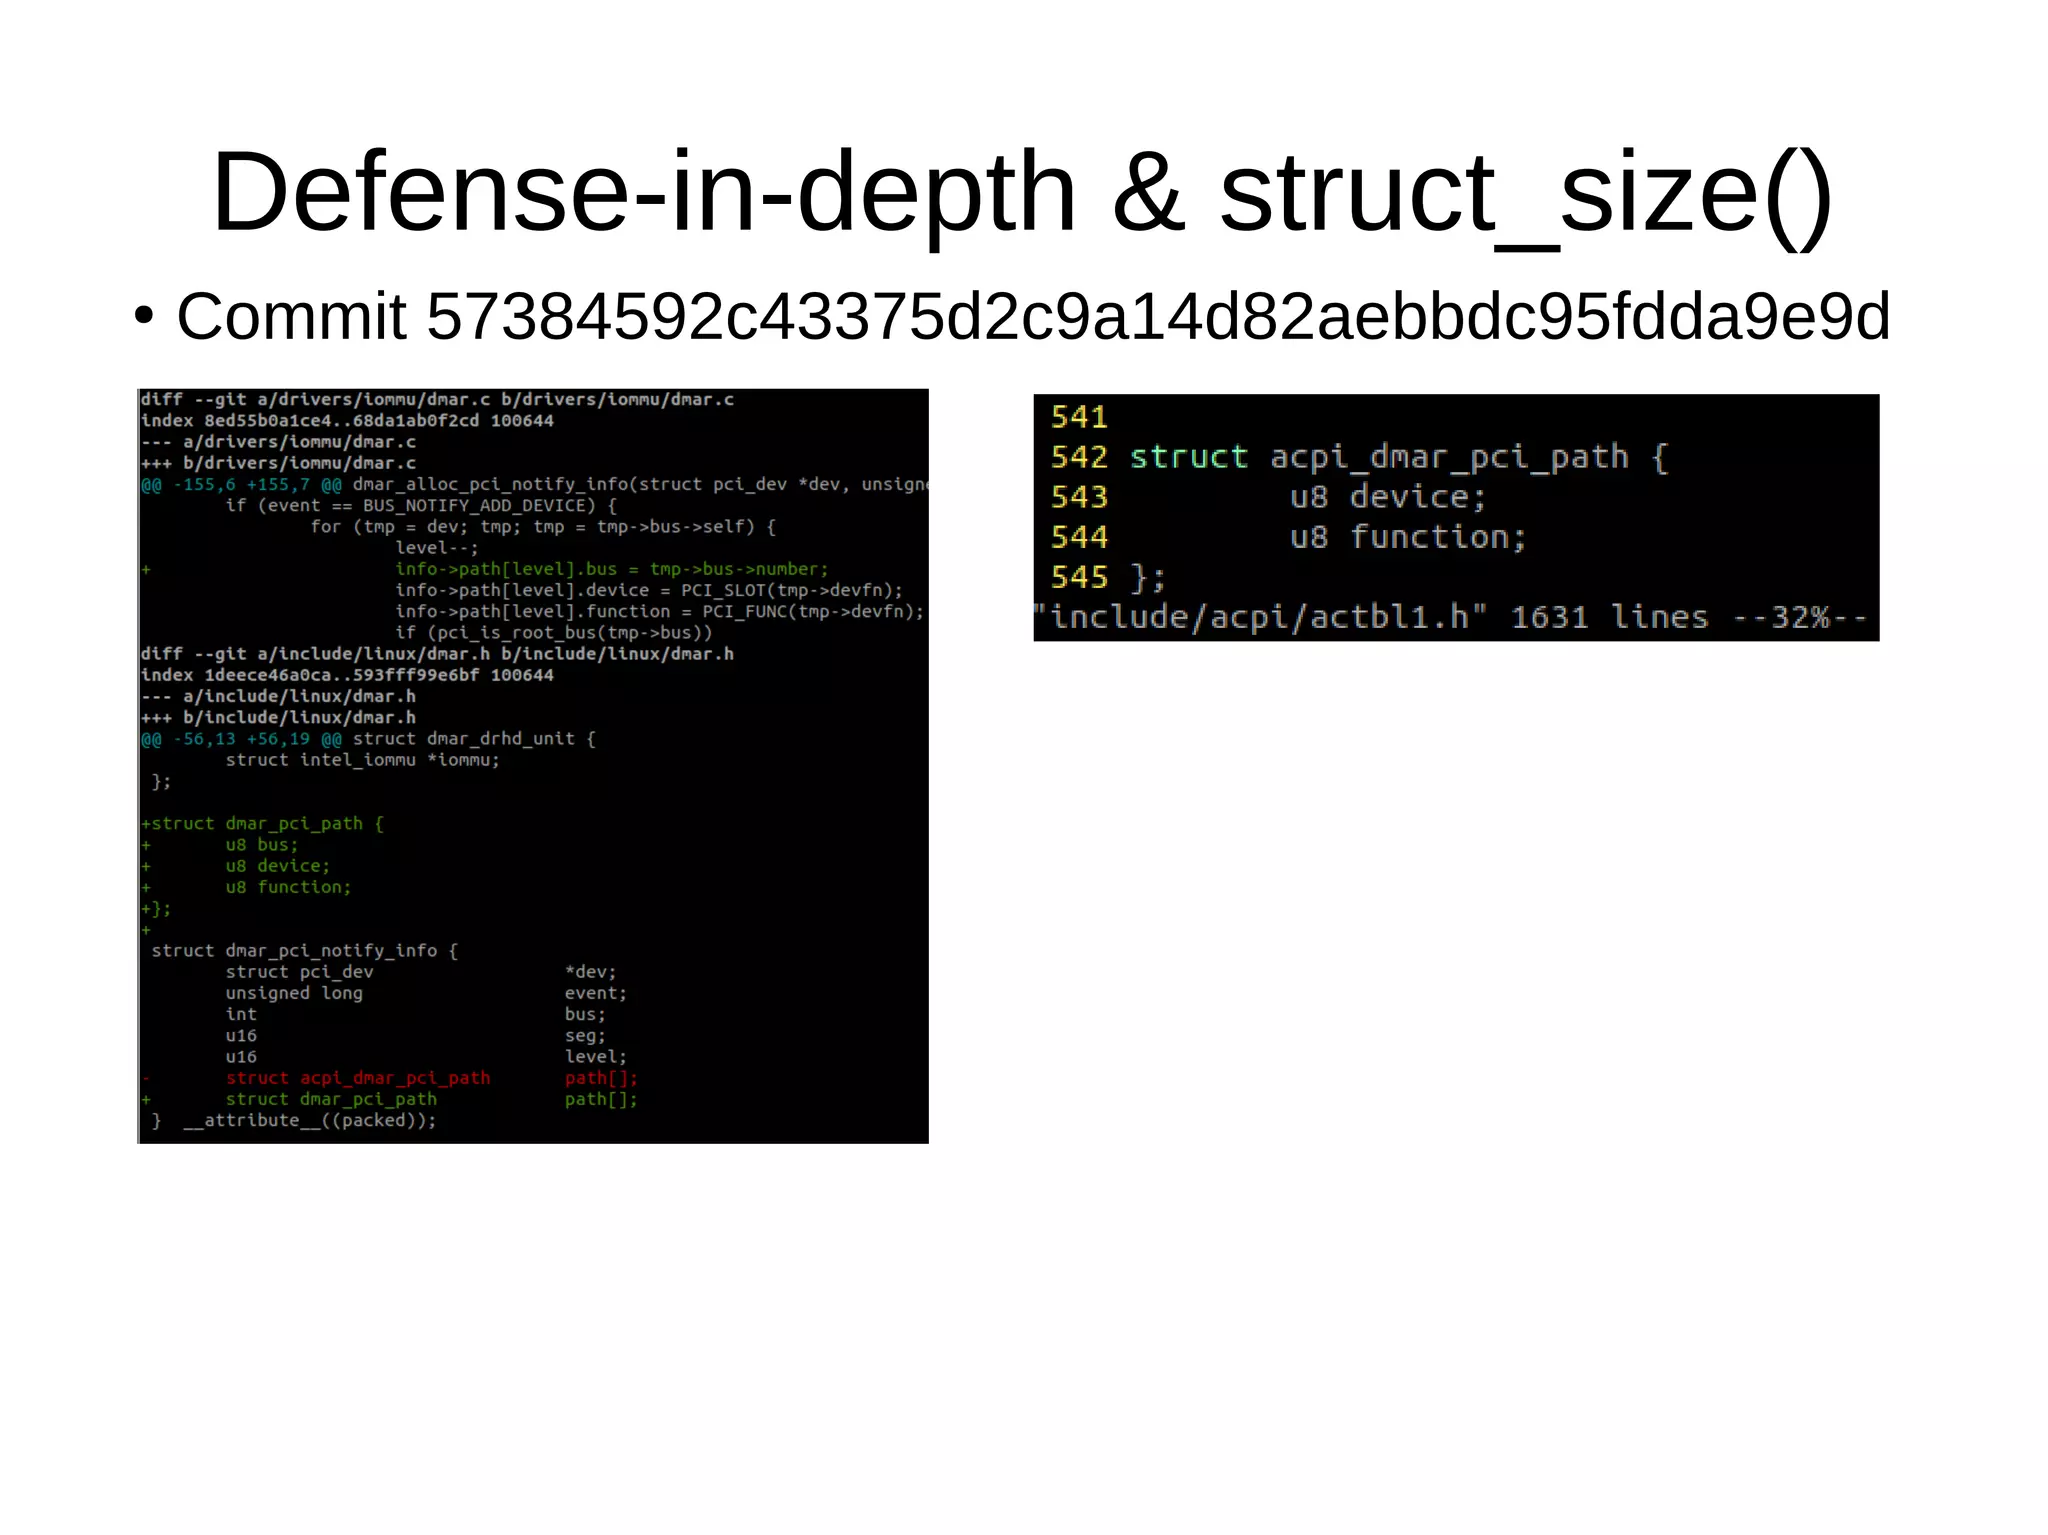
Commit 57384592c43375d2c9a14d82aebbdc95fdda9e9d
●
New structure dmar_pci_path
contains an extra field: u8 bus;
●
Overflow: info→path[level].bus = tmp→bus→number;](https://image.slidesharecdn.com/gustavoarsilvakr2019-191001155204/75/Kernel-Recipes-2019-Hunting-and-fixing-bugs-all-over-the-Linux-kernel-51-2048.jpg)
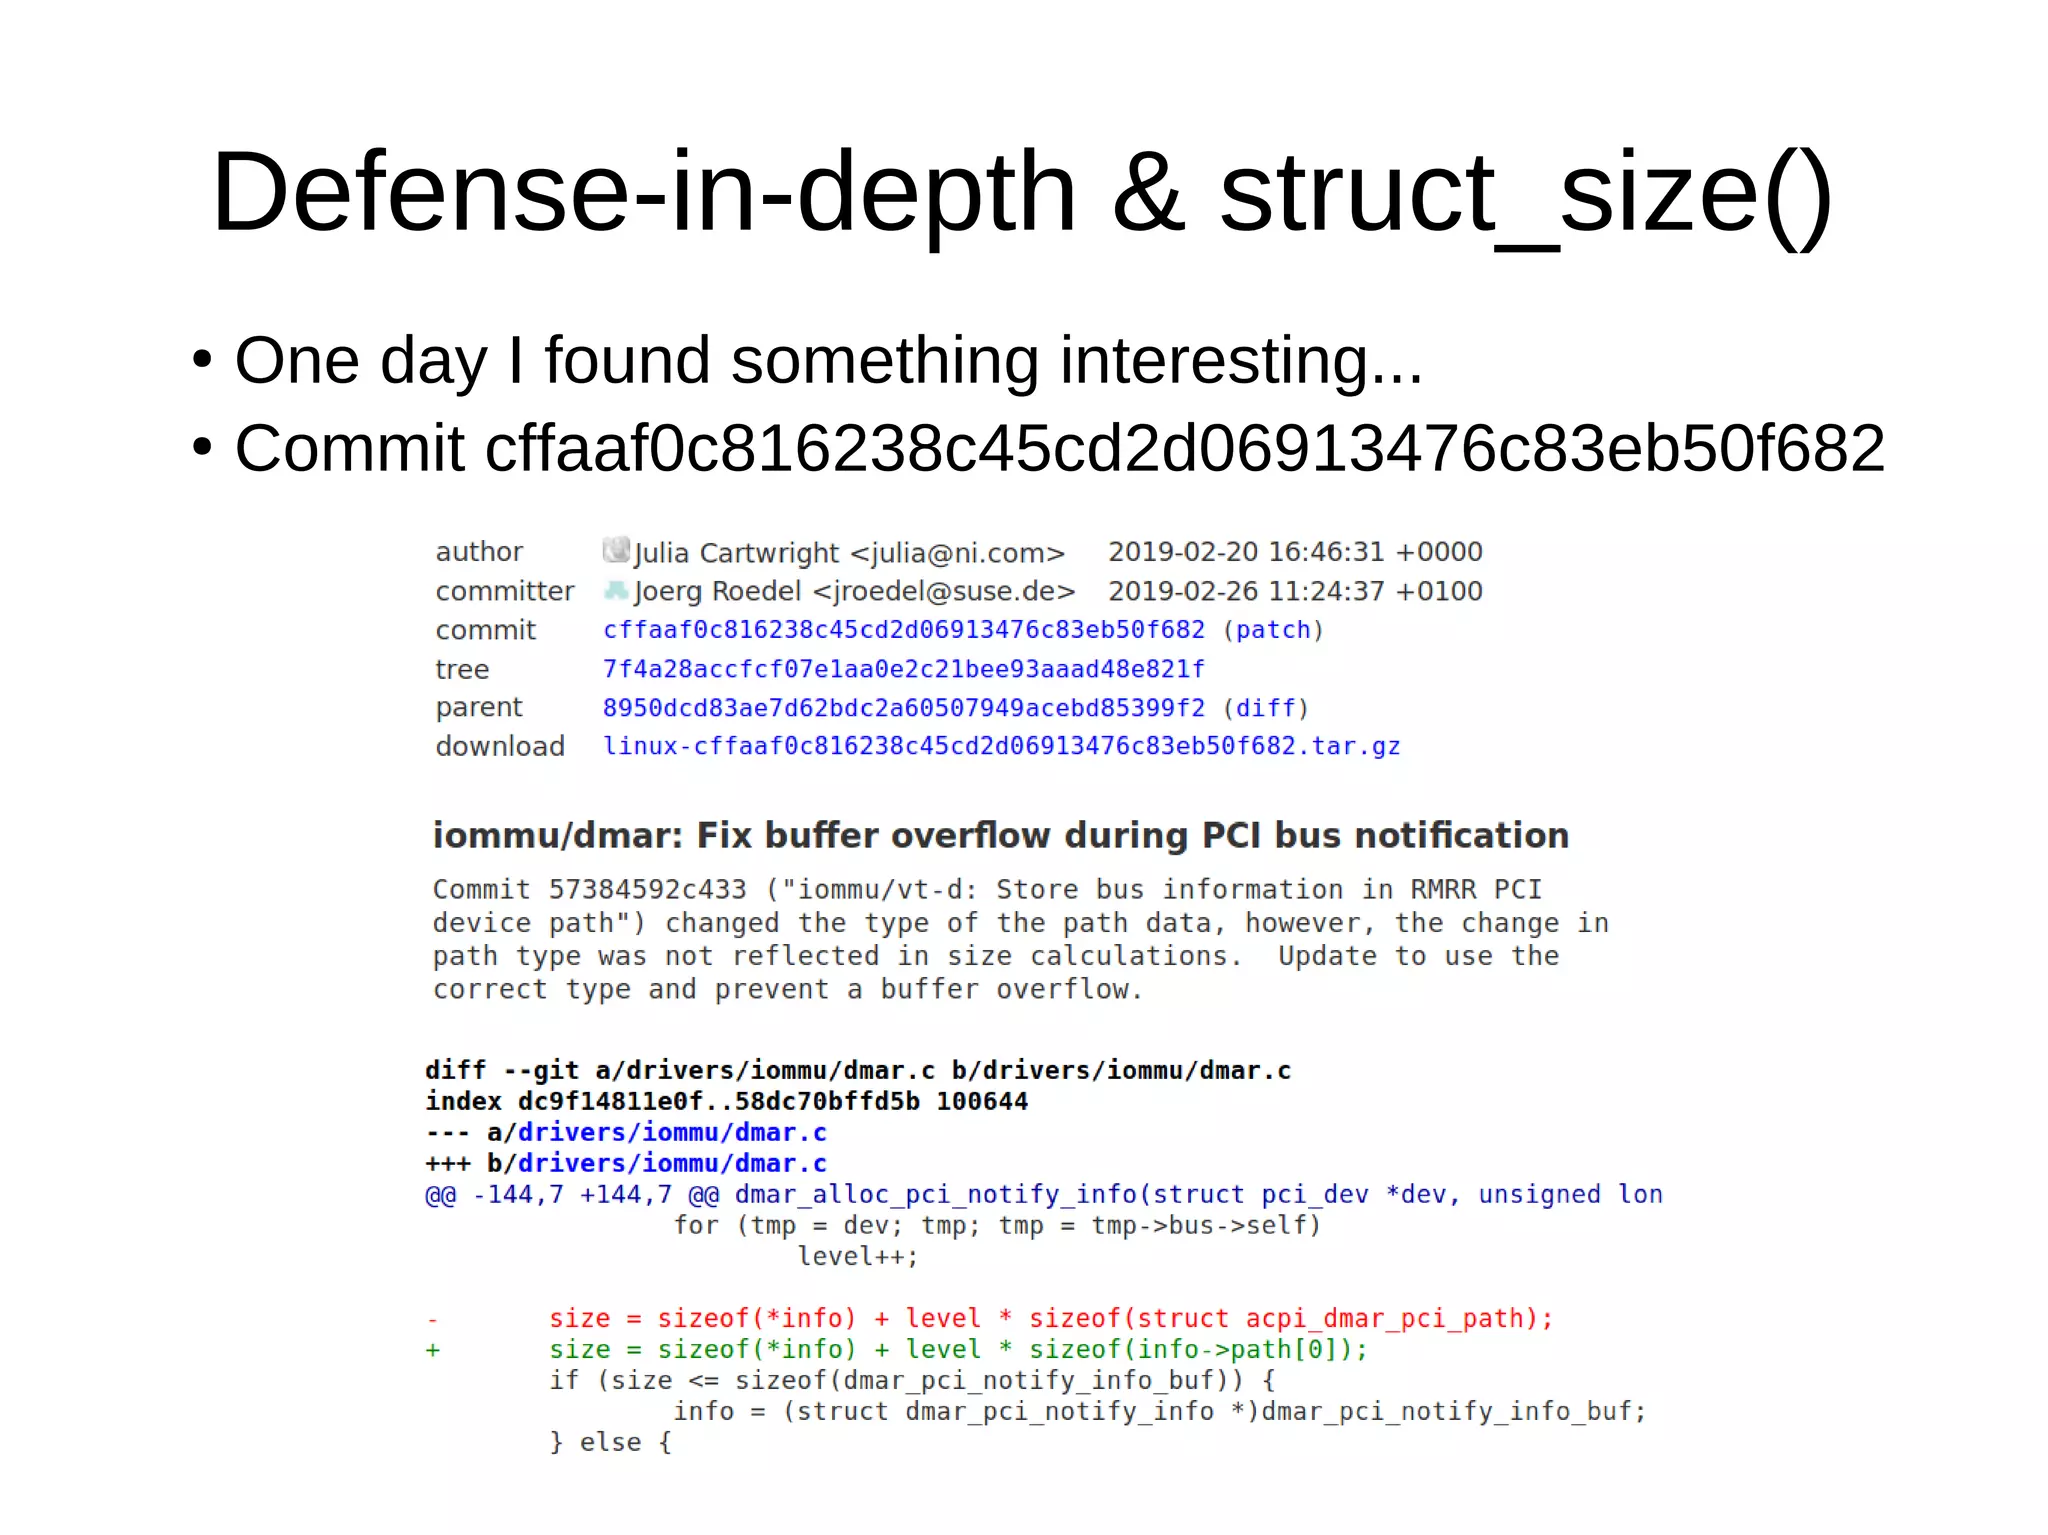
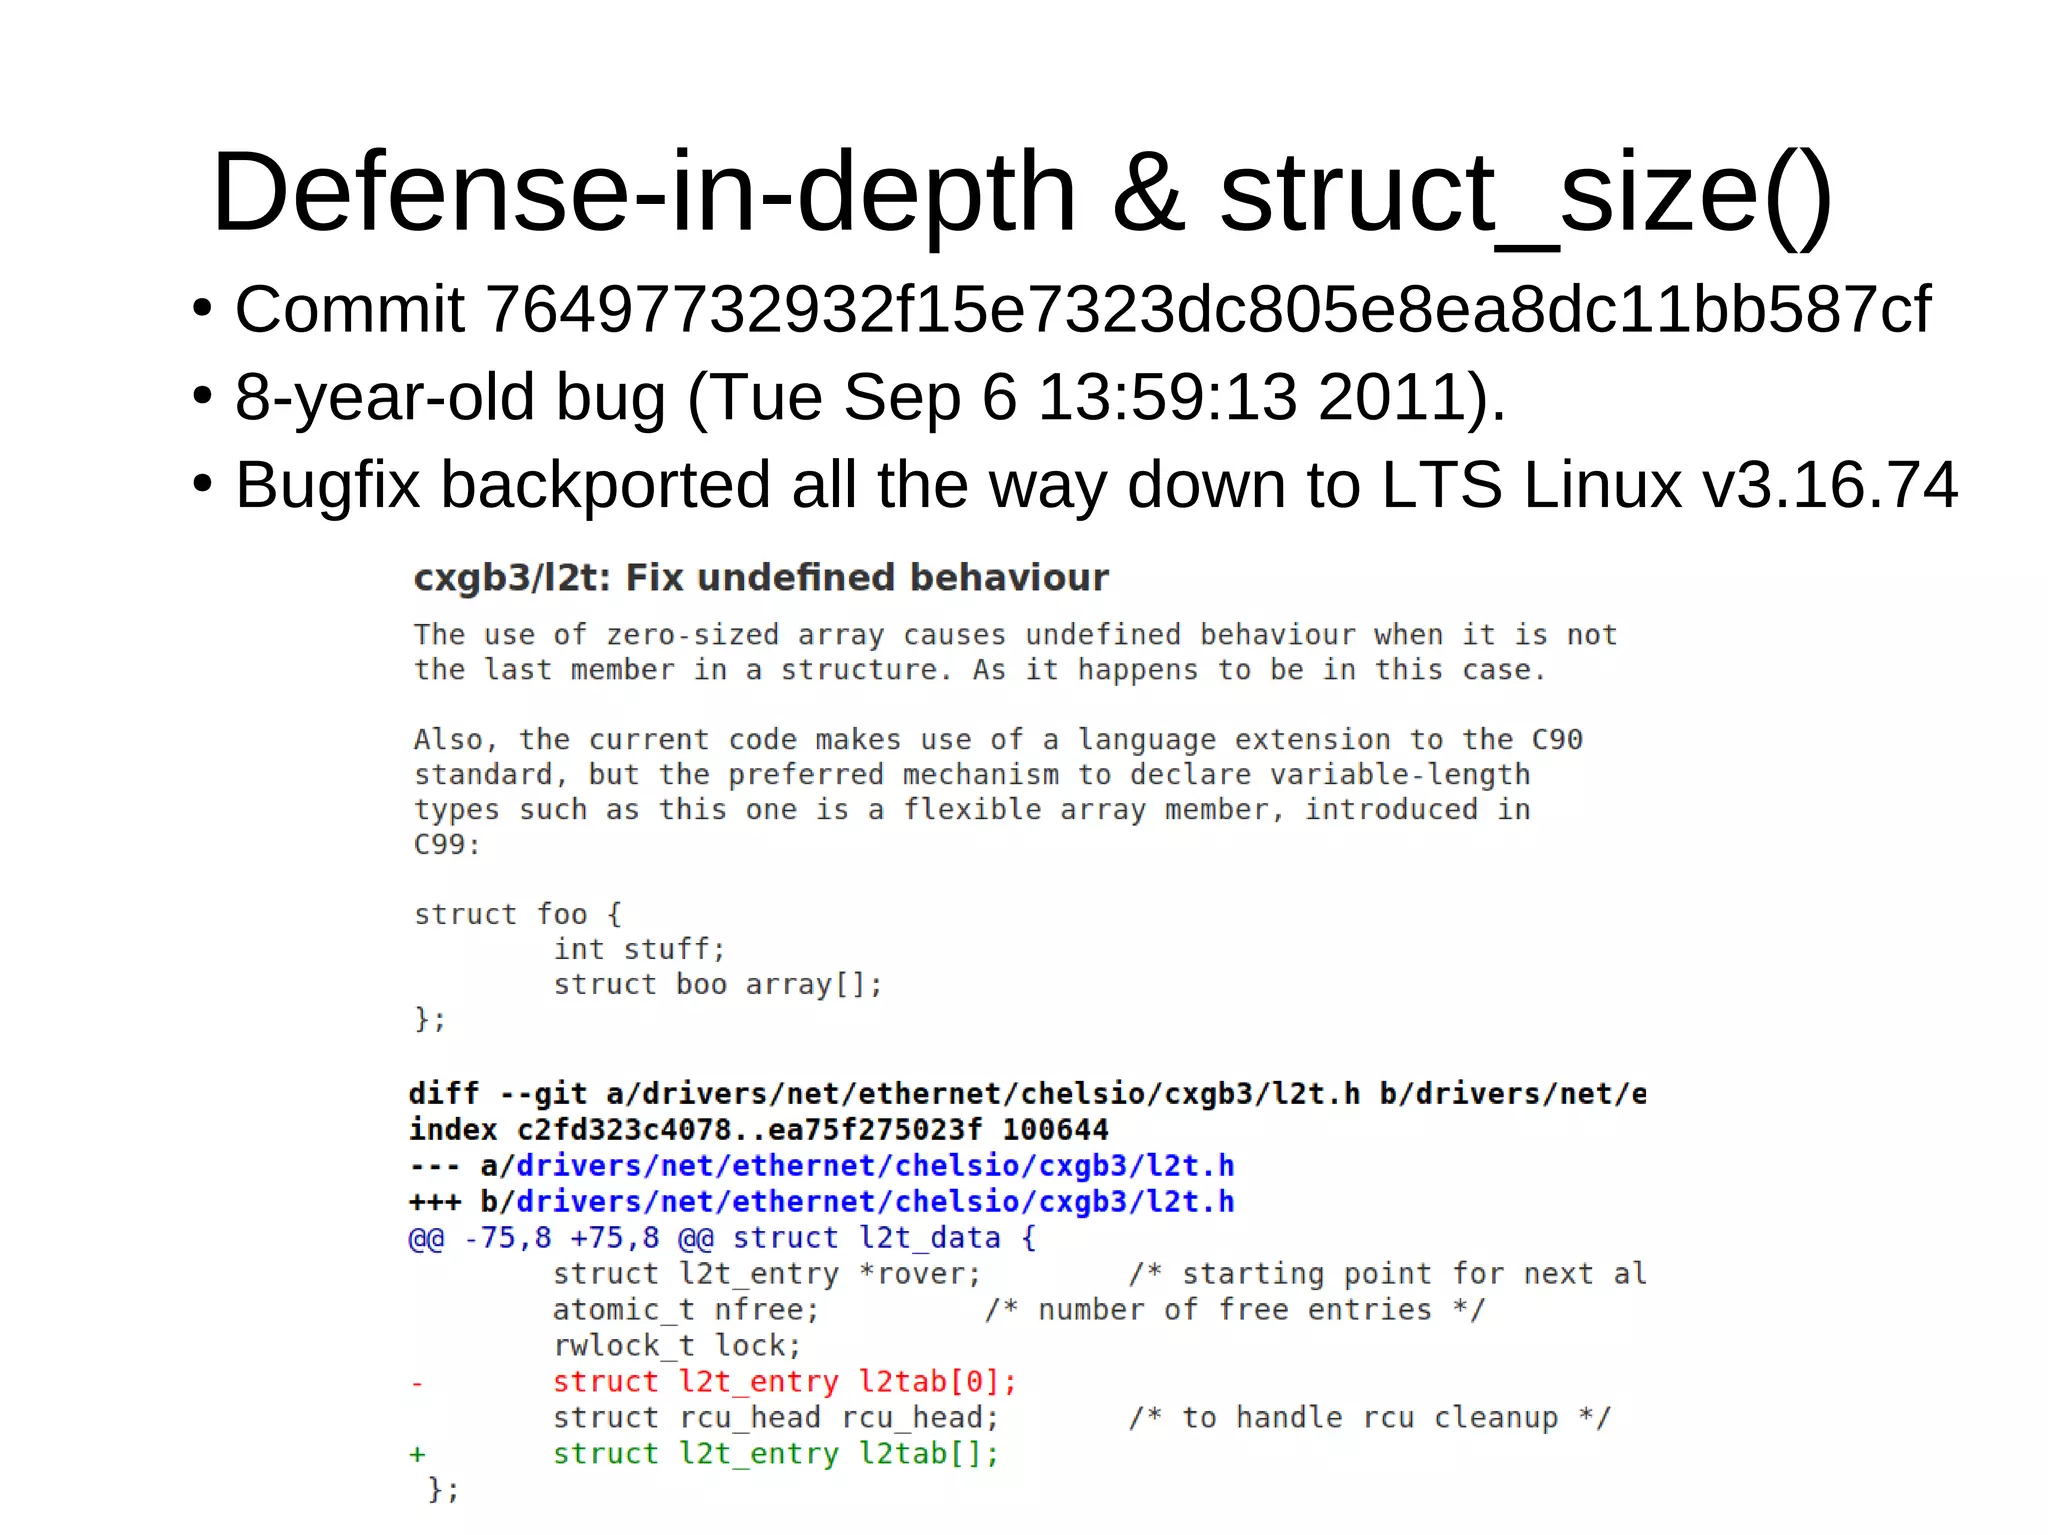
![Defense-in-depth & struct_size()
●
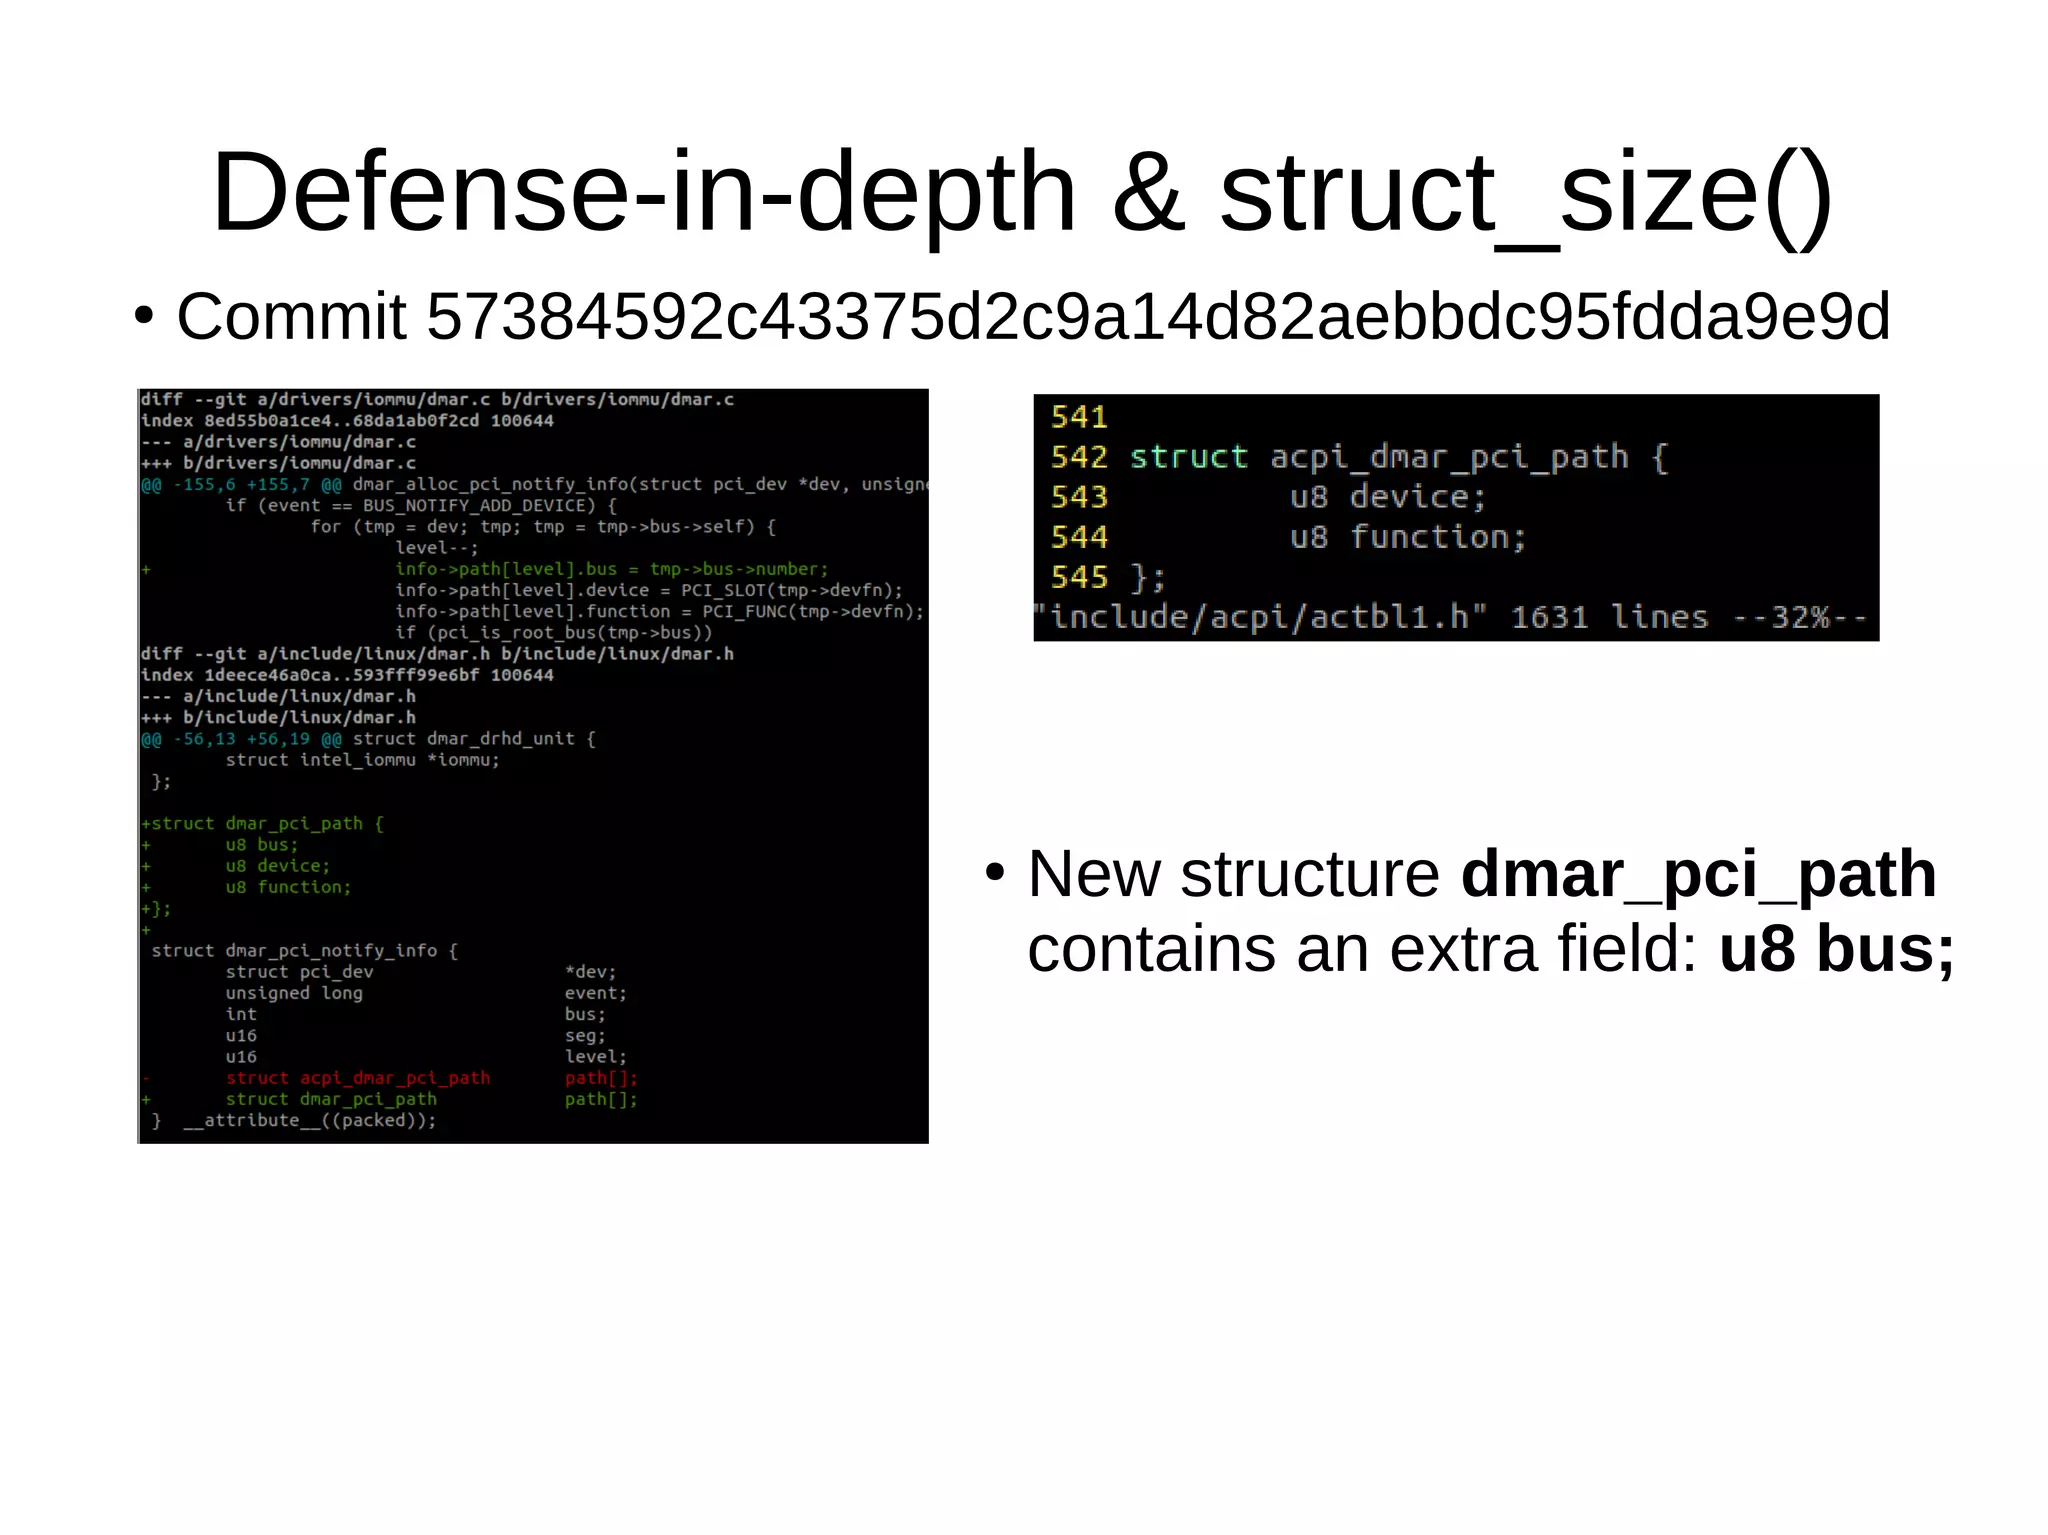
Commit 57384592c43375d2c9a14d82aebbdc95fdda9e9d
●
New structure dmar_pci_path
contains an extra field: u8 bus;
●
Overflow: info→path[level].bus = tmp→bus→number;
●
4-year-old+ bug (Thu Oct 2 11:50:25 2014)](https://image.slidesharecdn.com/gustavoarsilvakr2019-191001155204/75/Kernel-Recipes-2019-Hunting-and-fixing-bugs-all-over-the-Linux-kernel-52-2048.jpg)


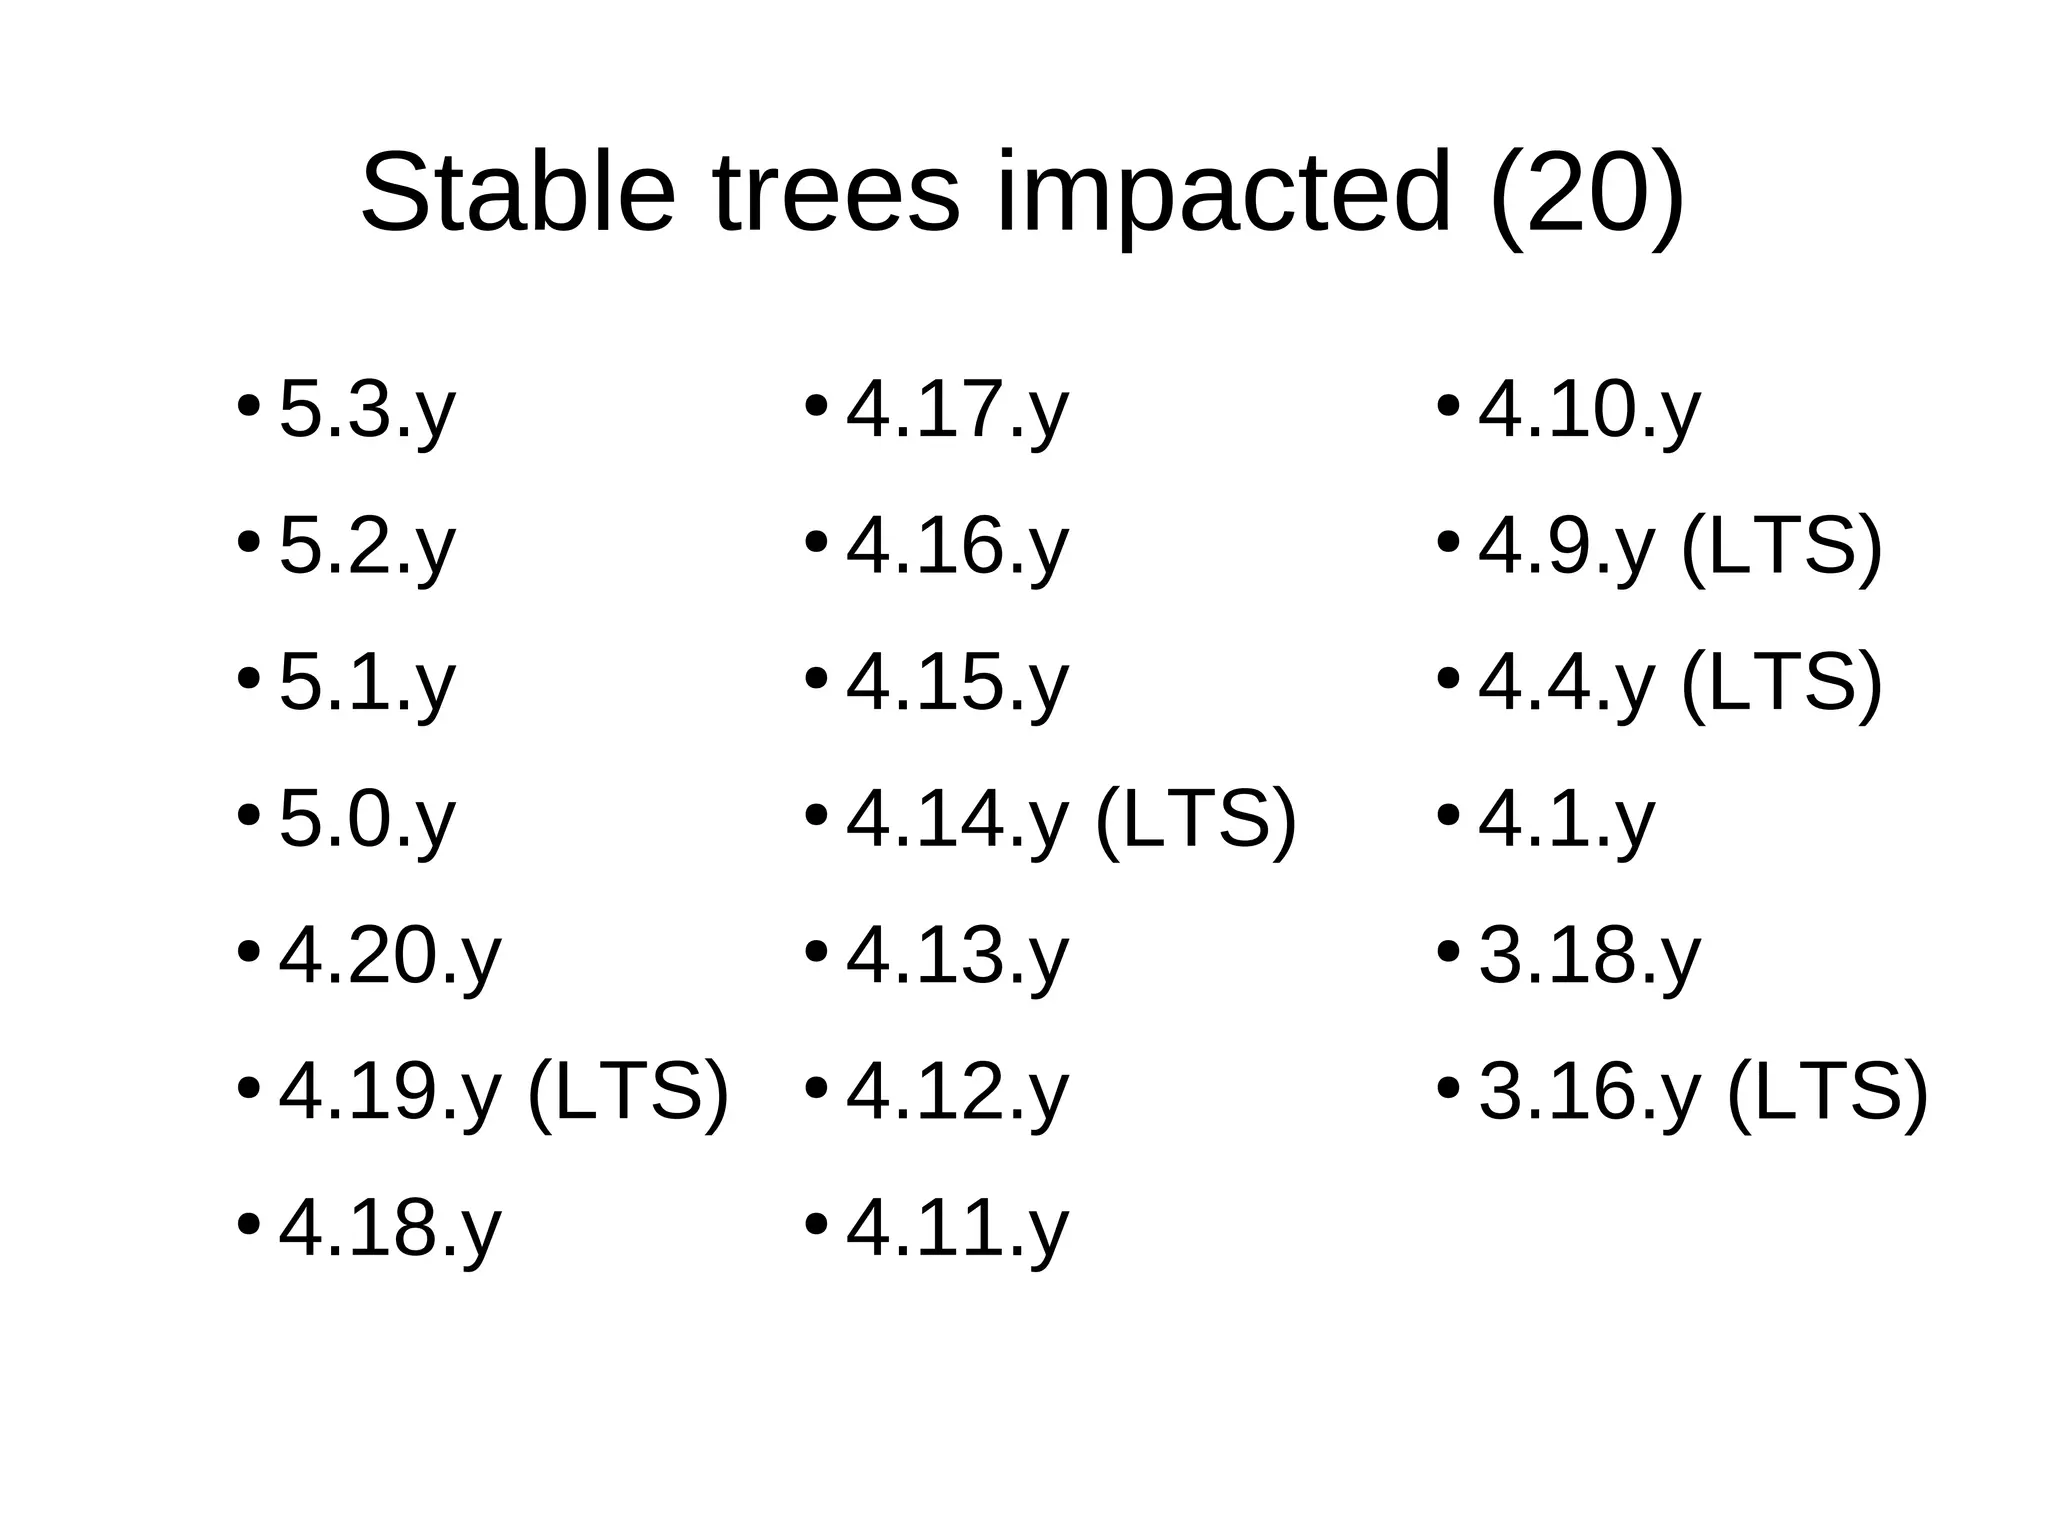
![Stable trees impacted (20)
●
5.3.y
●
5.2.y
●
5.1.y
●
5.0.y
●
4.20.y
●
4.19.y (LTS)
●
4.18.y
●
4.17.y
●
4.16.y
●
4.15.y
●
4.14.y
●
4.13.y
●
4.12.y[1]
●
4.11.y
●
4.10.y
●
4.9.y (LTS)
●
4.4.y (LTS)
●
4.1.y
●
3.18.y
●
3.16.y (LTS)
[1] Kick-off. First bugfixes. May 2017.
(LTS)](https://image.slidesharecdn.com/gustavoarsilvakr2019-191001155204/75/Kernel-Recipes-2019-Hunting-and-fixing-bugs-all-over-the-Linux-kernel-110-2048.jpg)
![Stable trees impacted (20)
●
5.3.y
●
5.2.y
●
5.1.y
●
5.0.y
●
4.20.y[2]
●
4.19.y (LTS)
●
4.18.y
●
4.17.y
●
4.16.y
●
4.15.y
●
4.14.y
●
4.13.y
●
●
4.11.y
●
4.10.y
●
4.9.y (LTS)
●
4.4.y (LTS)
●
4.1.y
●
3.18.y
●
3.16.y (LTS)
[1] Kick-off. First bugfixes. May 2017.
[2] VLAs erradicated from kernel. December 2018.
(LTS)
4.12.y[1]](https://image.slidesharecdn.com/gustavoarsilvakr2019-191001155204/75/Kernel-Recipes-2019-Hunting-and-fixing-bugs-all-over-the-Linux-kernel-111-2048.jpg)
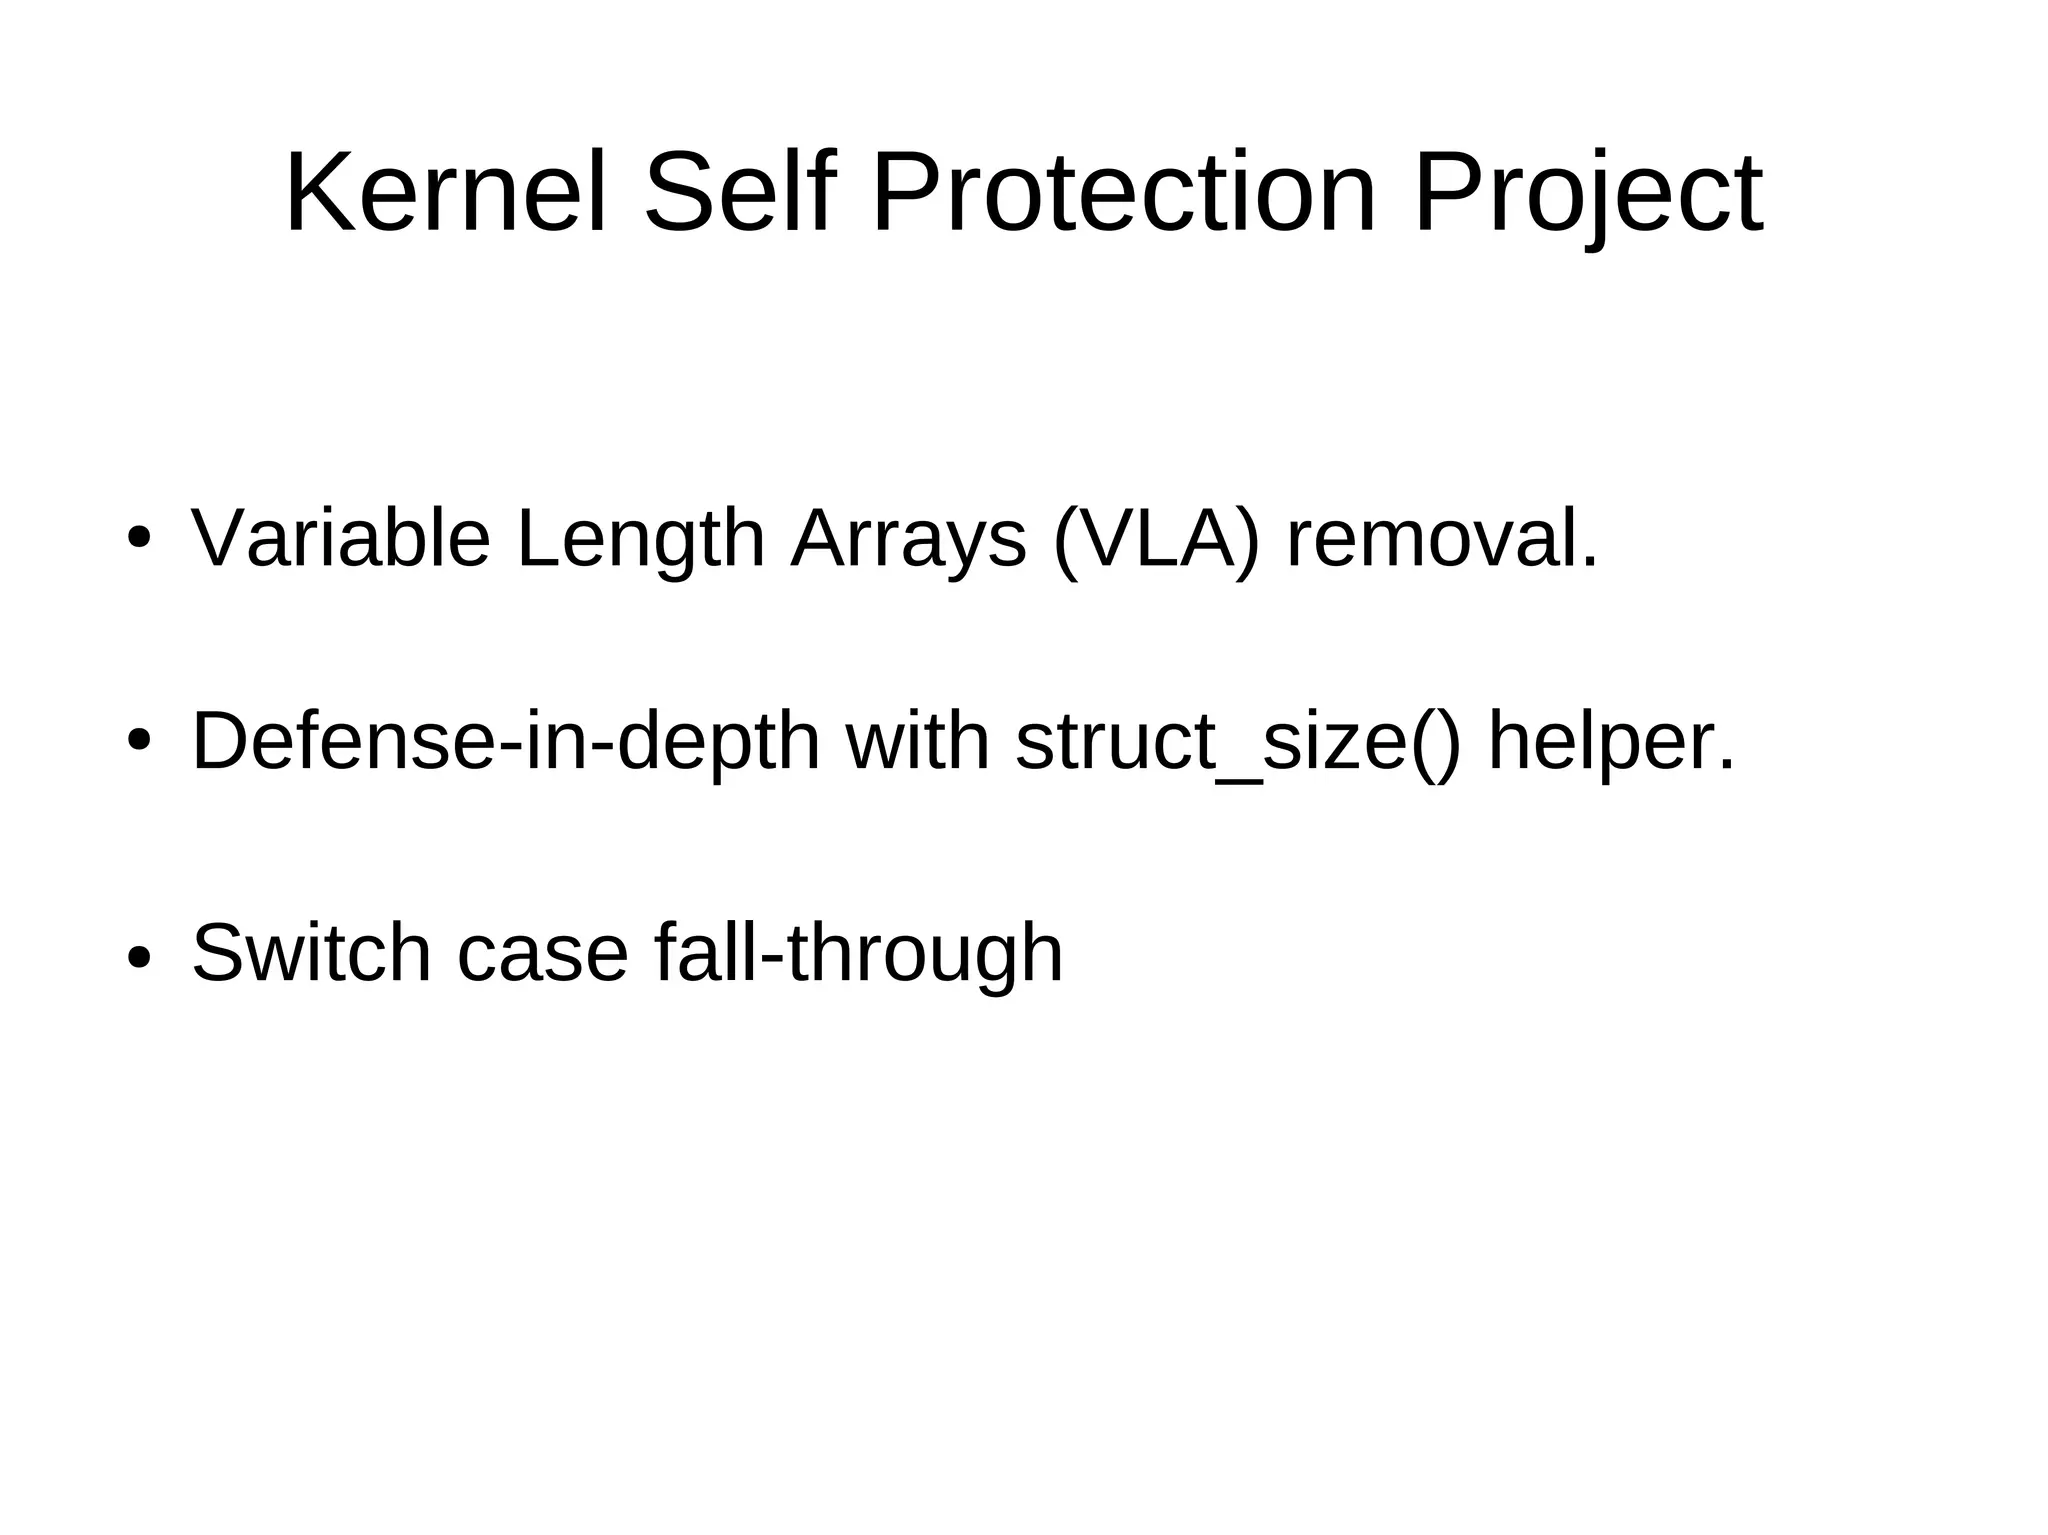
![Stable trees impacted (20)
●
5.3.y[3]
●
5.2.y
●
5.1.y
●
5.0.y
●
4.20.y[2]
●
4.19.y (LTS)
●
4.18.y
●
4.17.y
●
4.16.y
●
4.15.y
●
4.14.y
●
4.13.y
●
●
4.11.y
●
4.10.y
●
4.9.y (LTS)
●
4.4.y (LTS)
●
4.1.y
●
3.18.y
●
3.16.y (LTS)
[1] Kick-off. First bugfixes. May 2017.
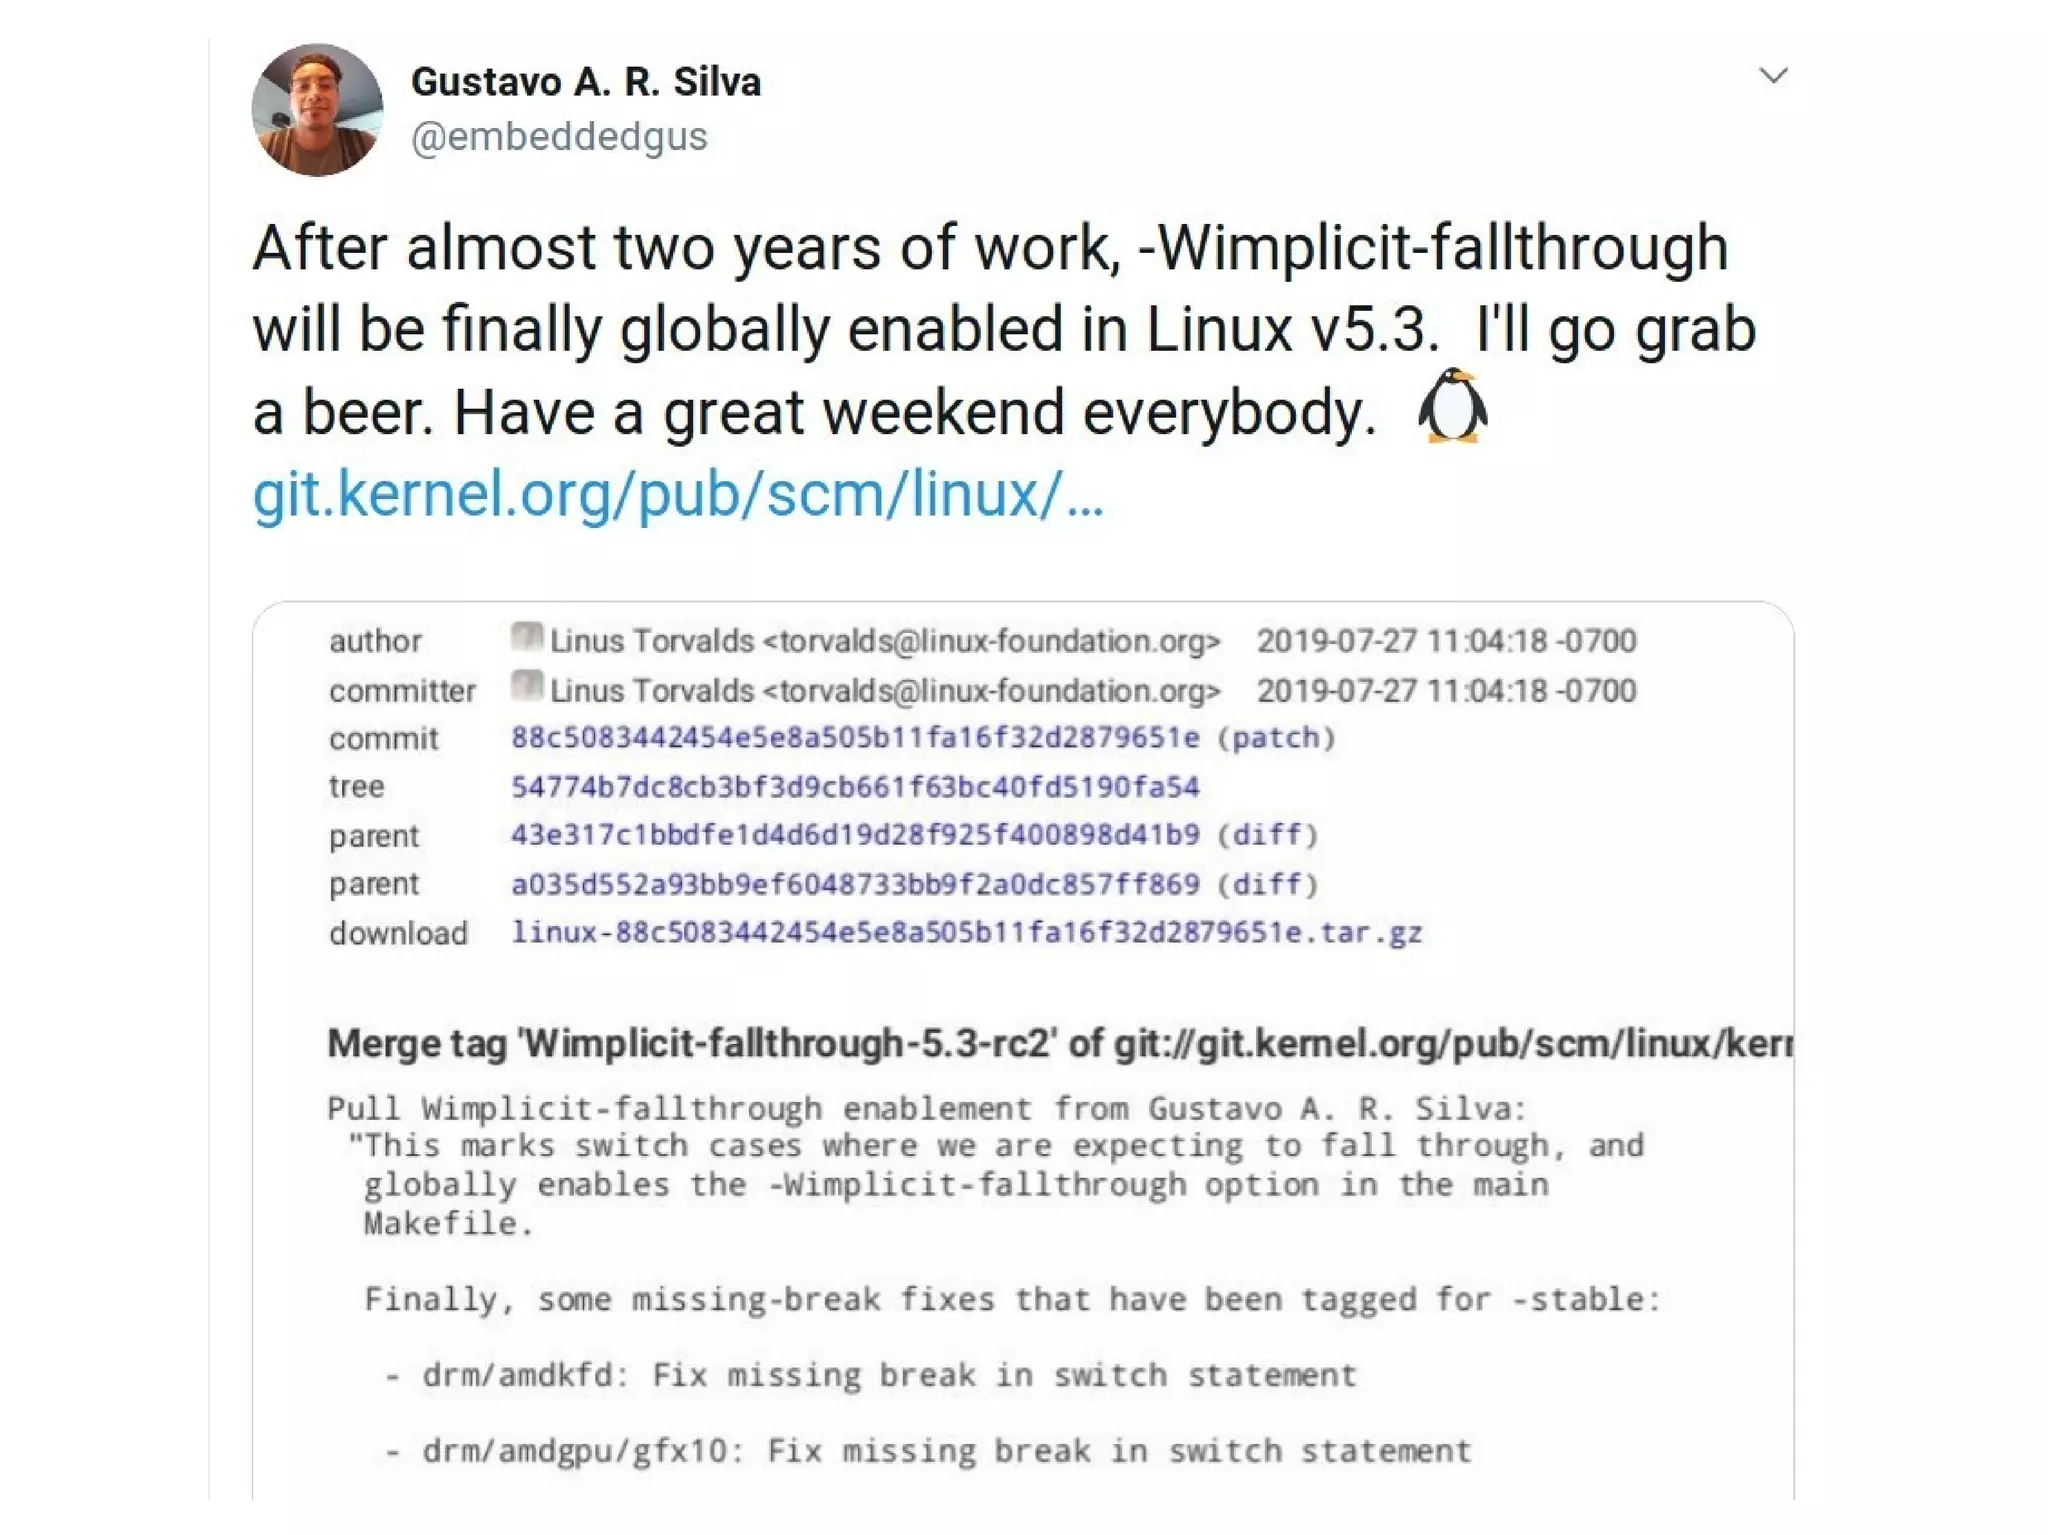
[3] -Wimplicit-fallthrough globally enabled by default. September 2019
[2] VLAs erradicated from kernel. December 2018.
4.12.y[1]
(LTS)](https://image.slidesharecdn.com/gustavoarsilvakr2019-191001155204/75/Kernel-Recipes-2019-Hunting-and-fixing-bugs-all-over-the-Linux-kernel-112-2048.jpg)


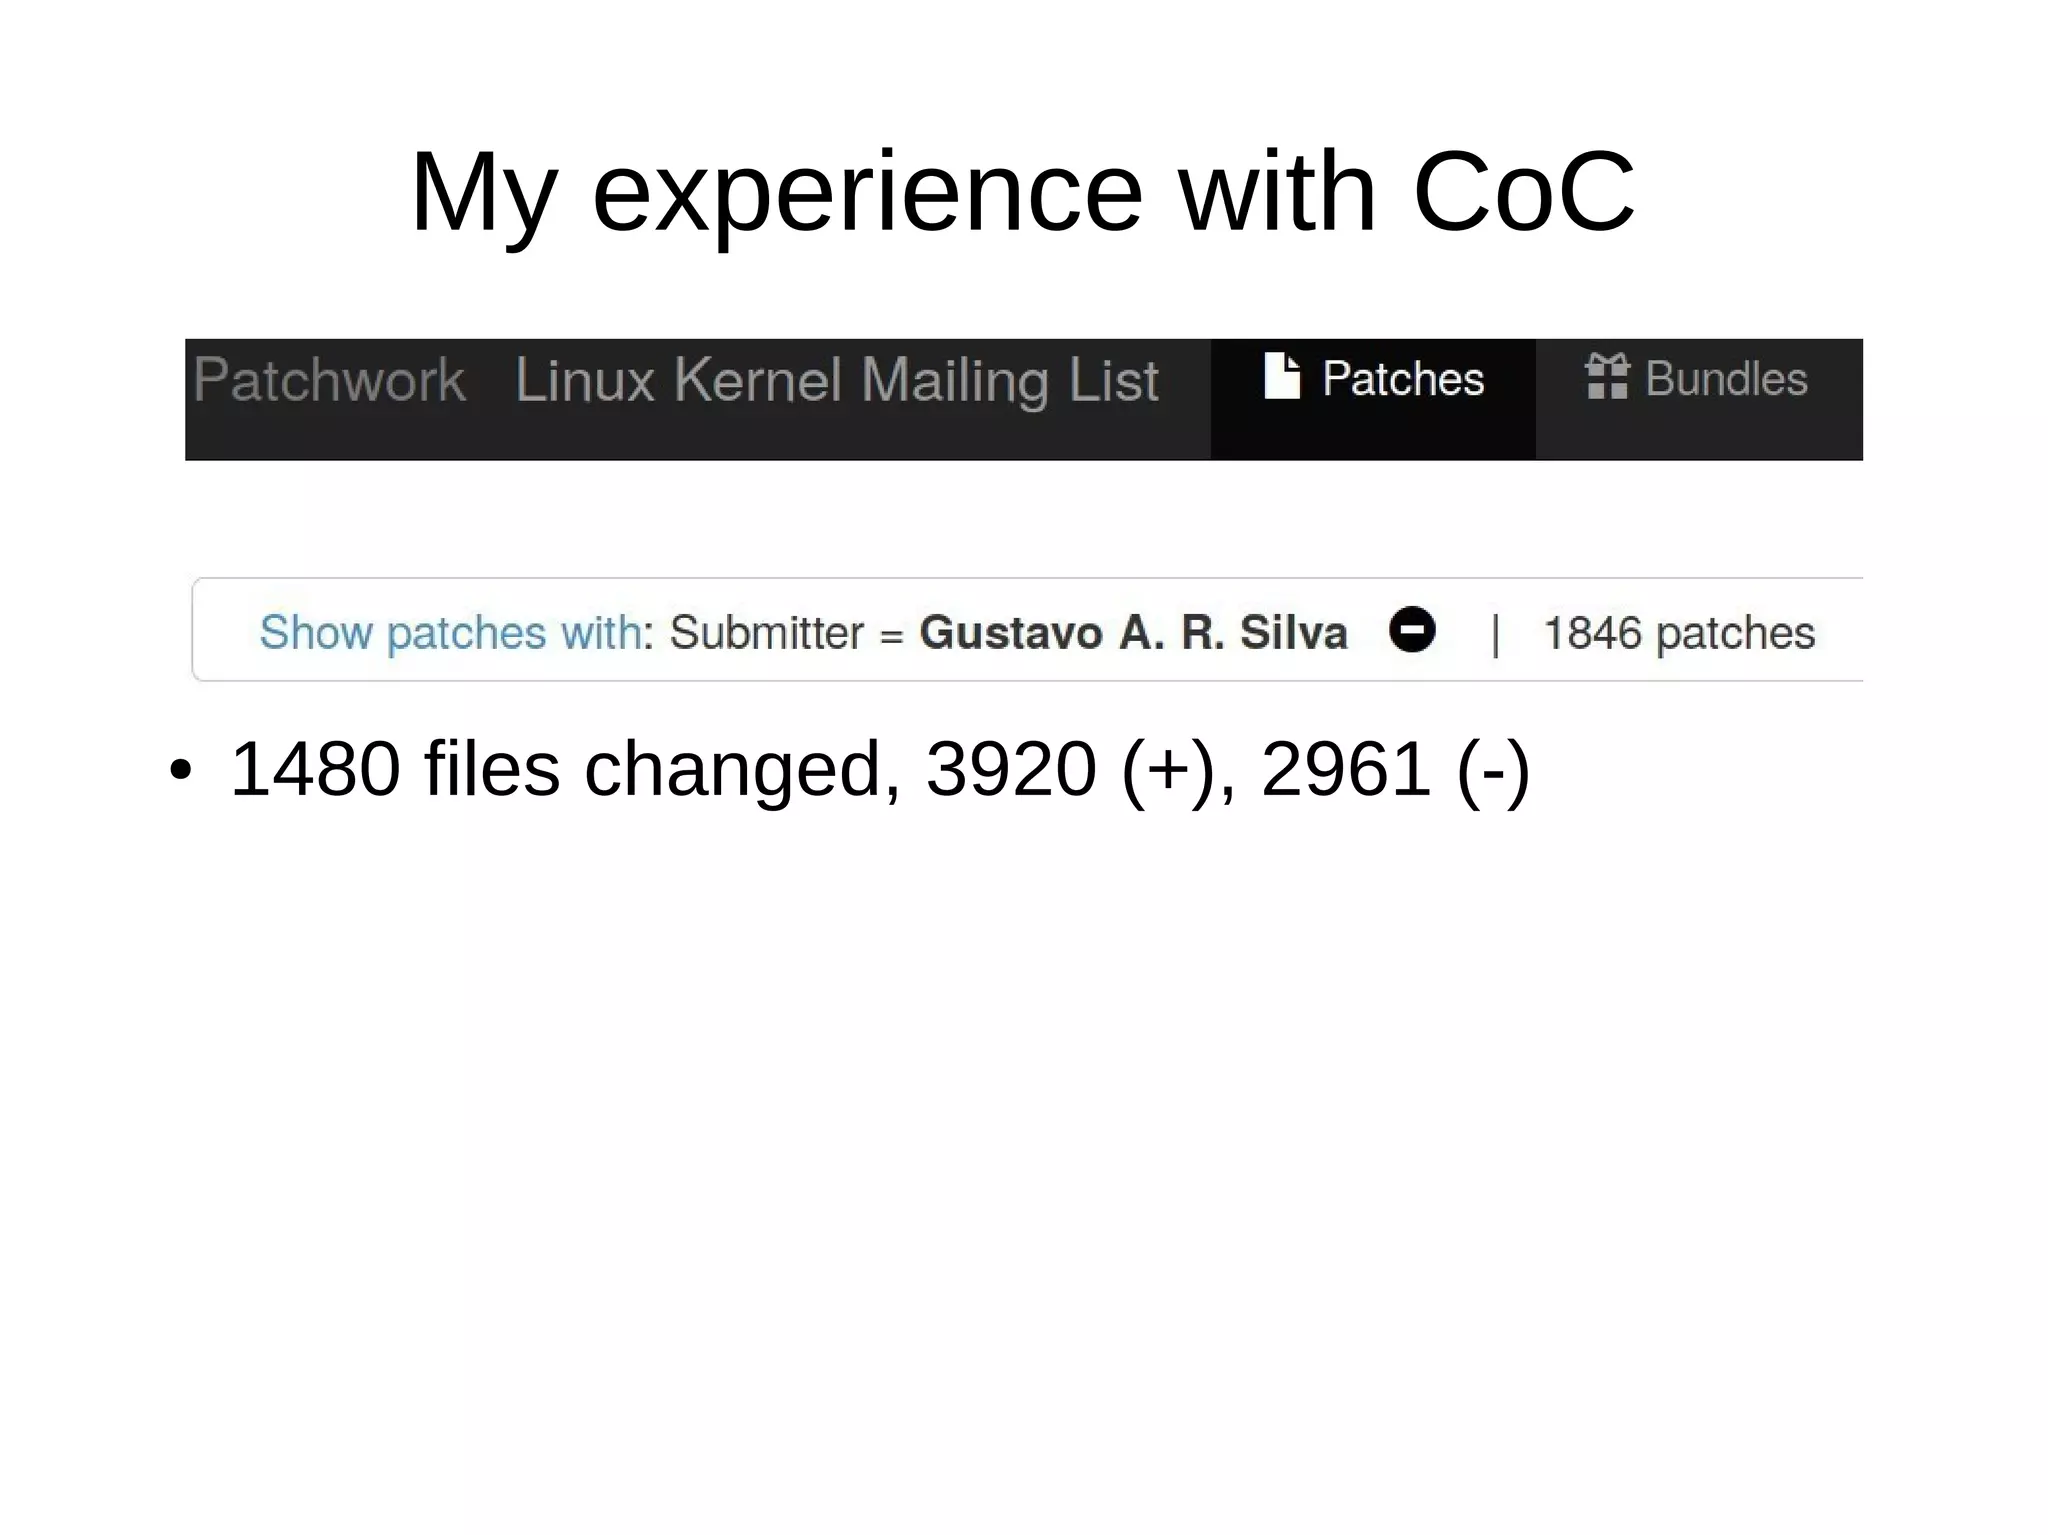


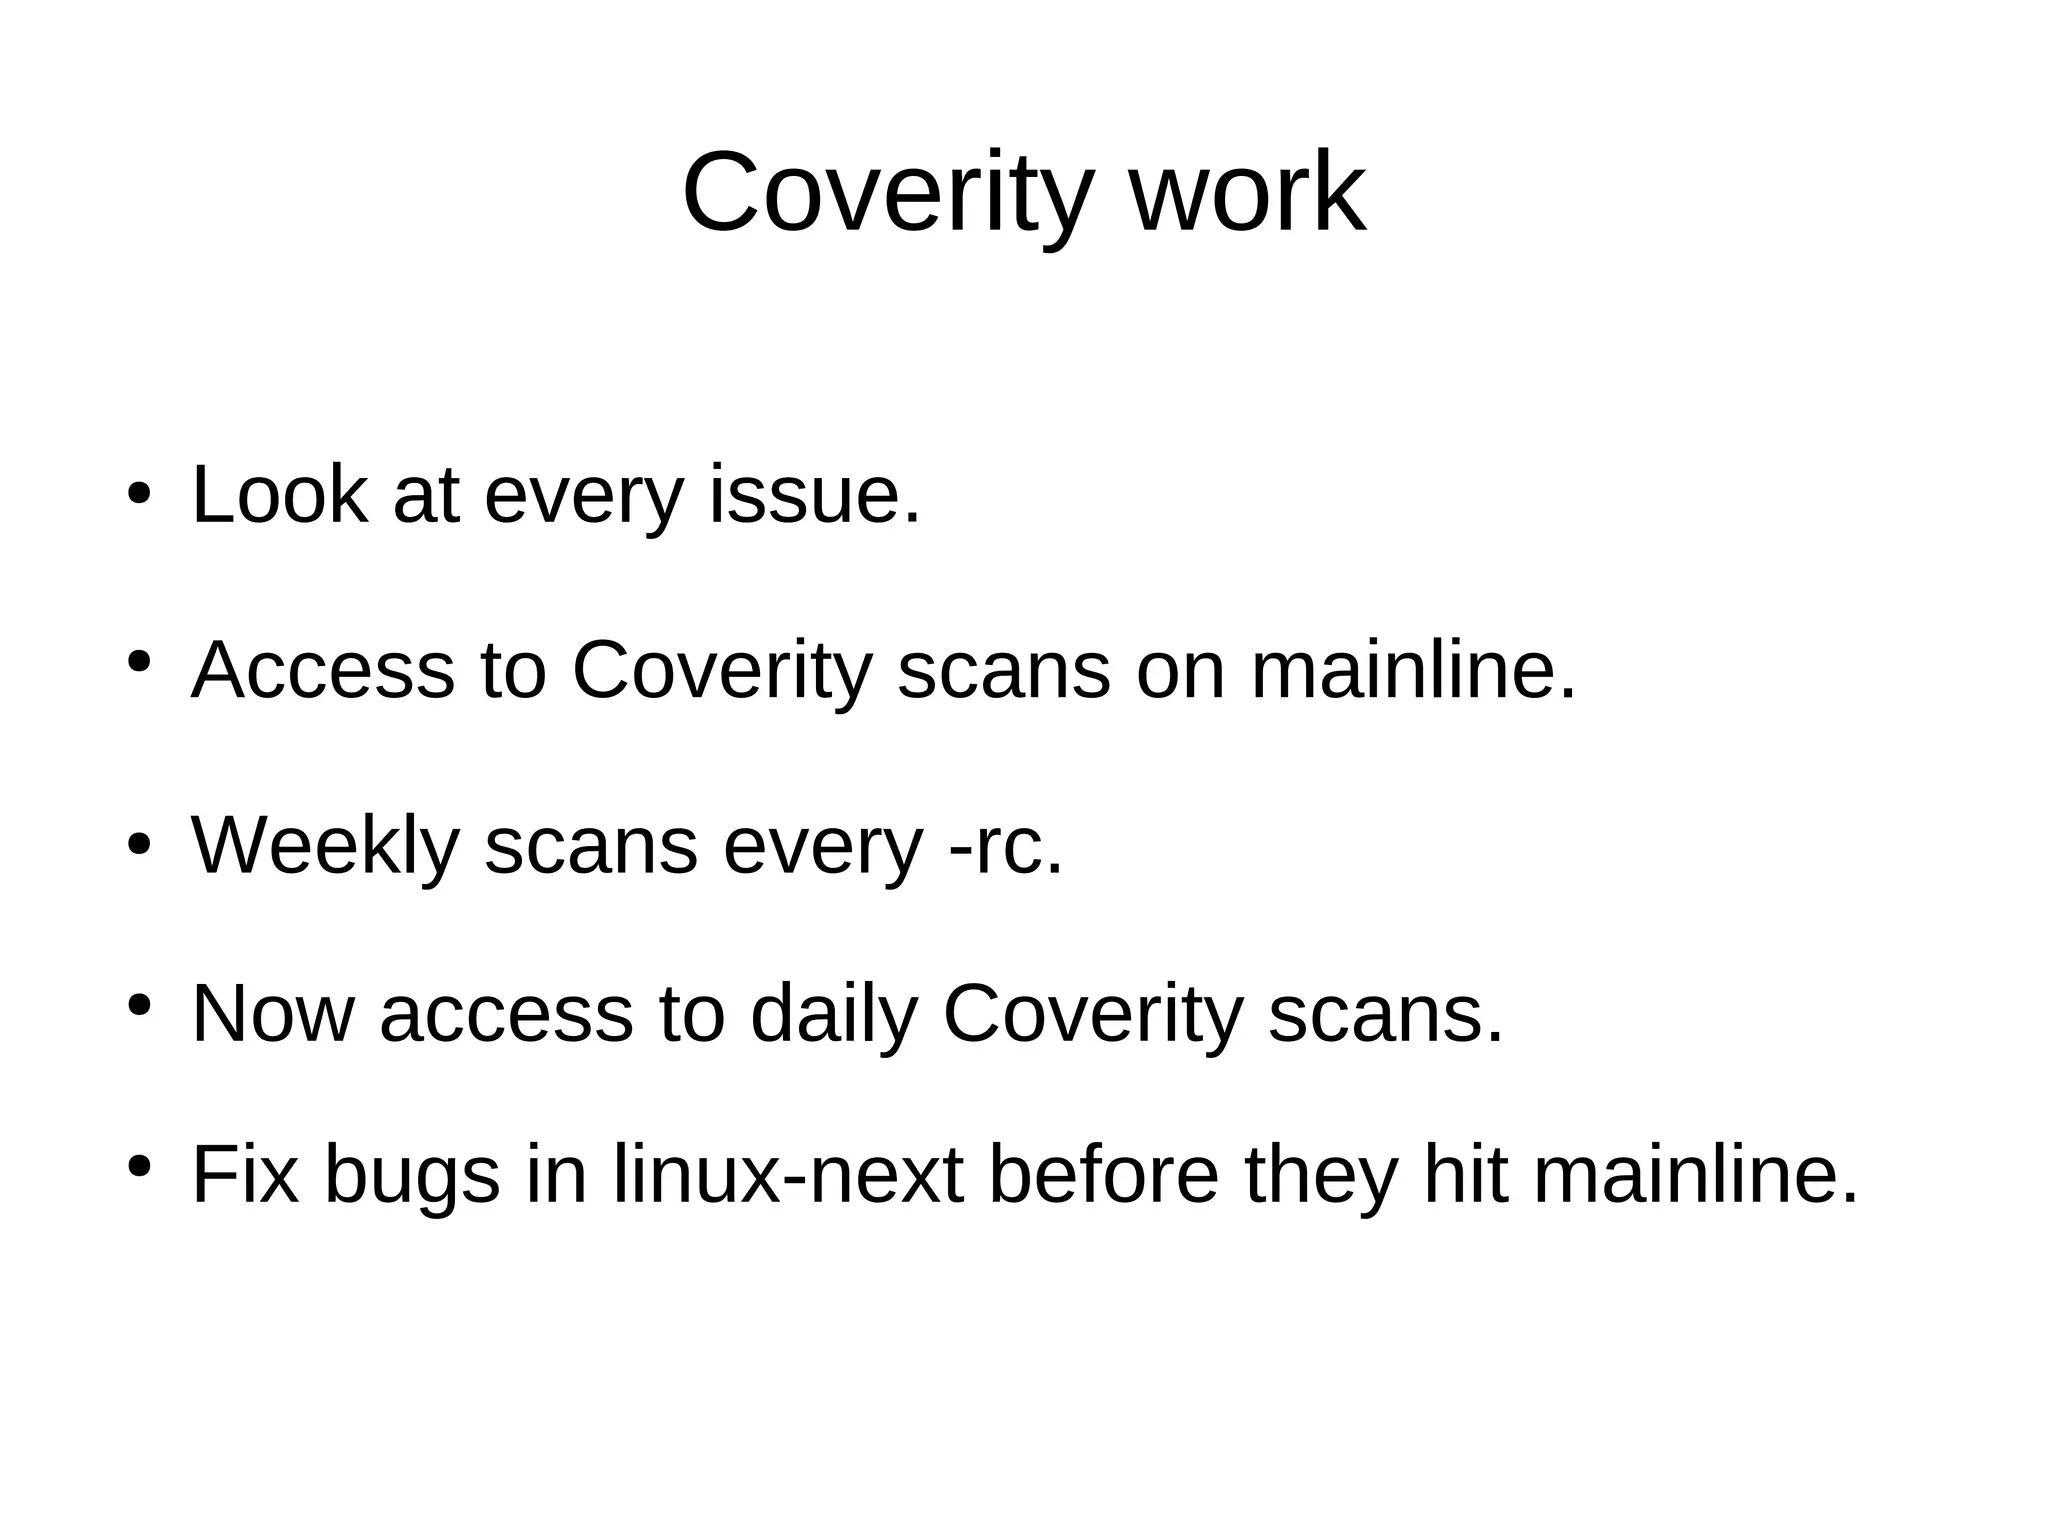
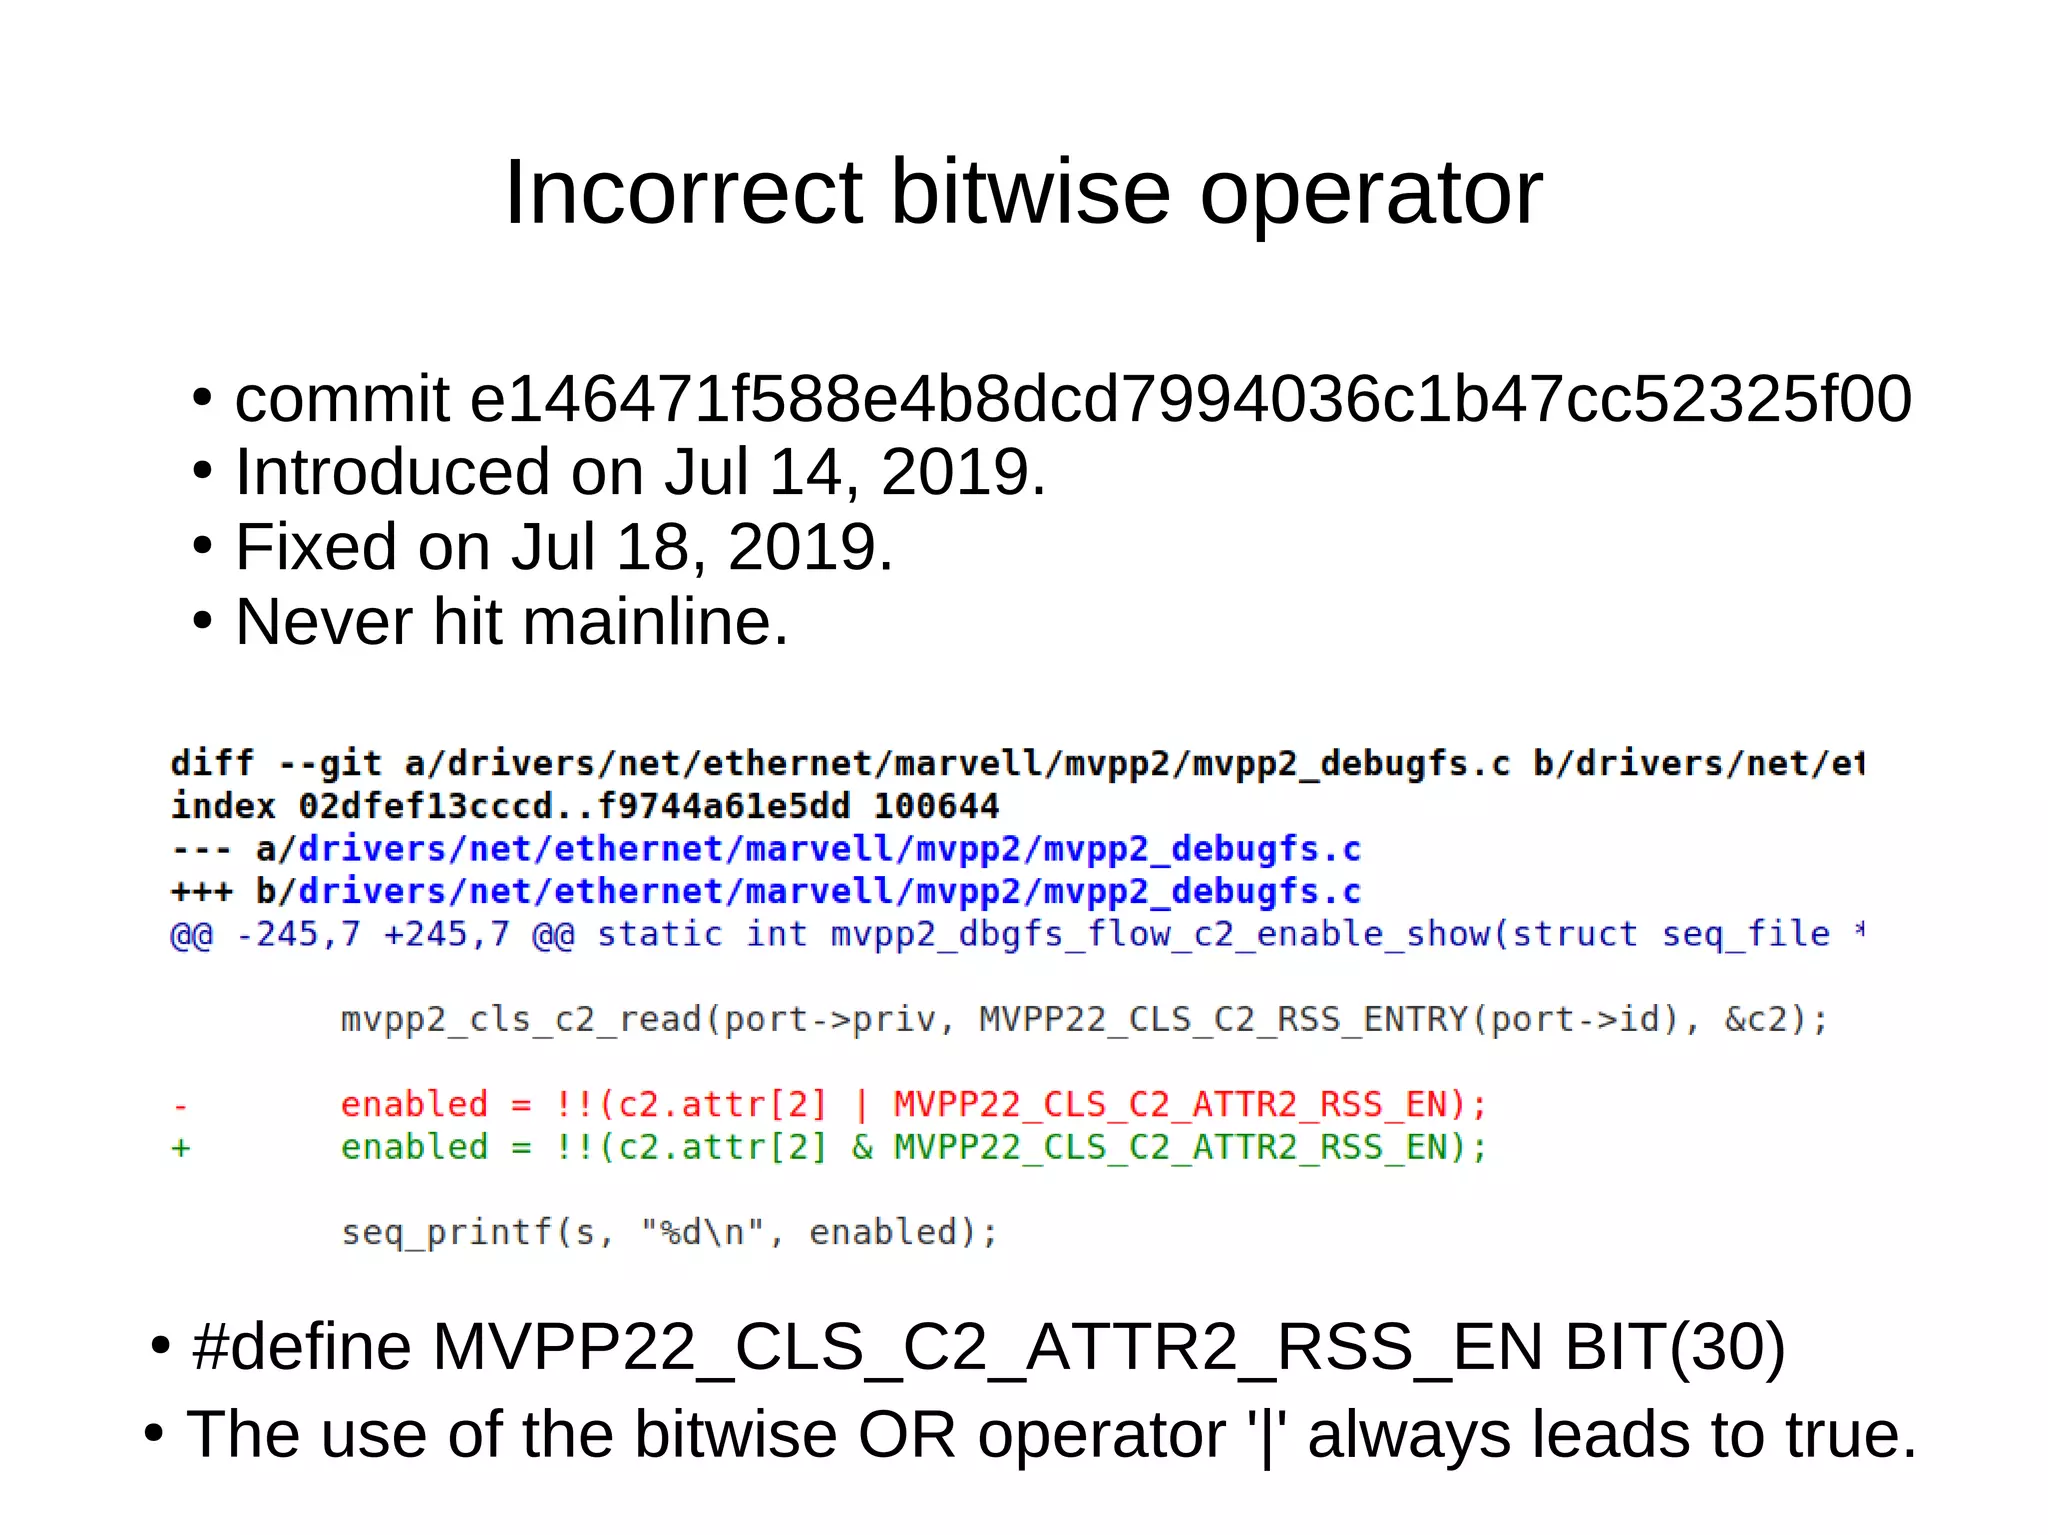
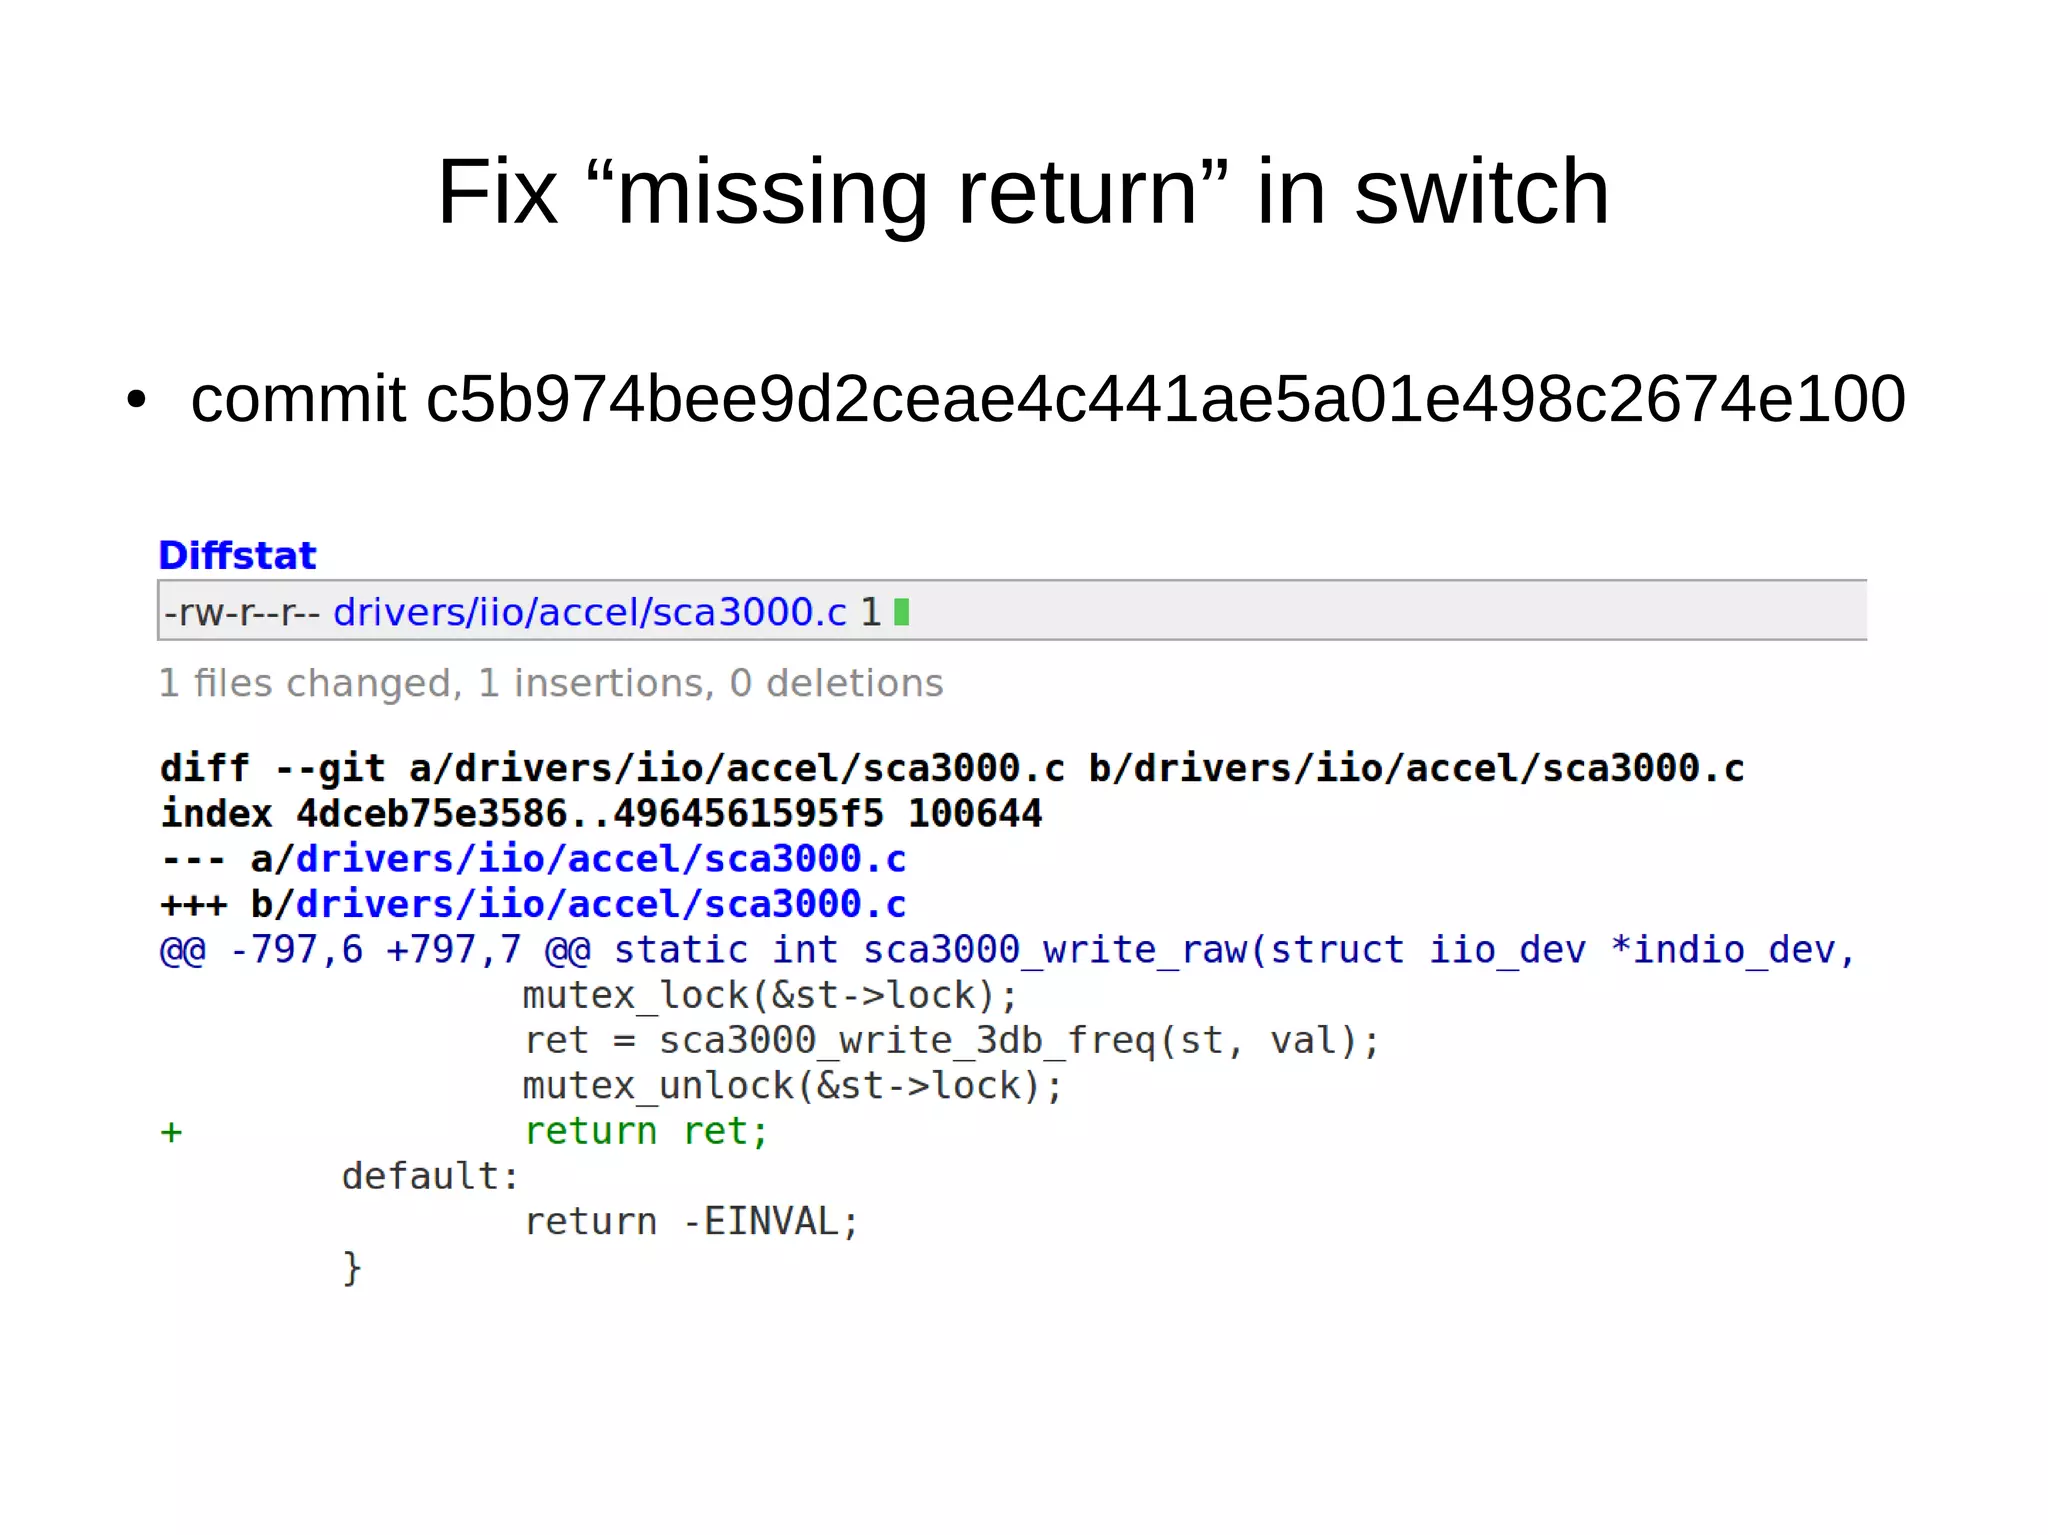
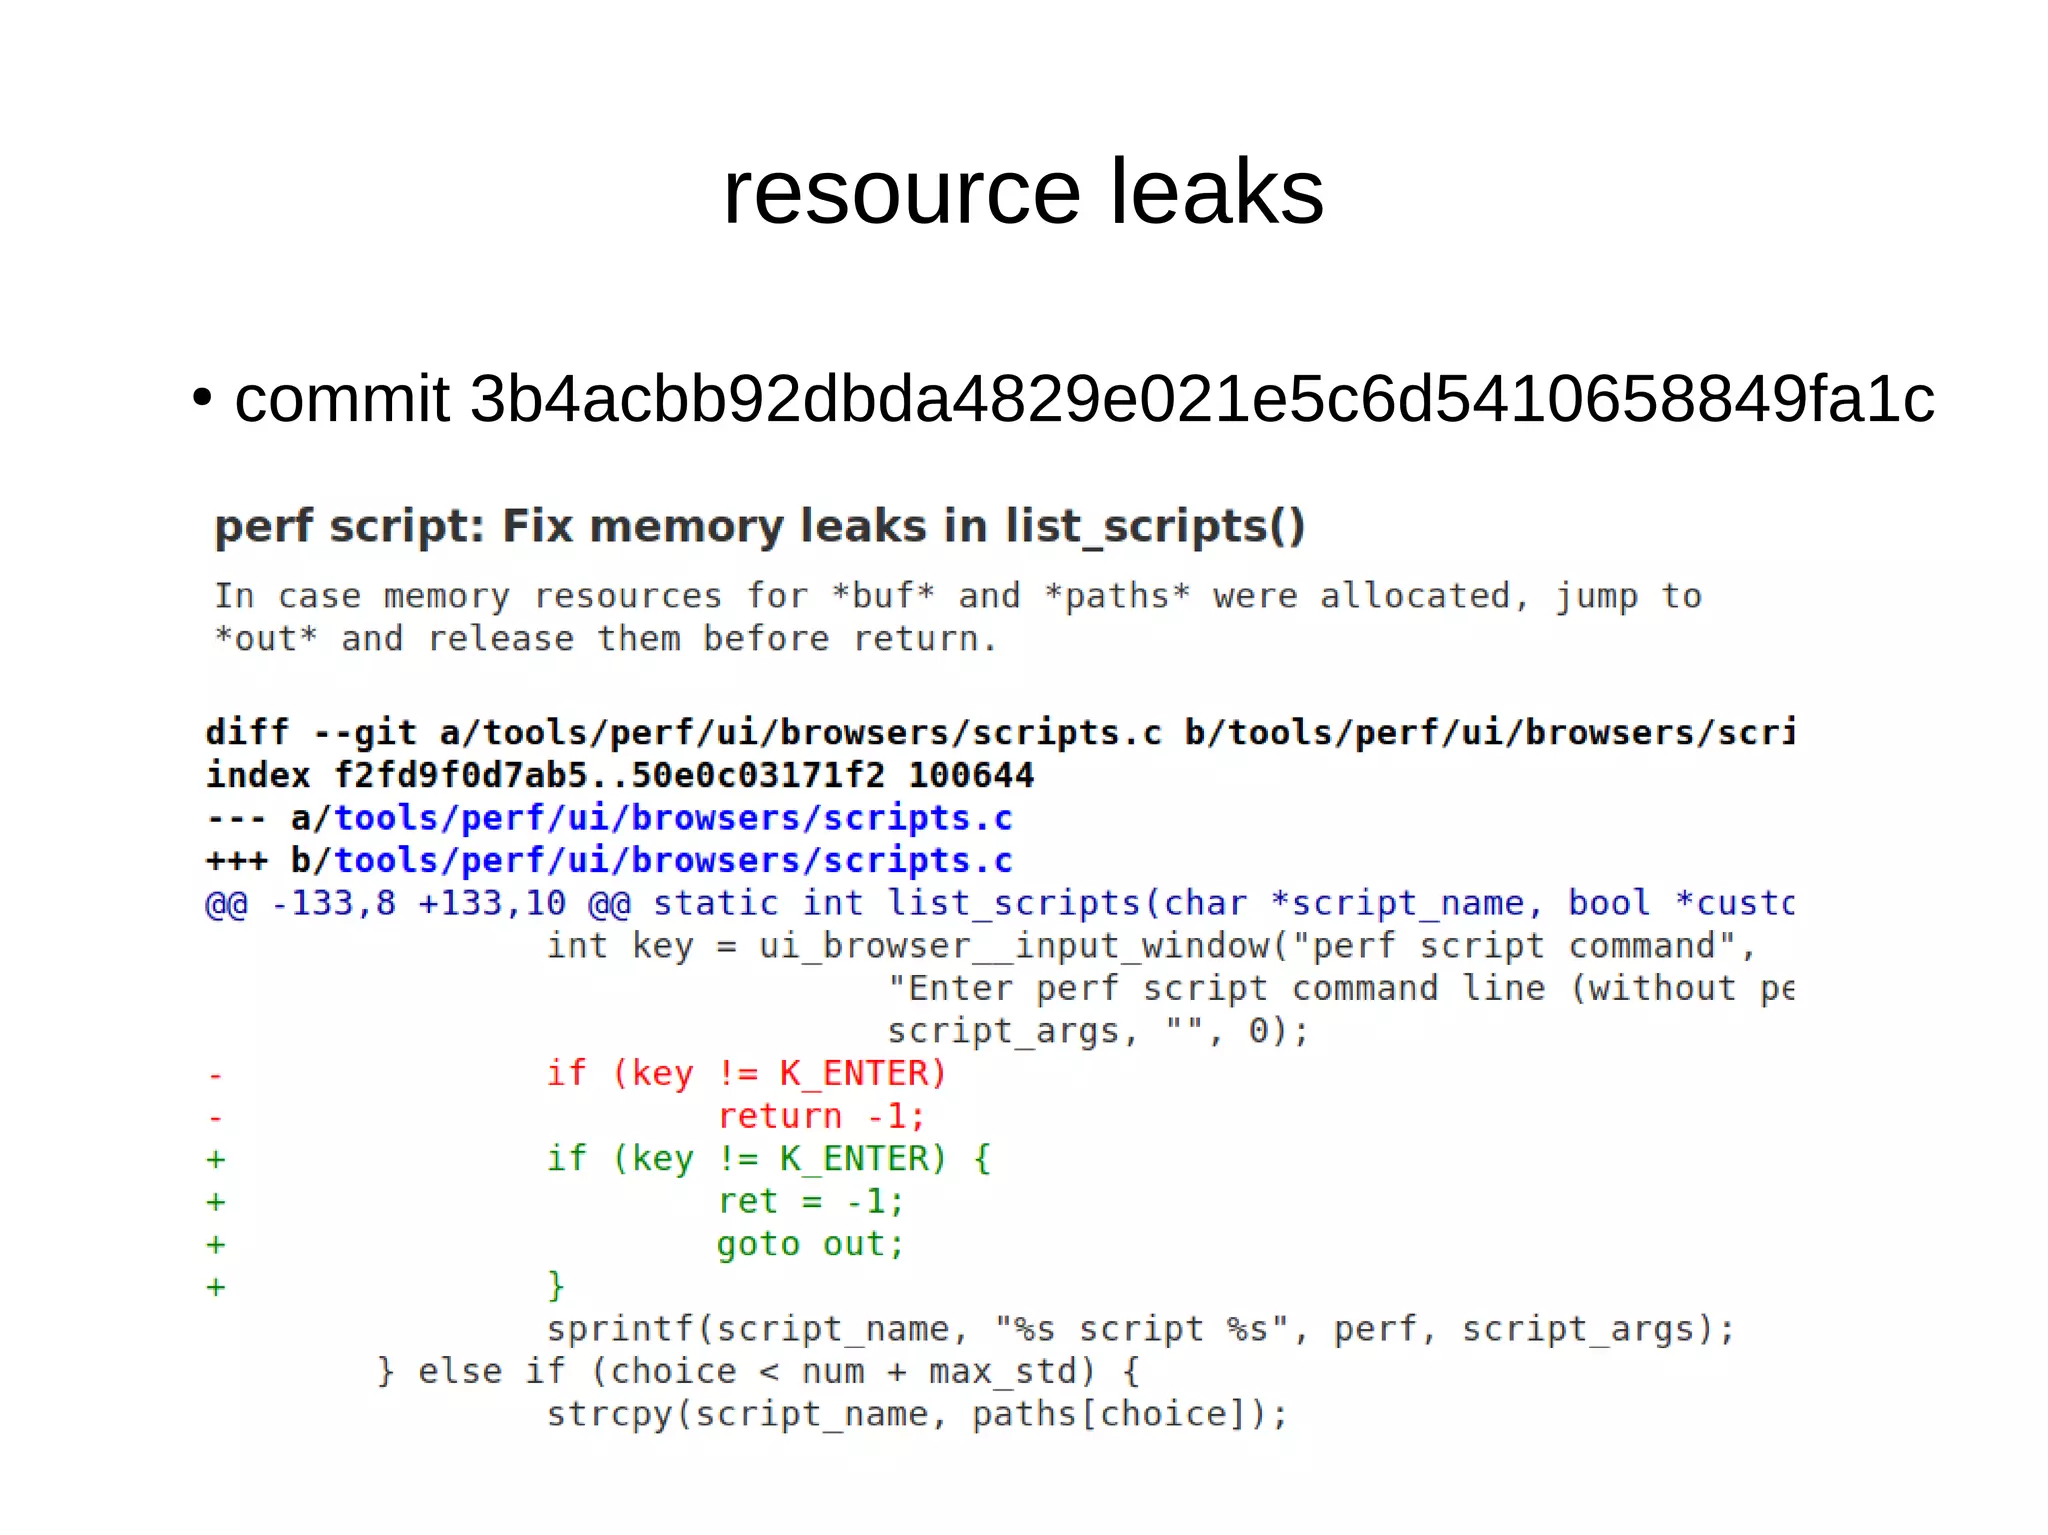
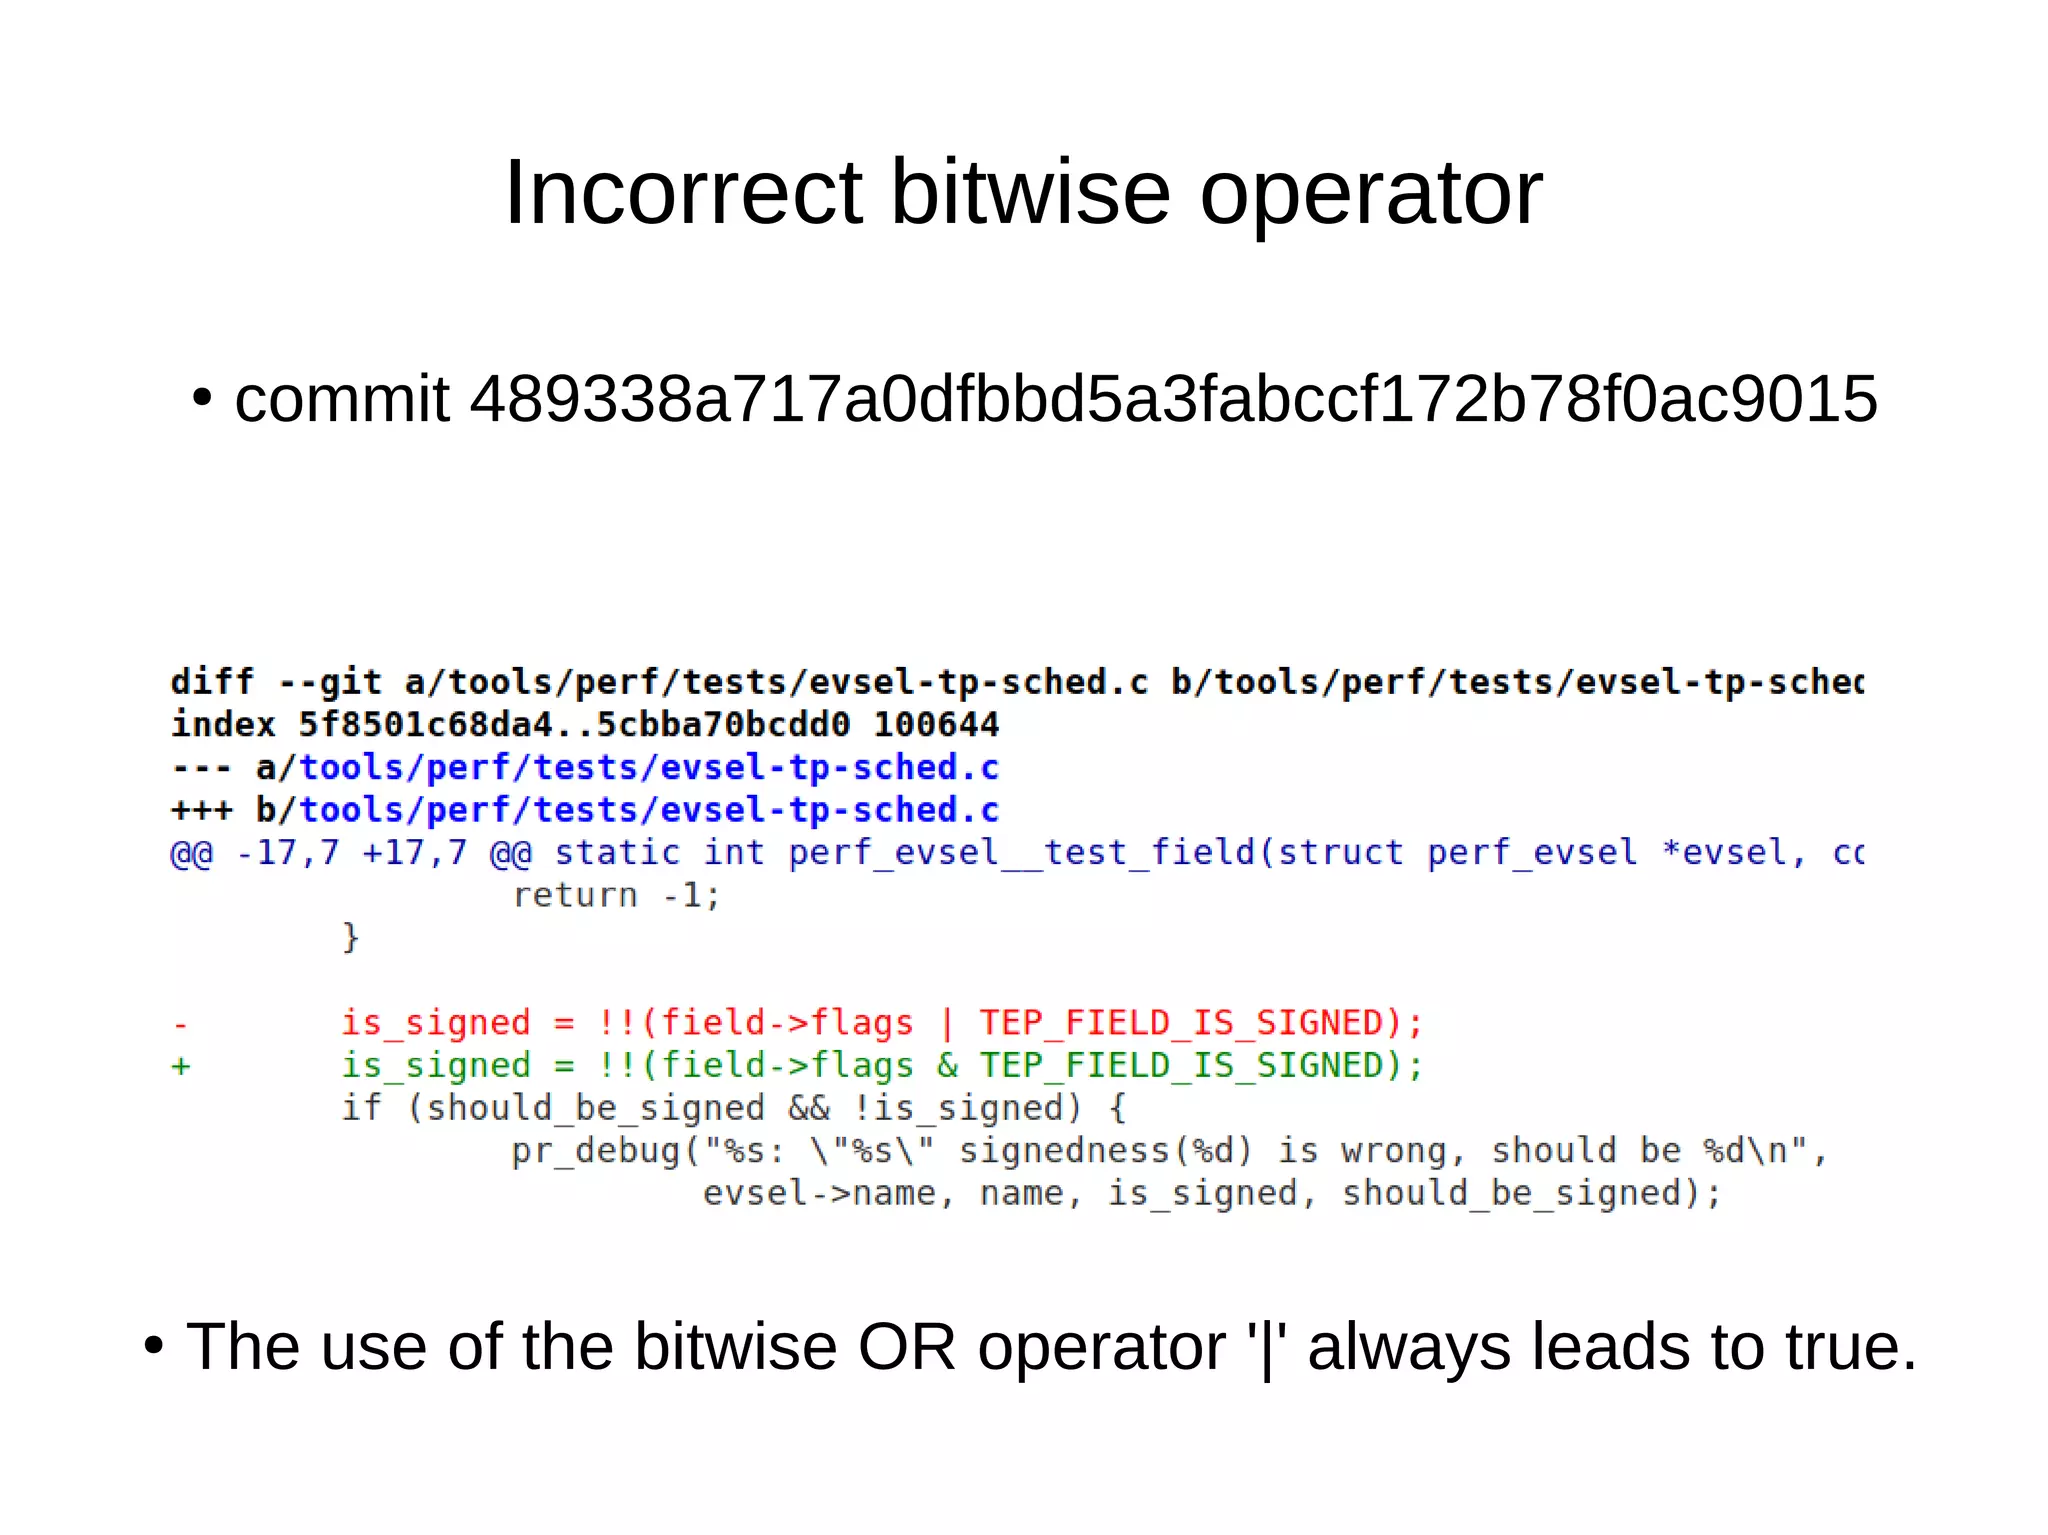
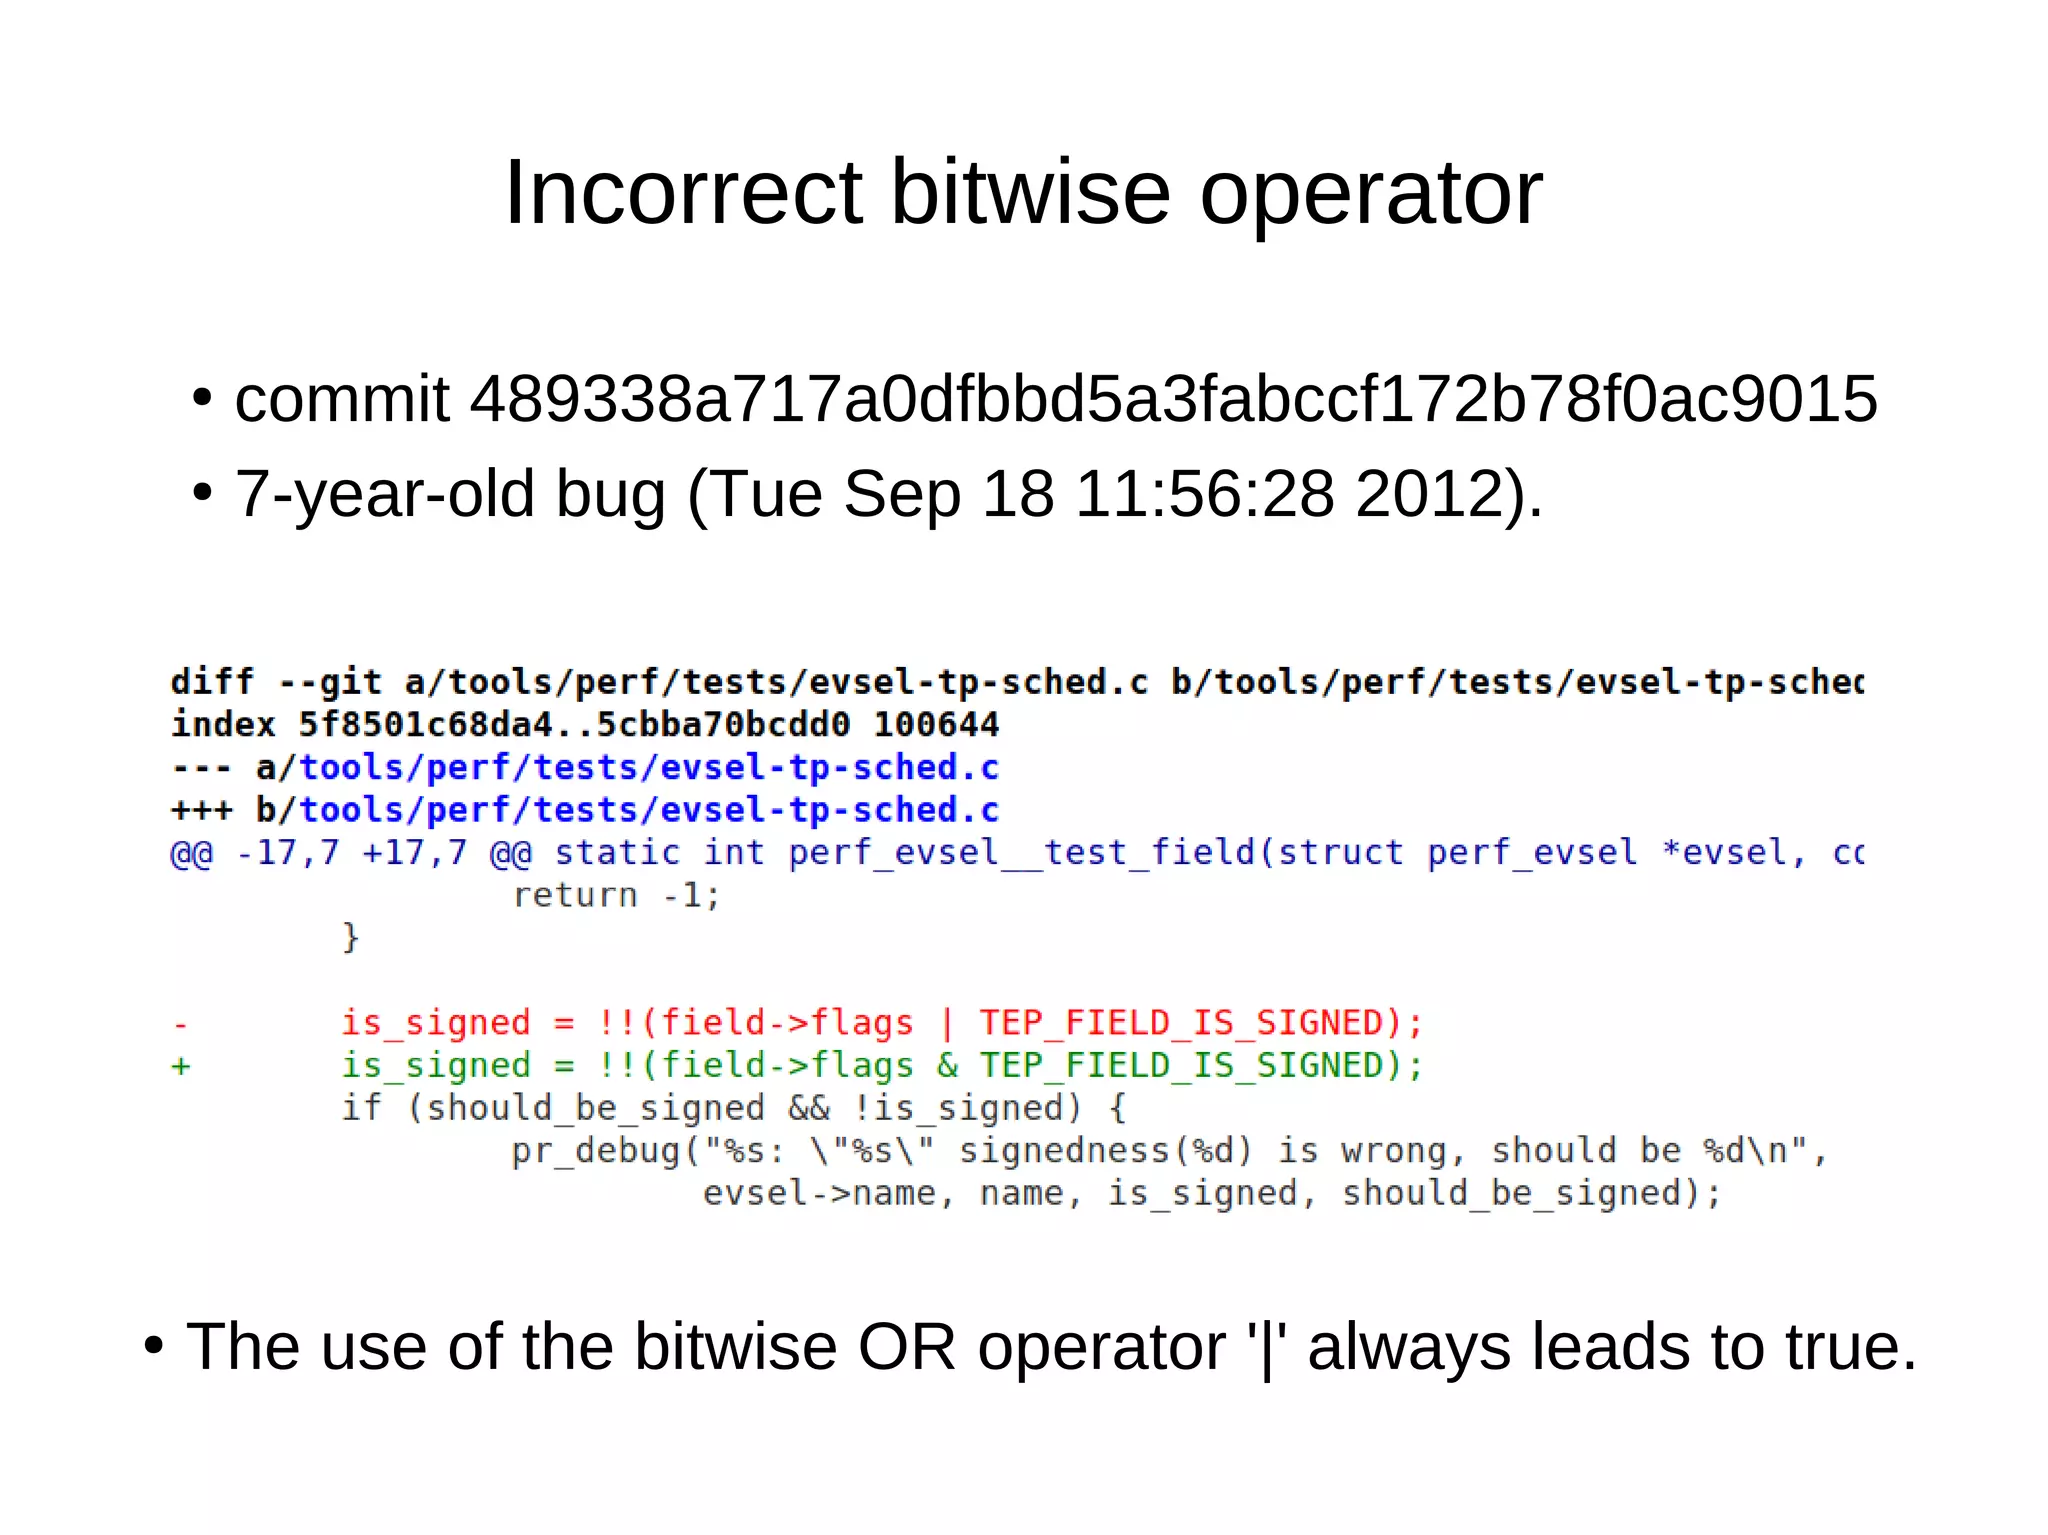
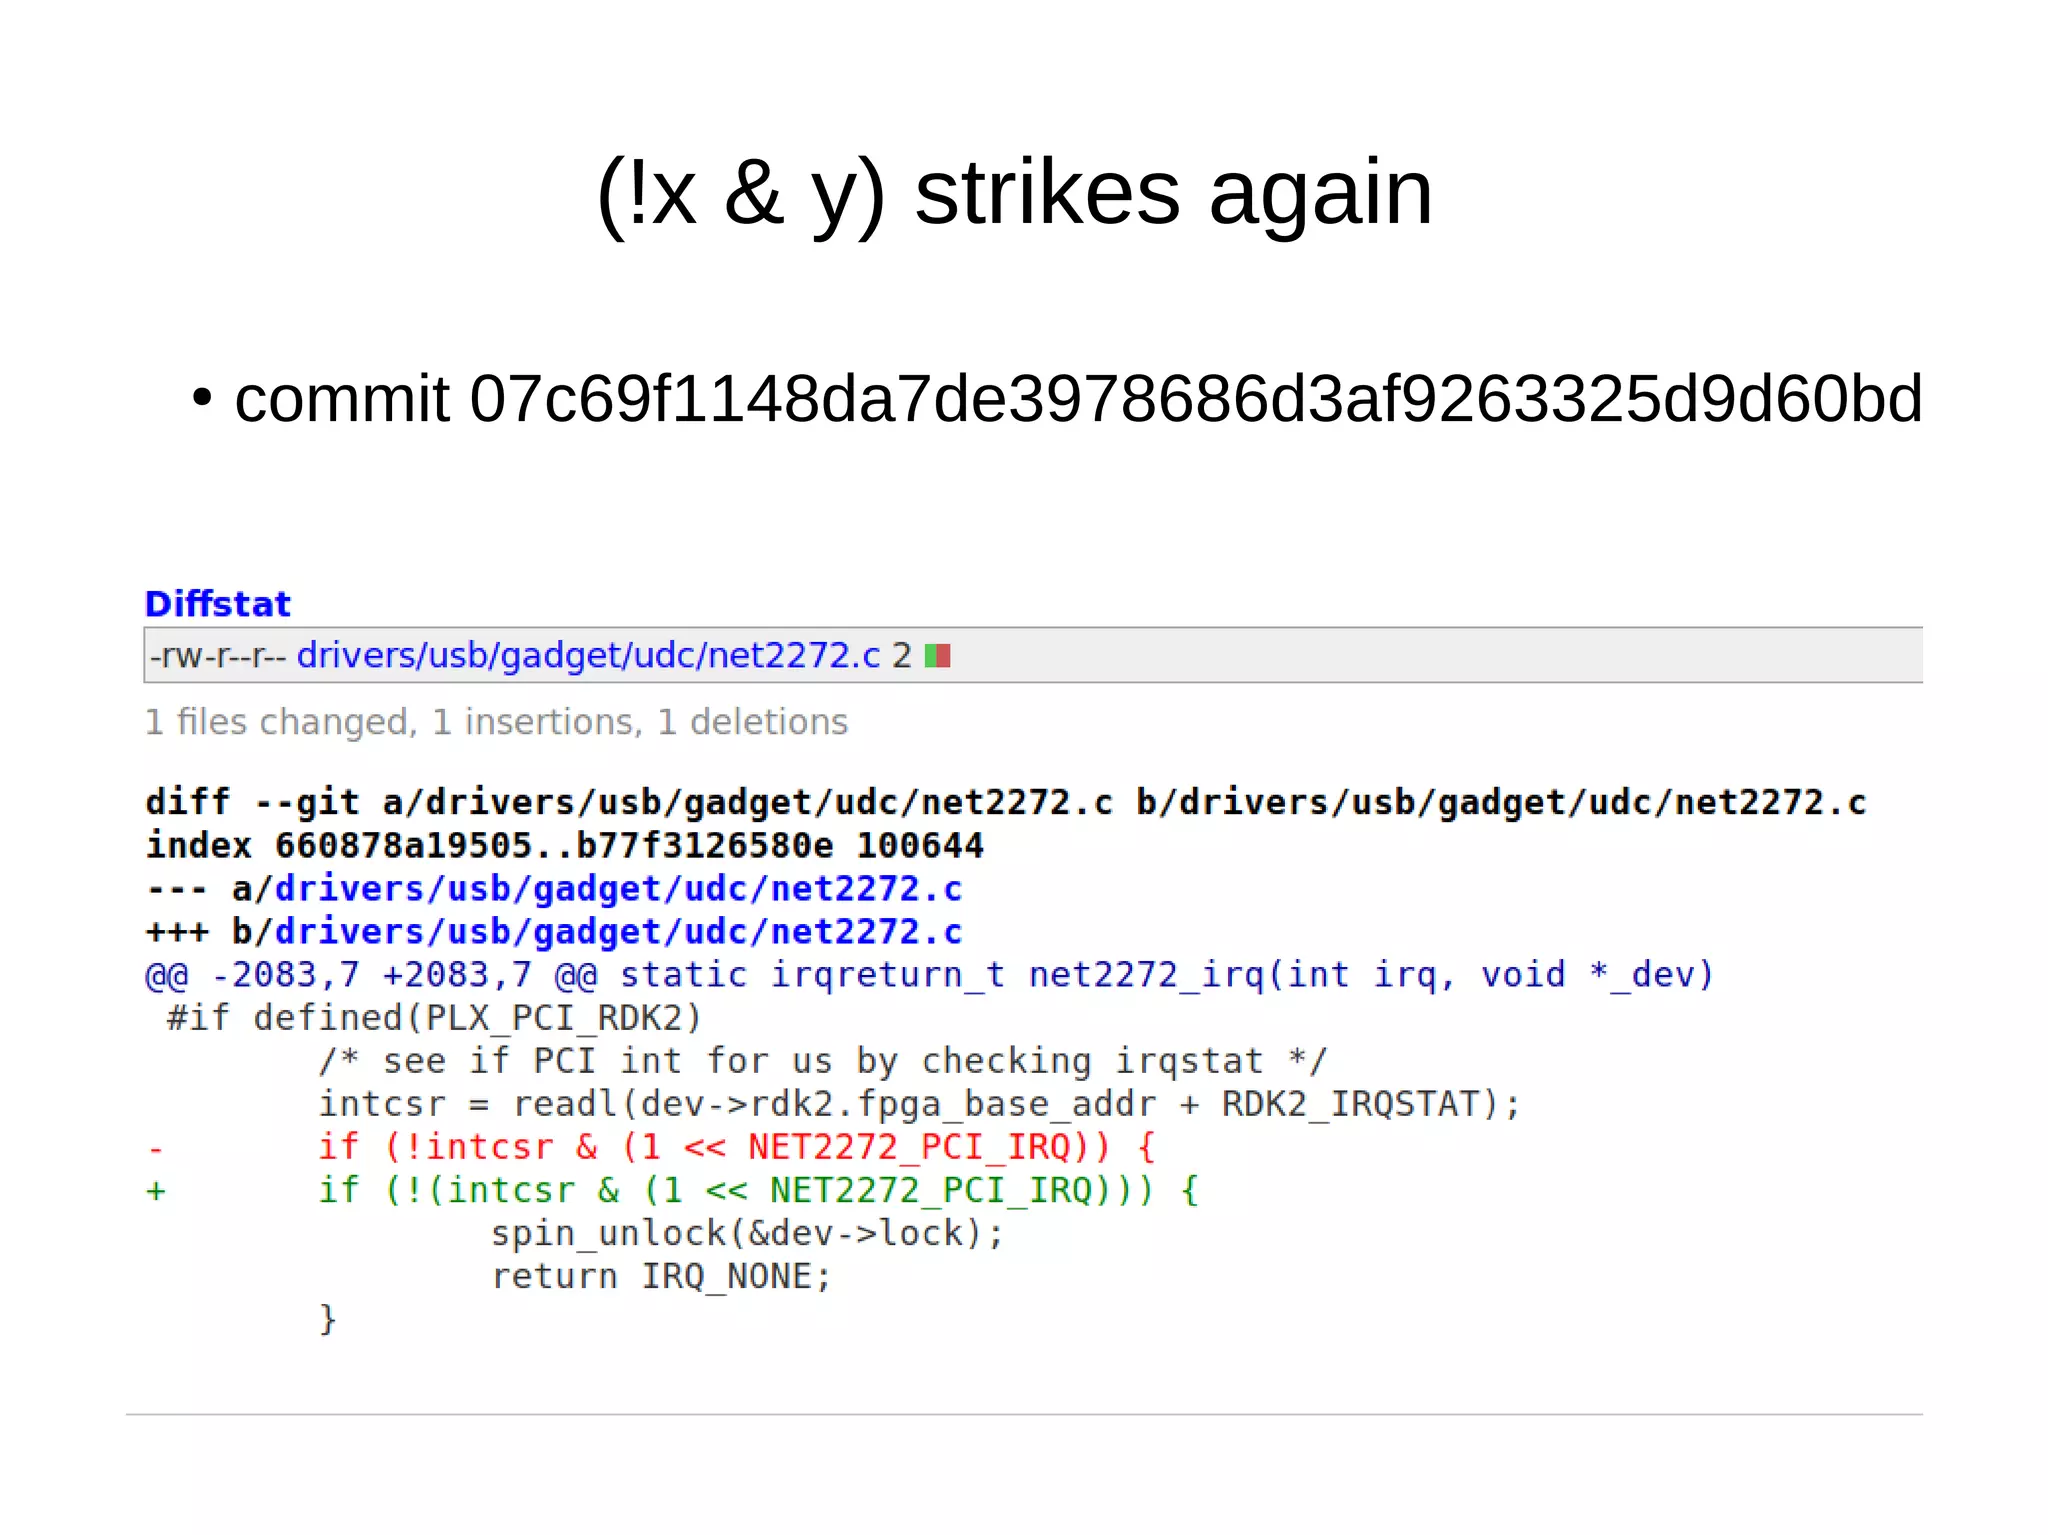
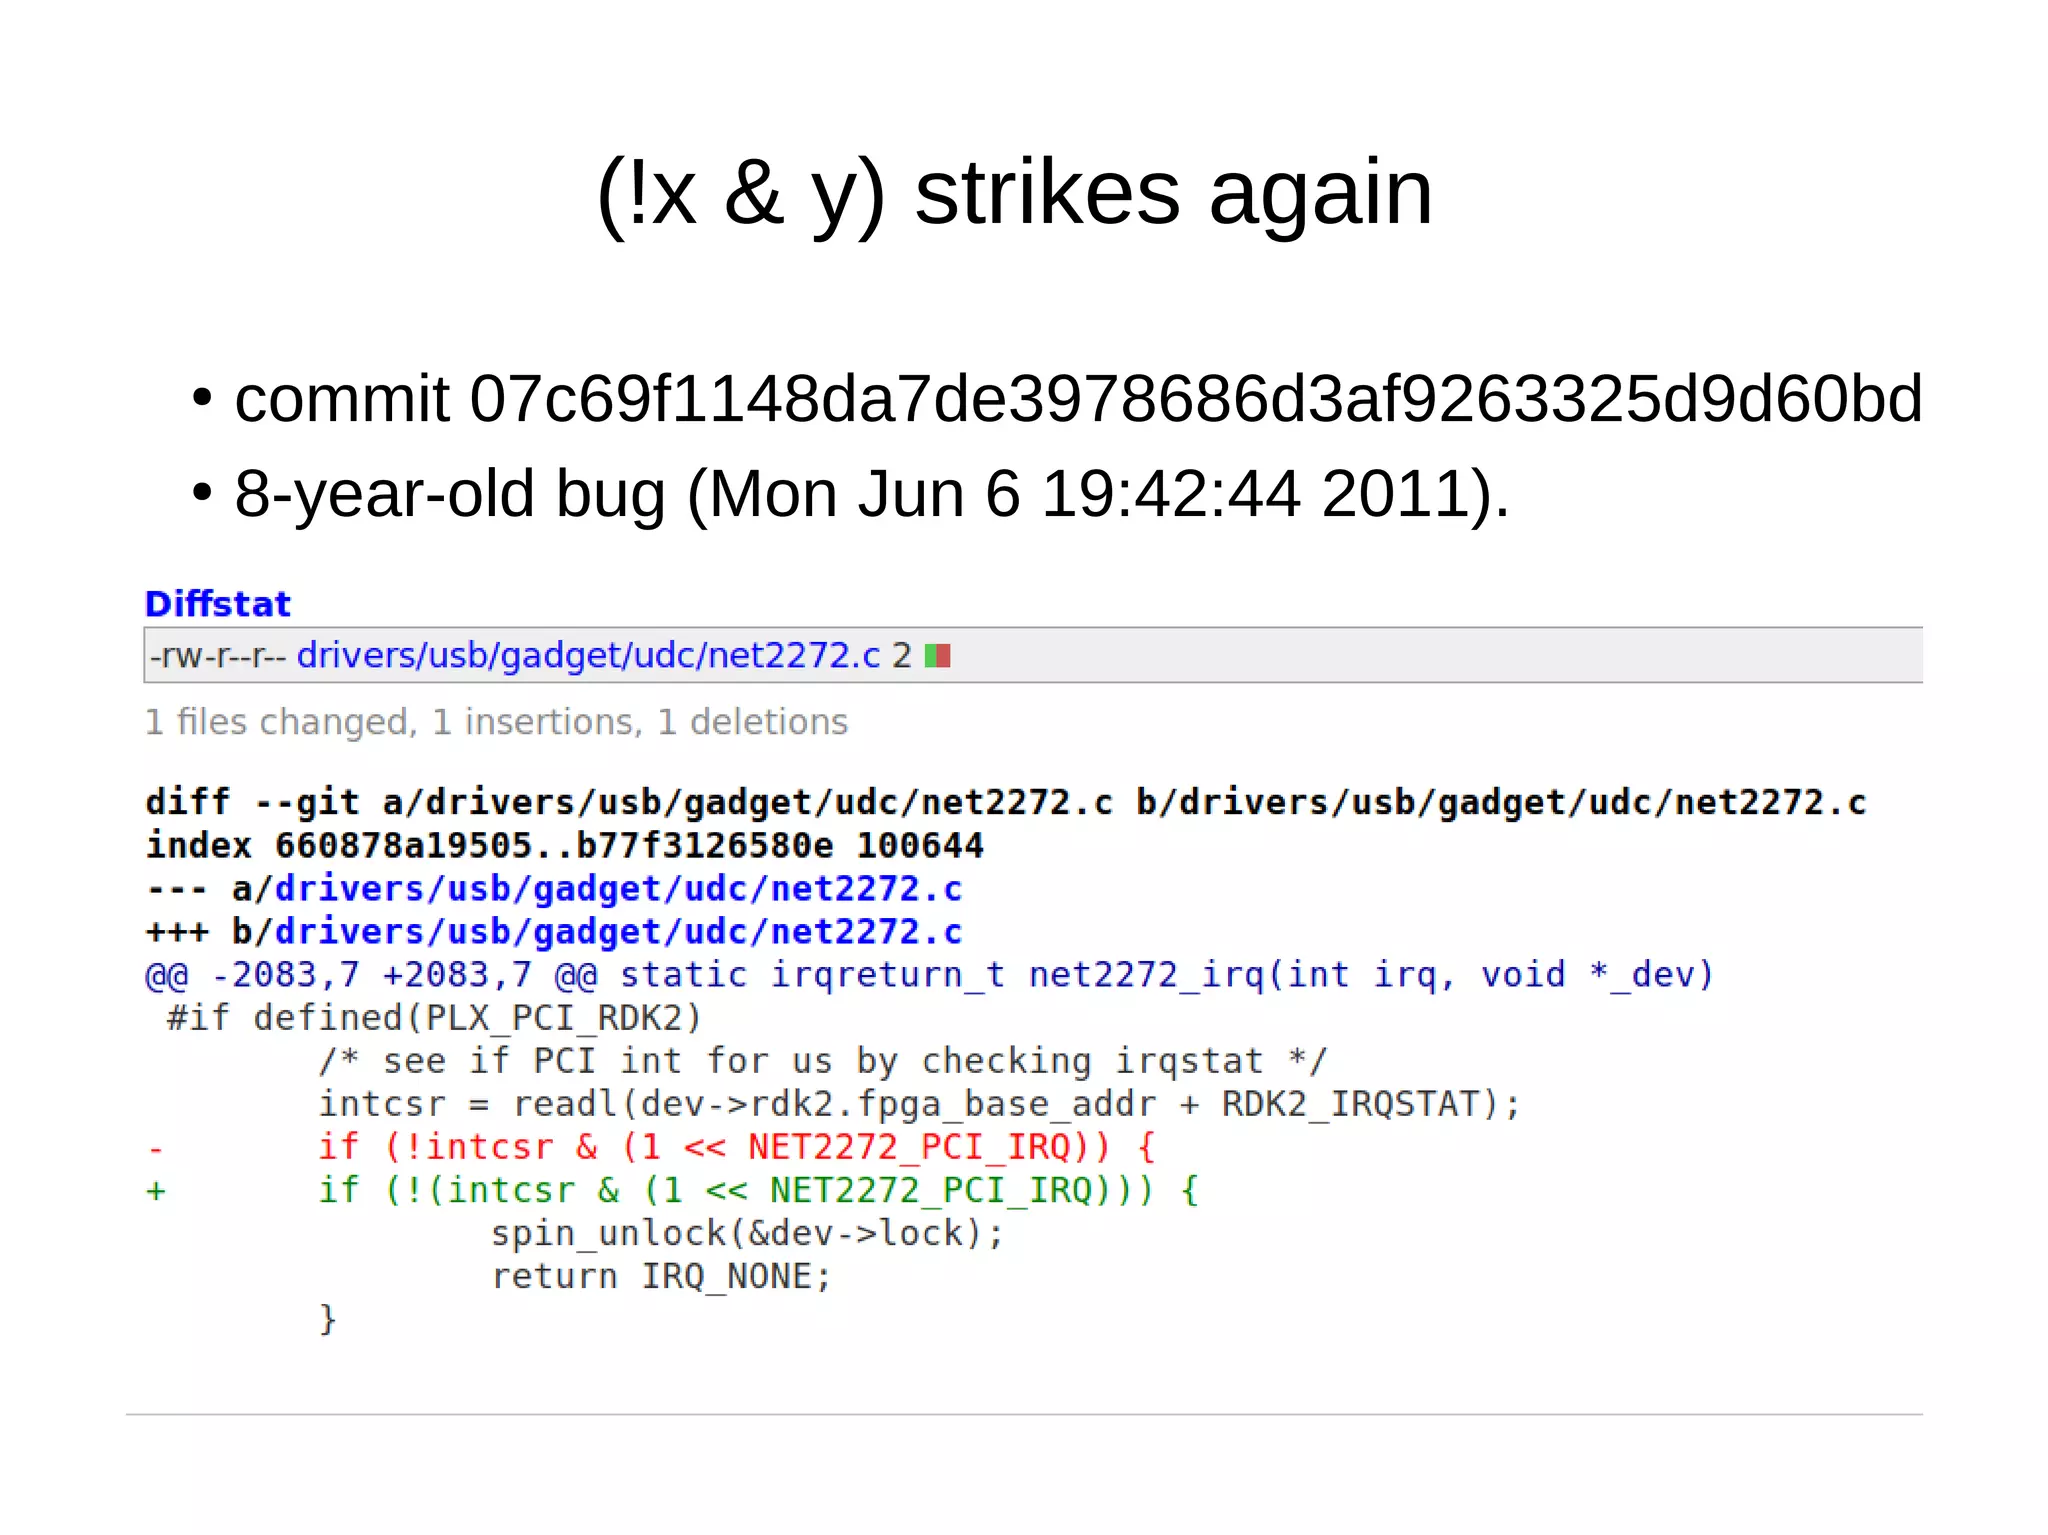
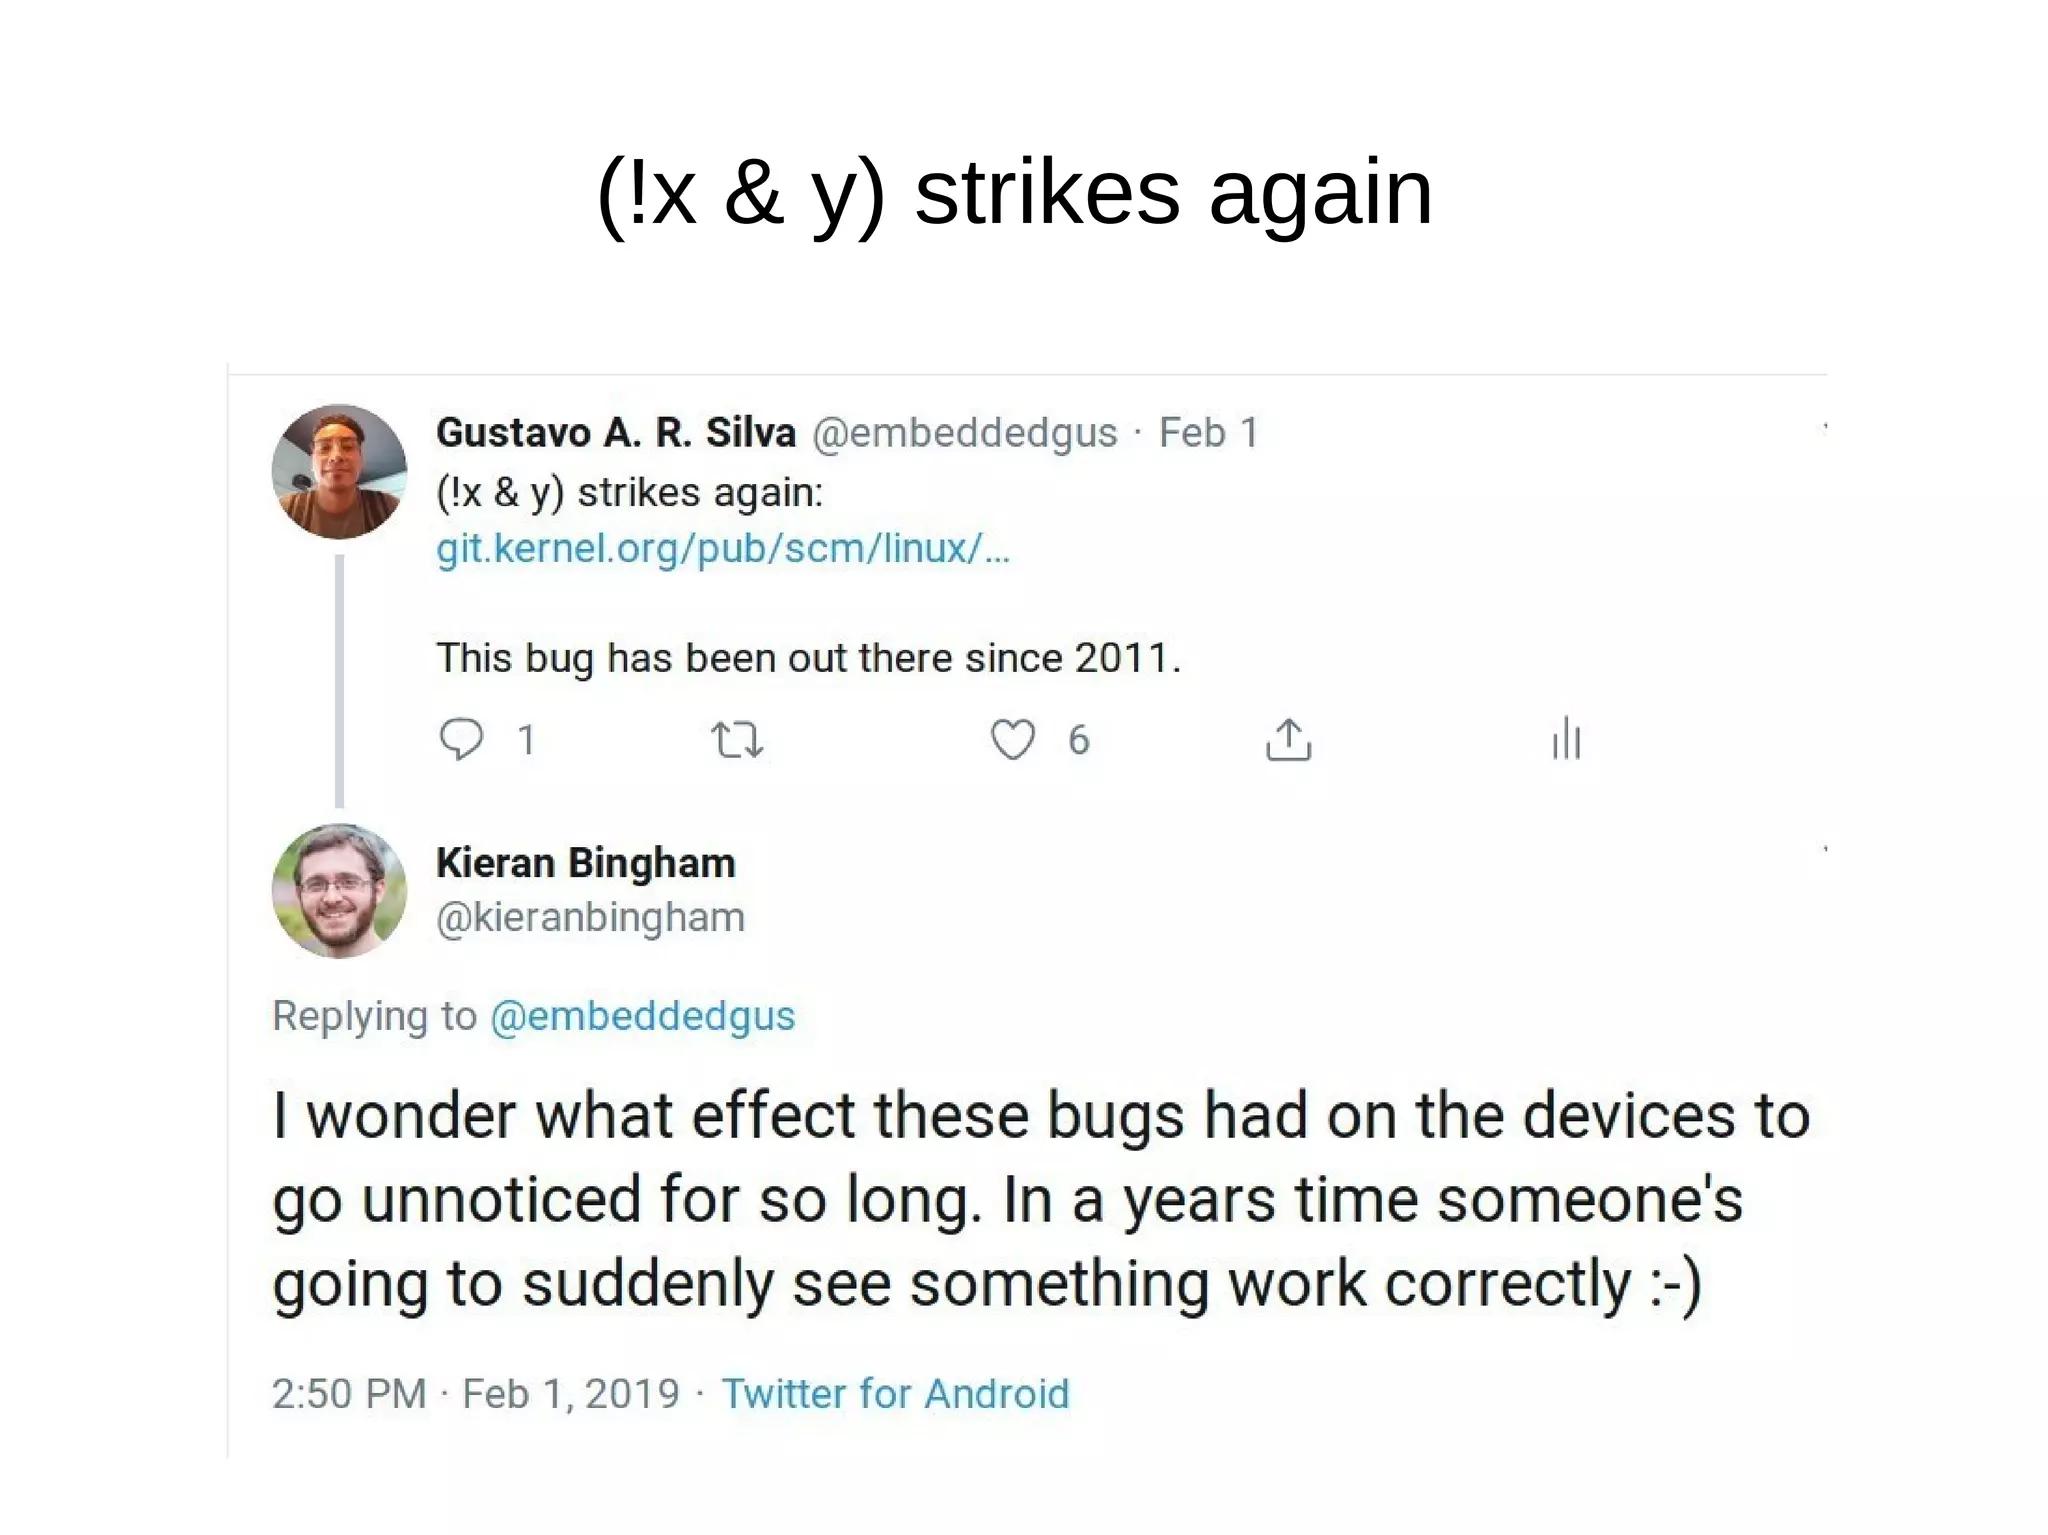
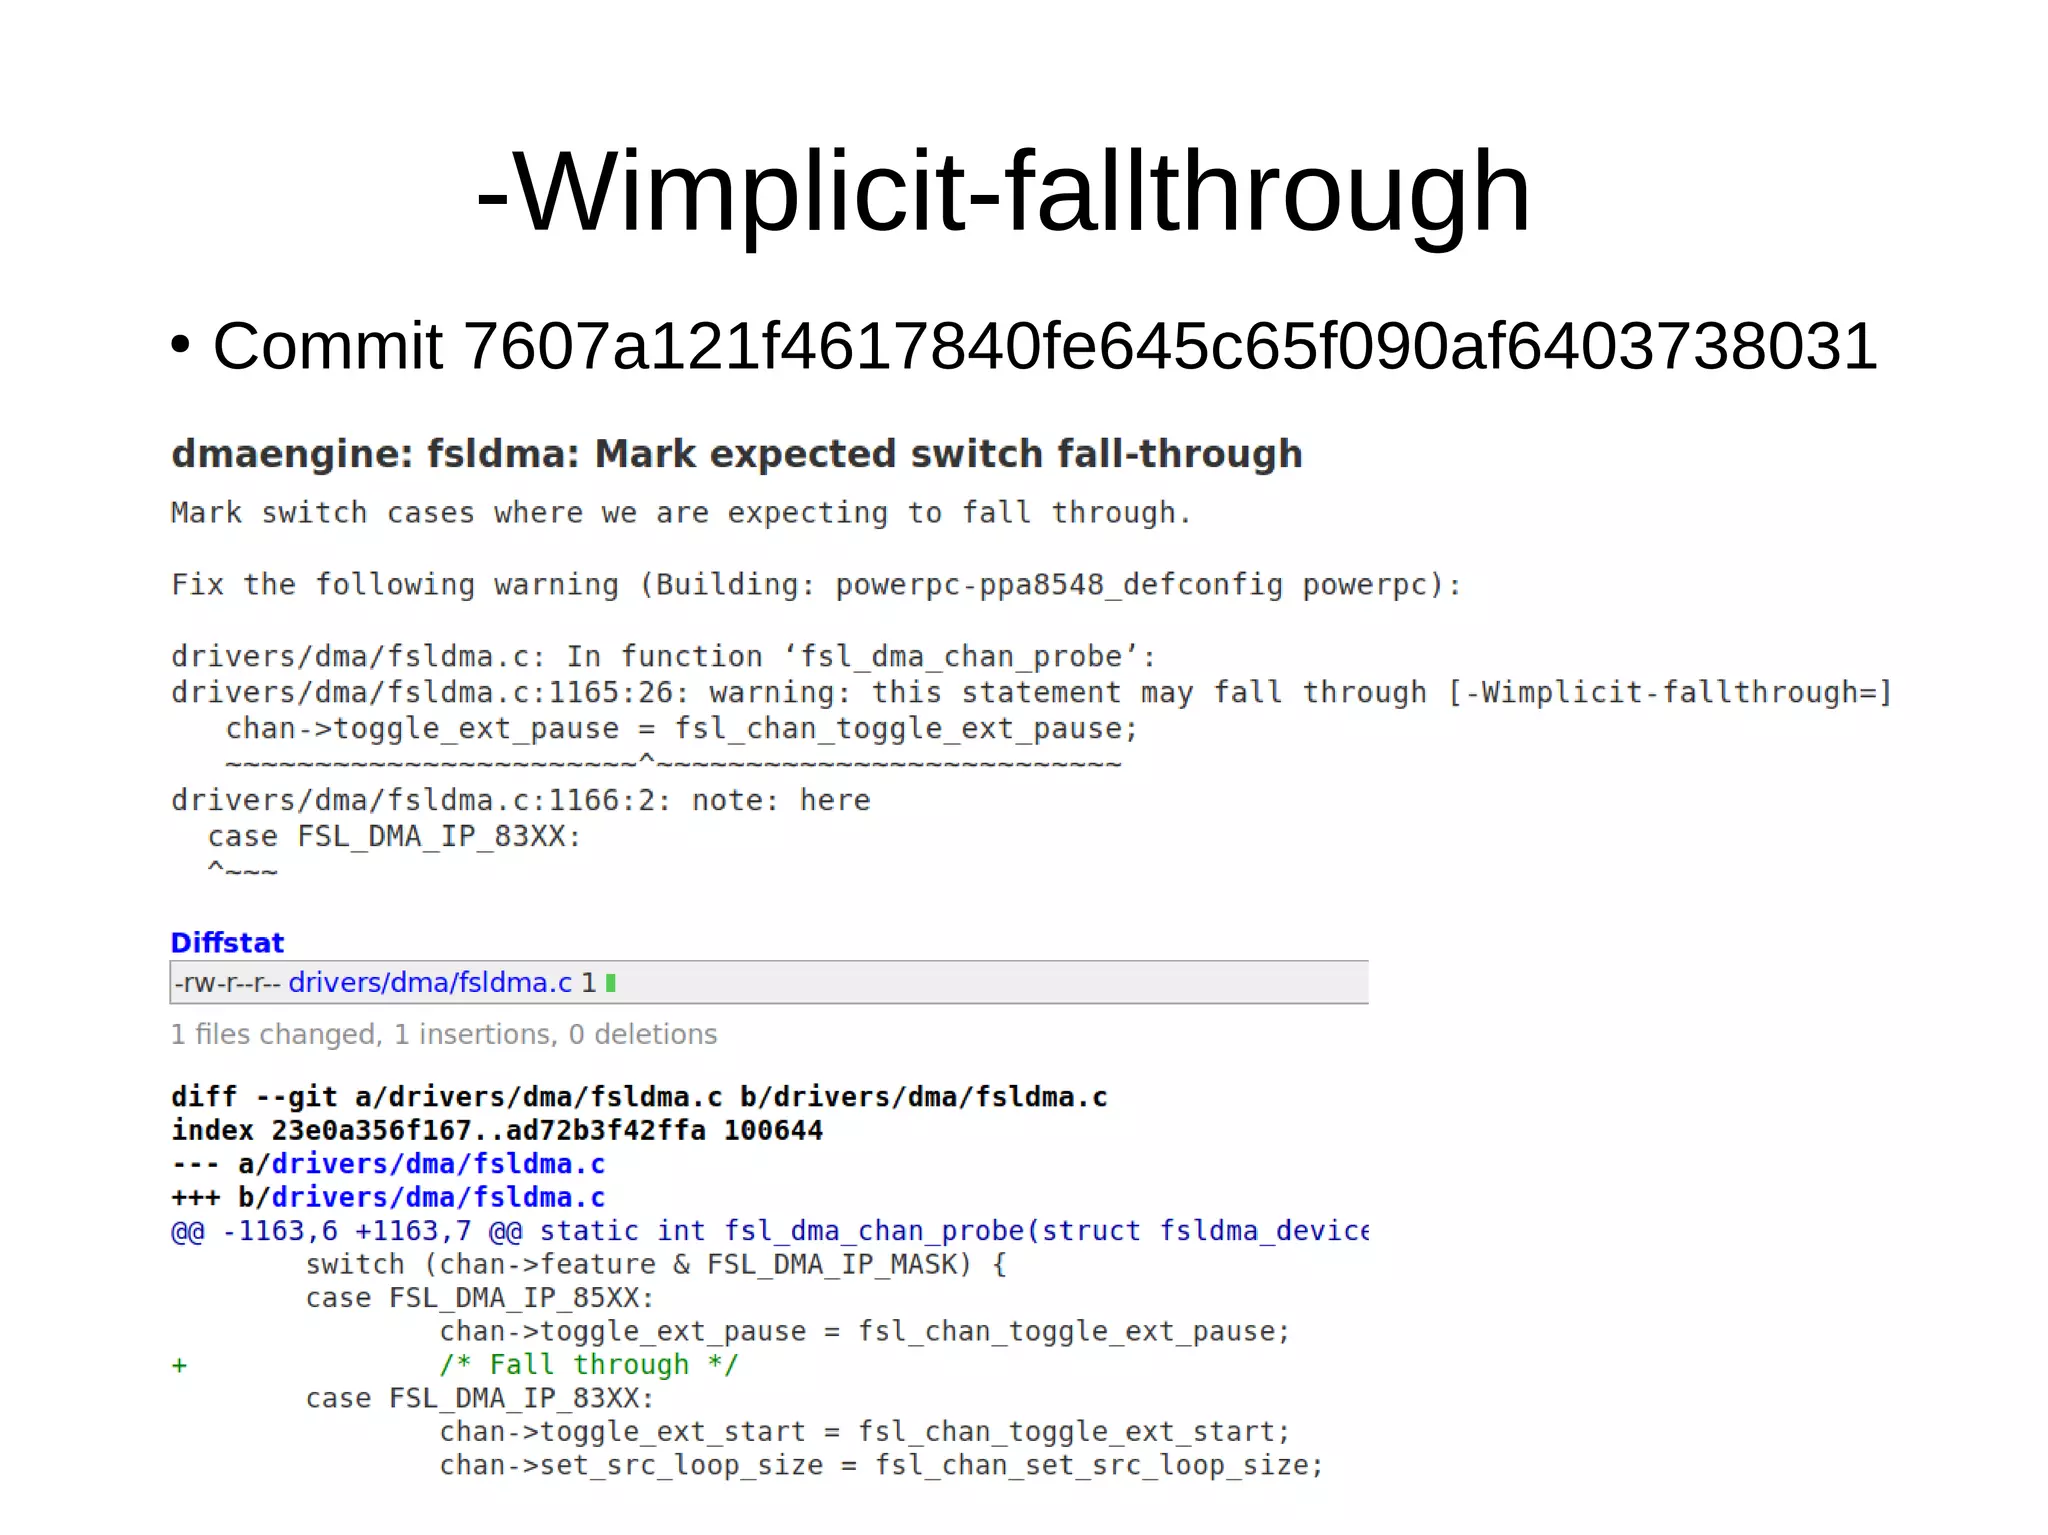
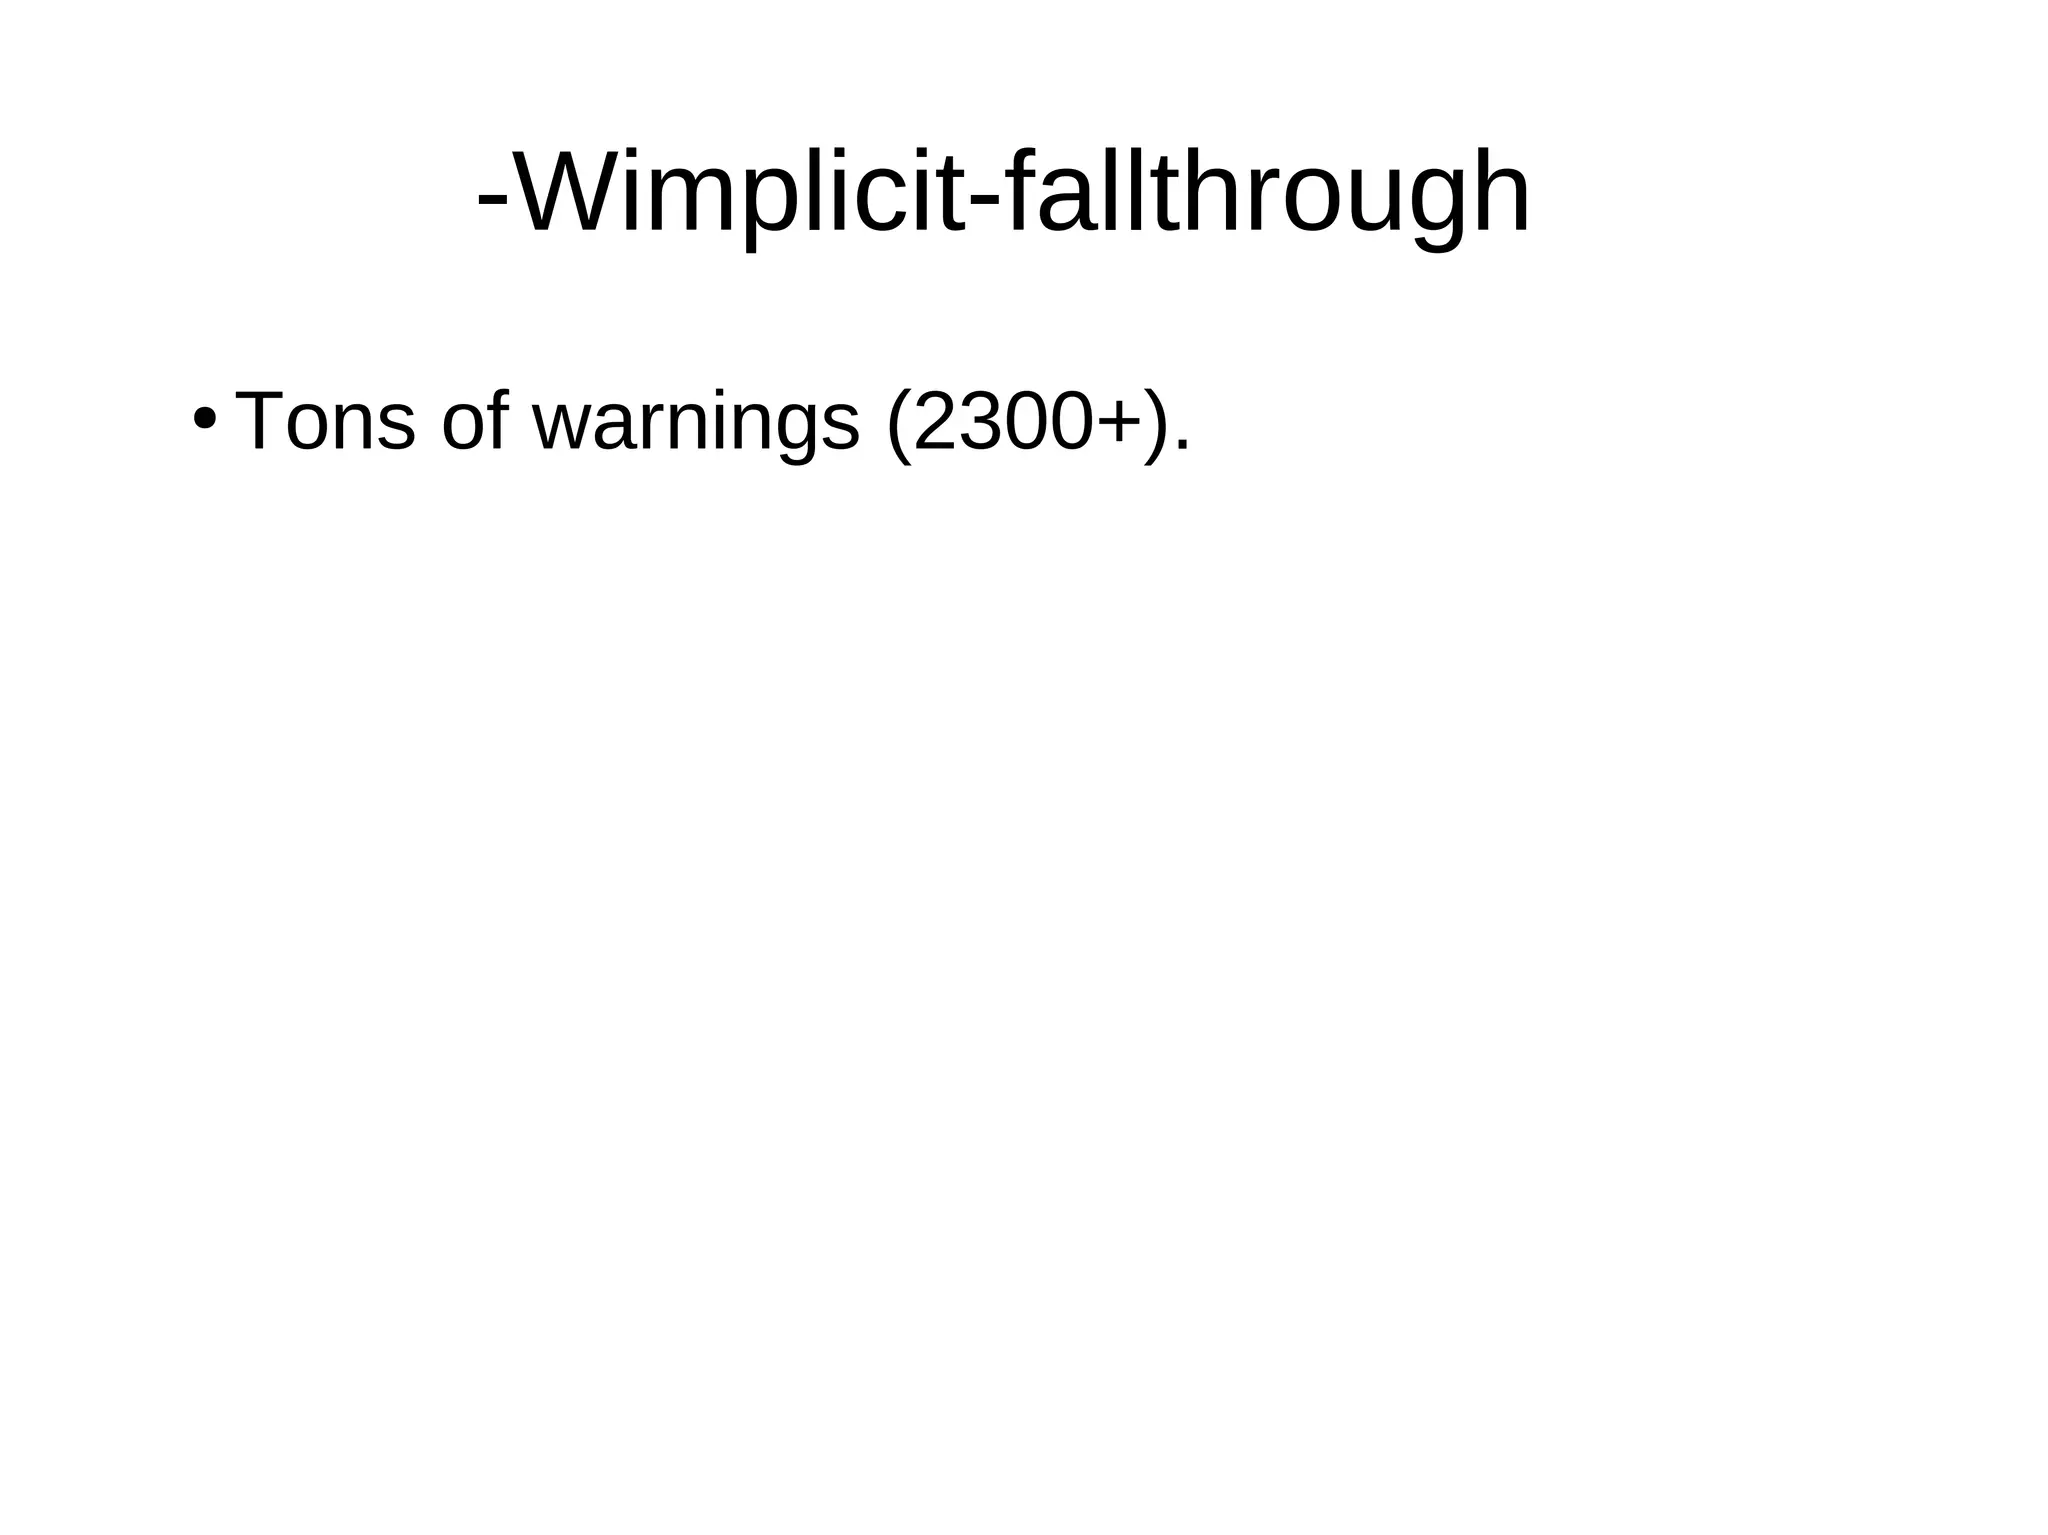
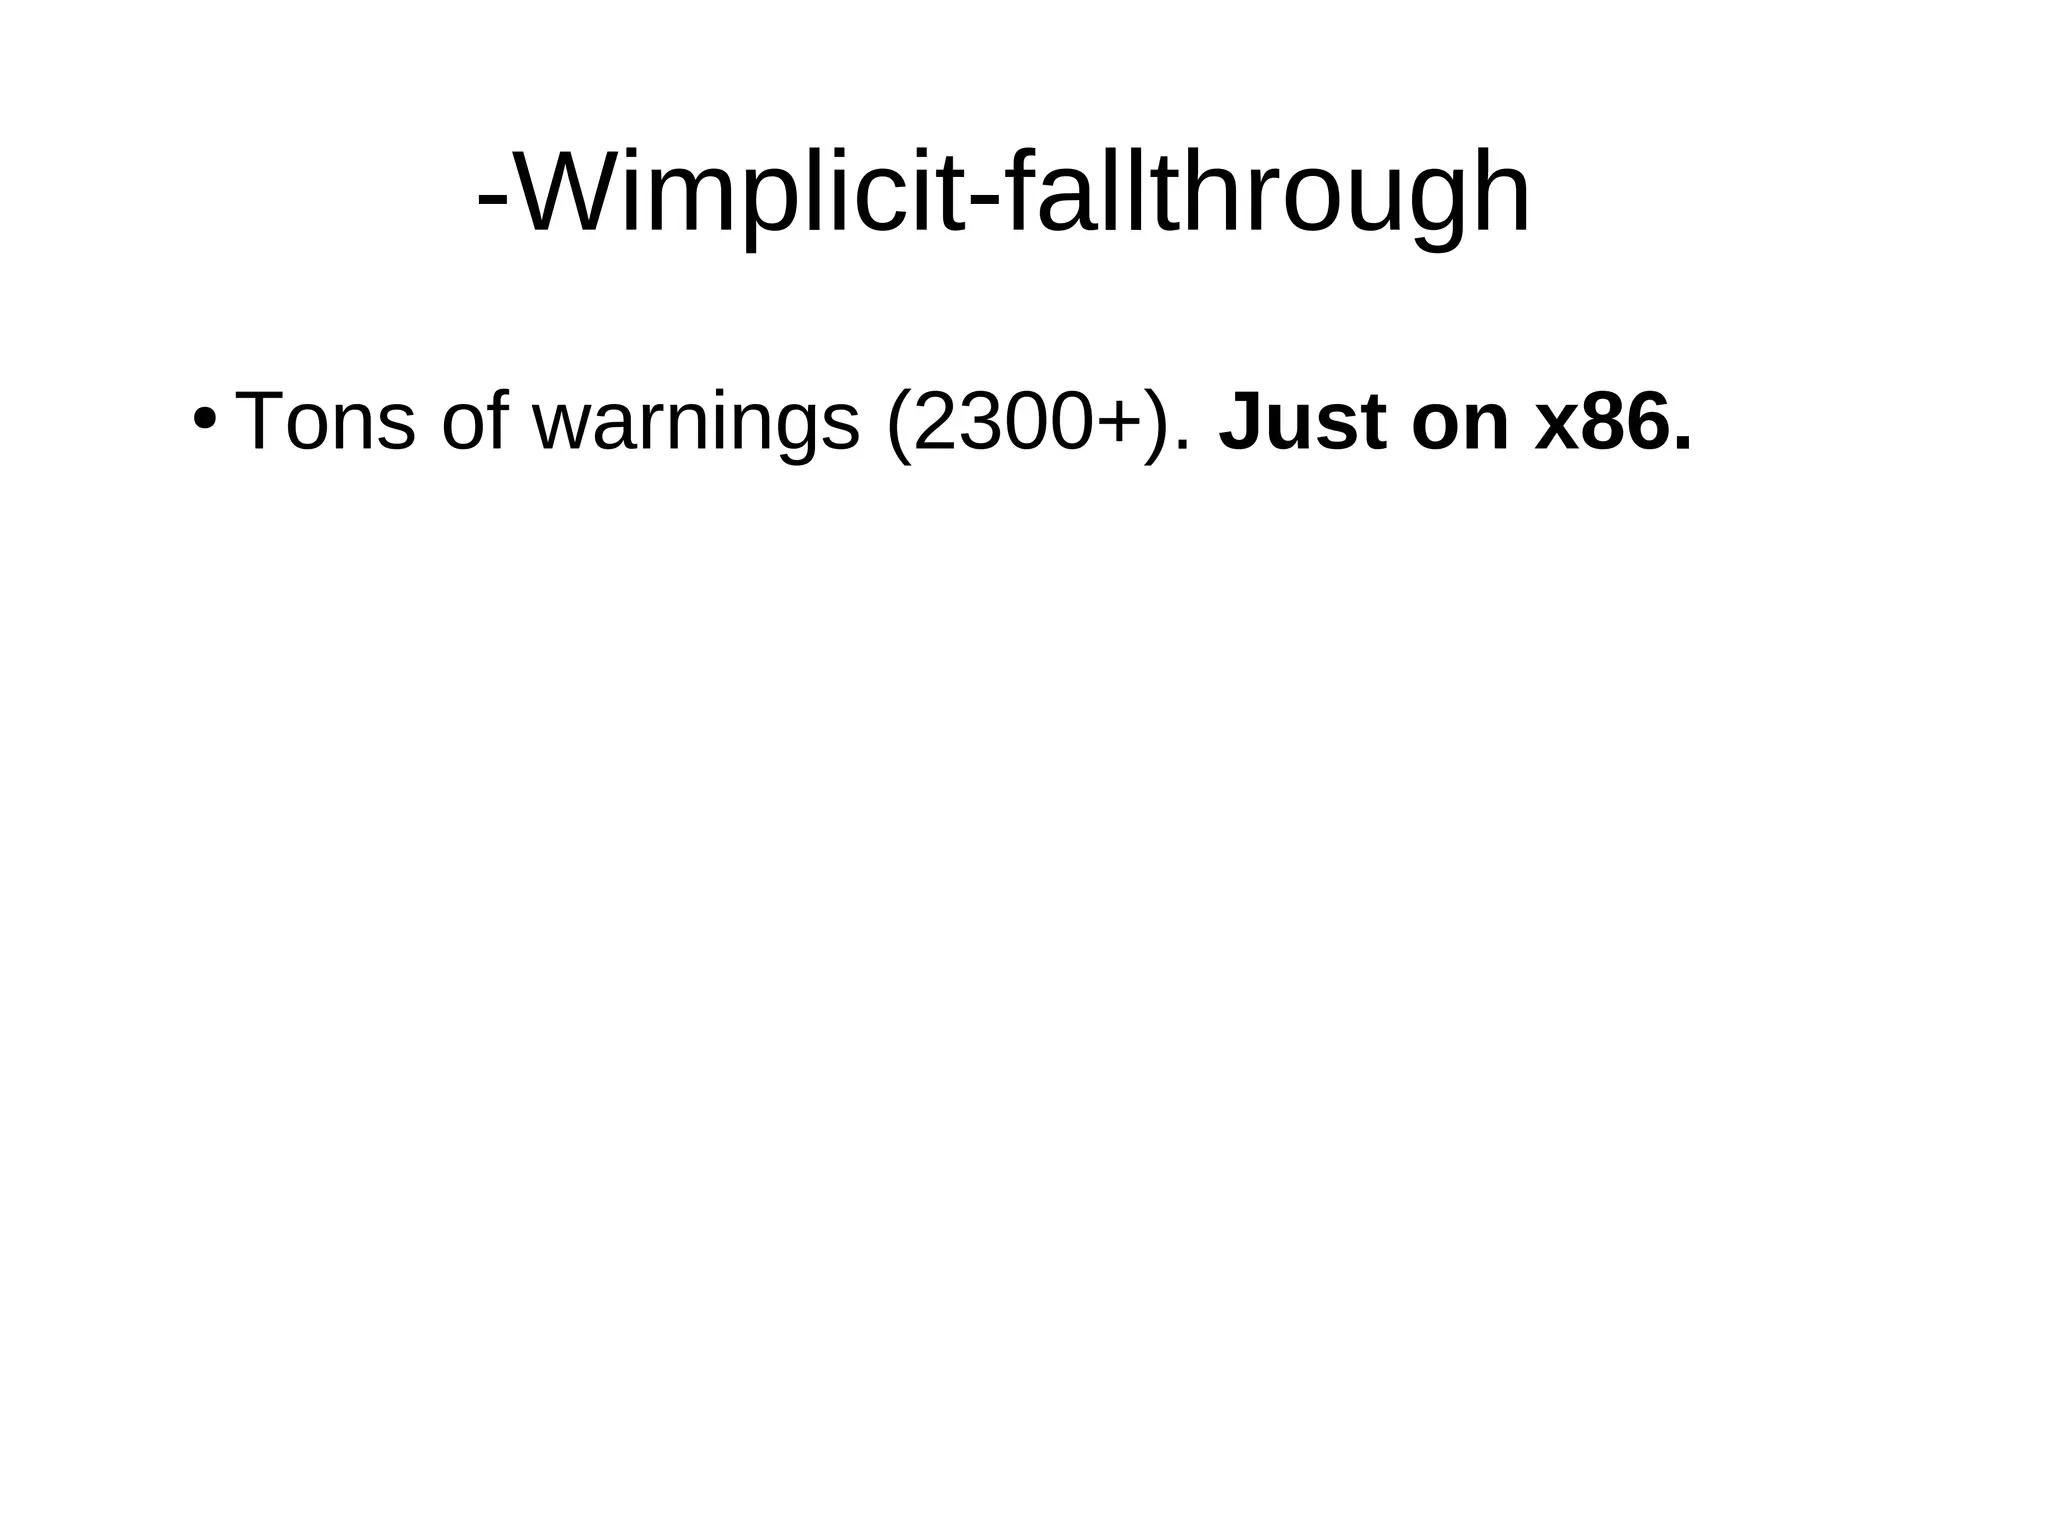
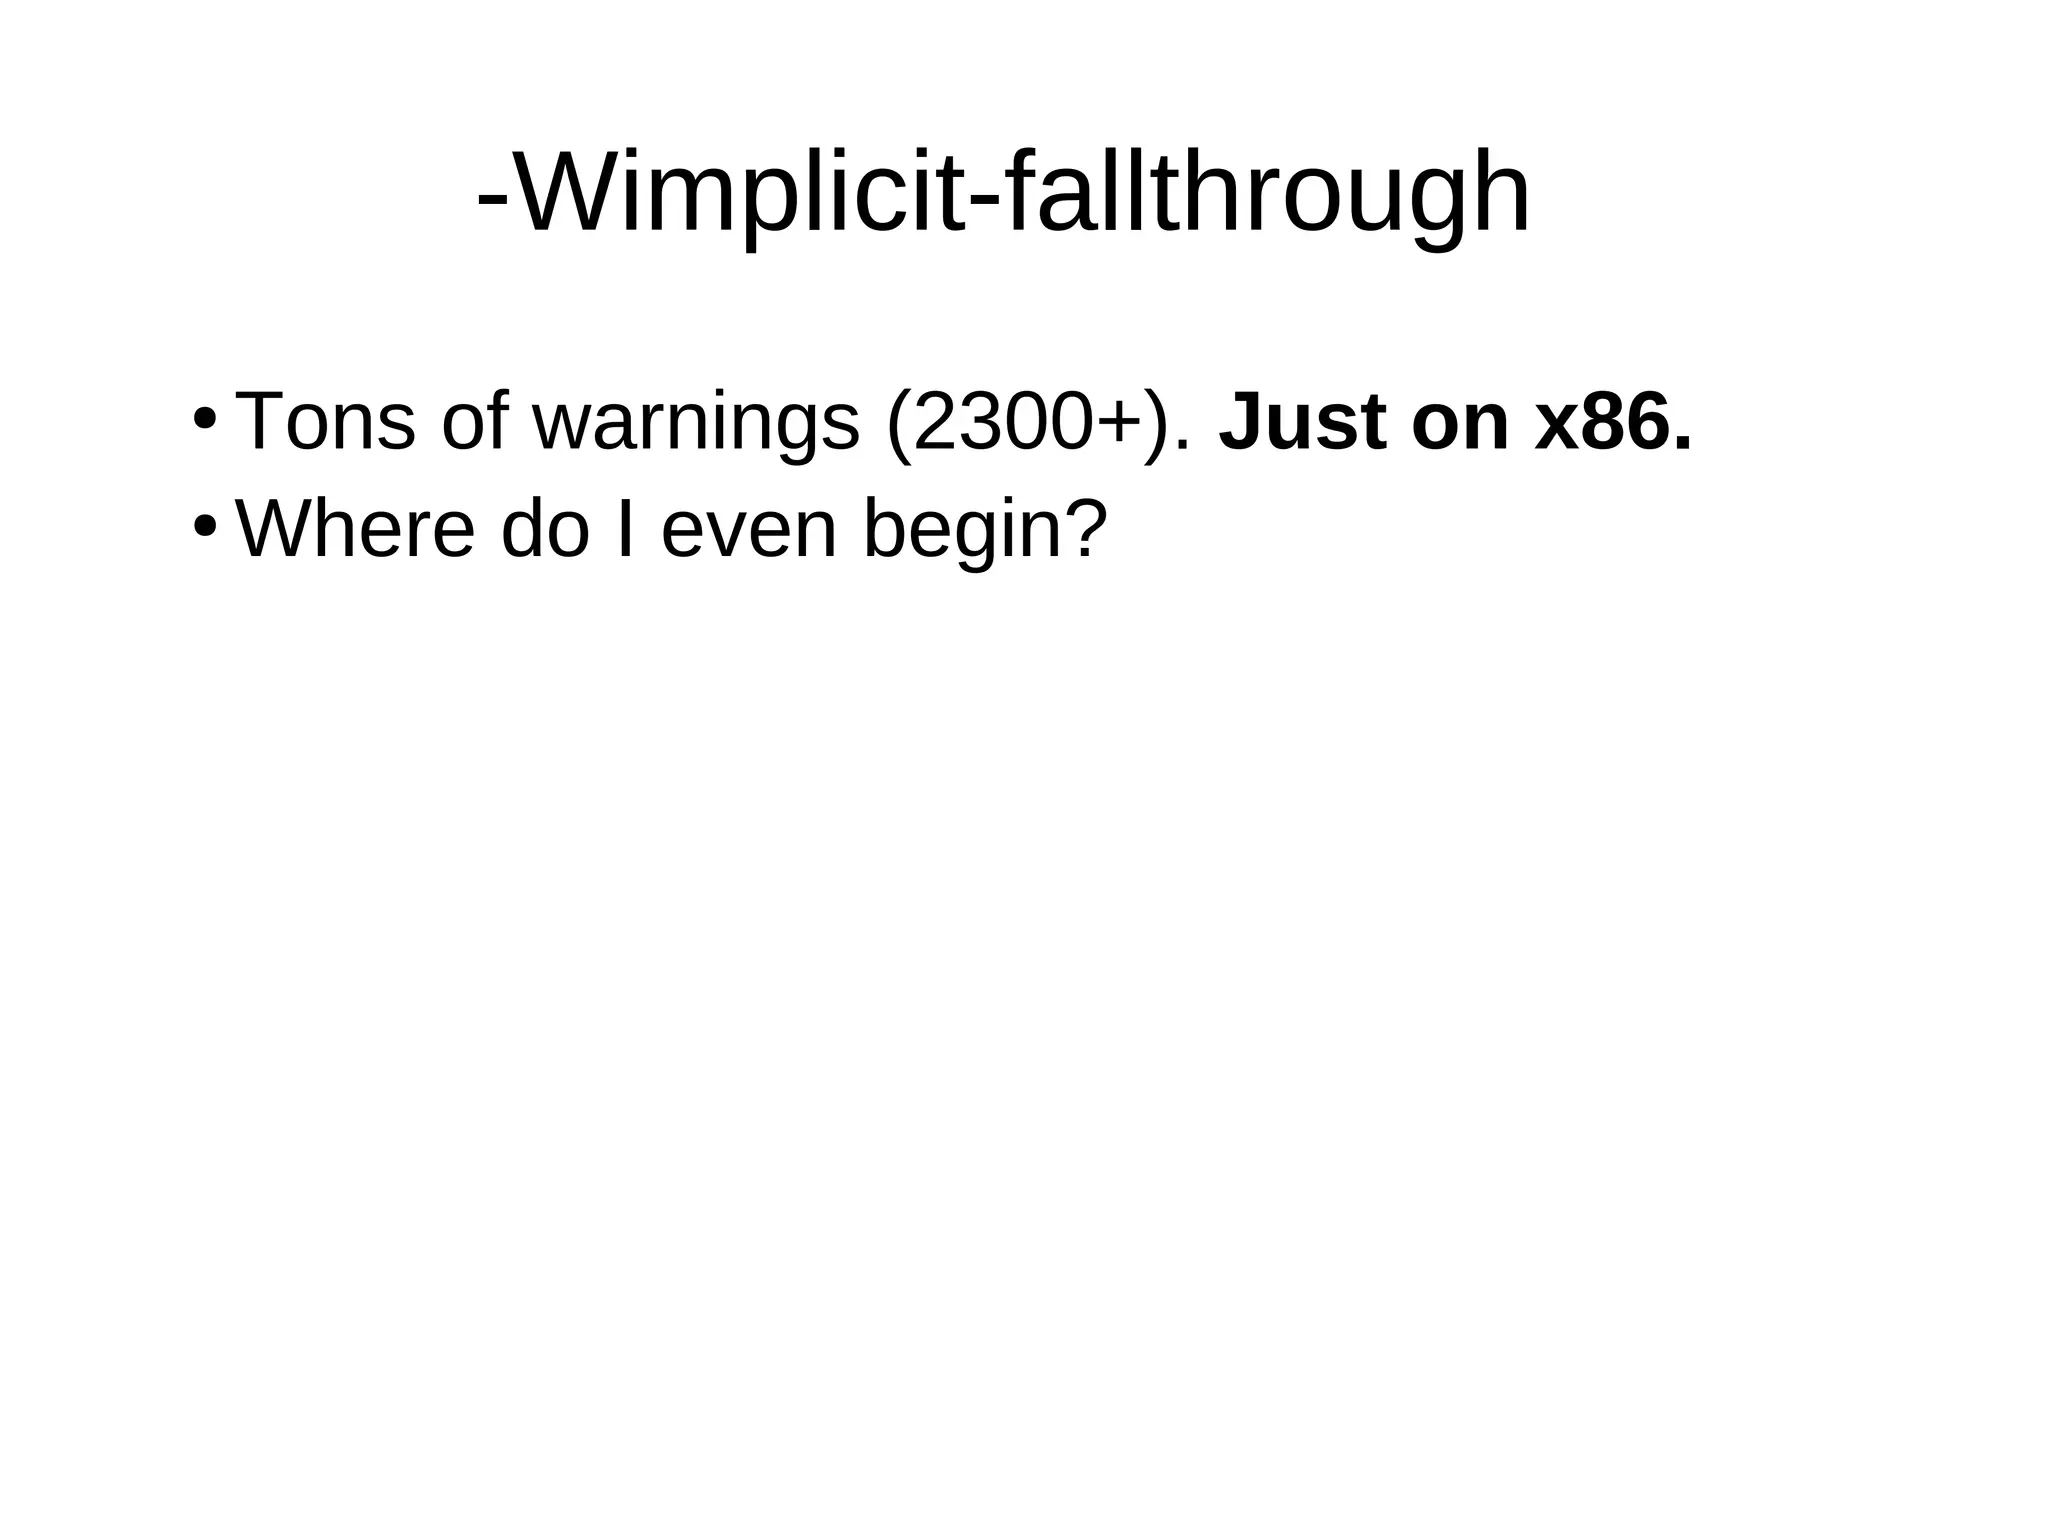
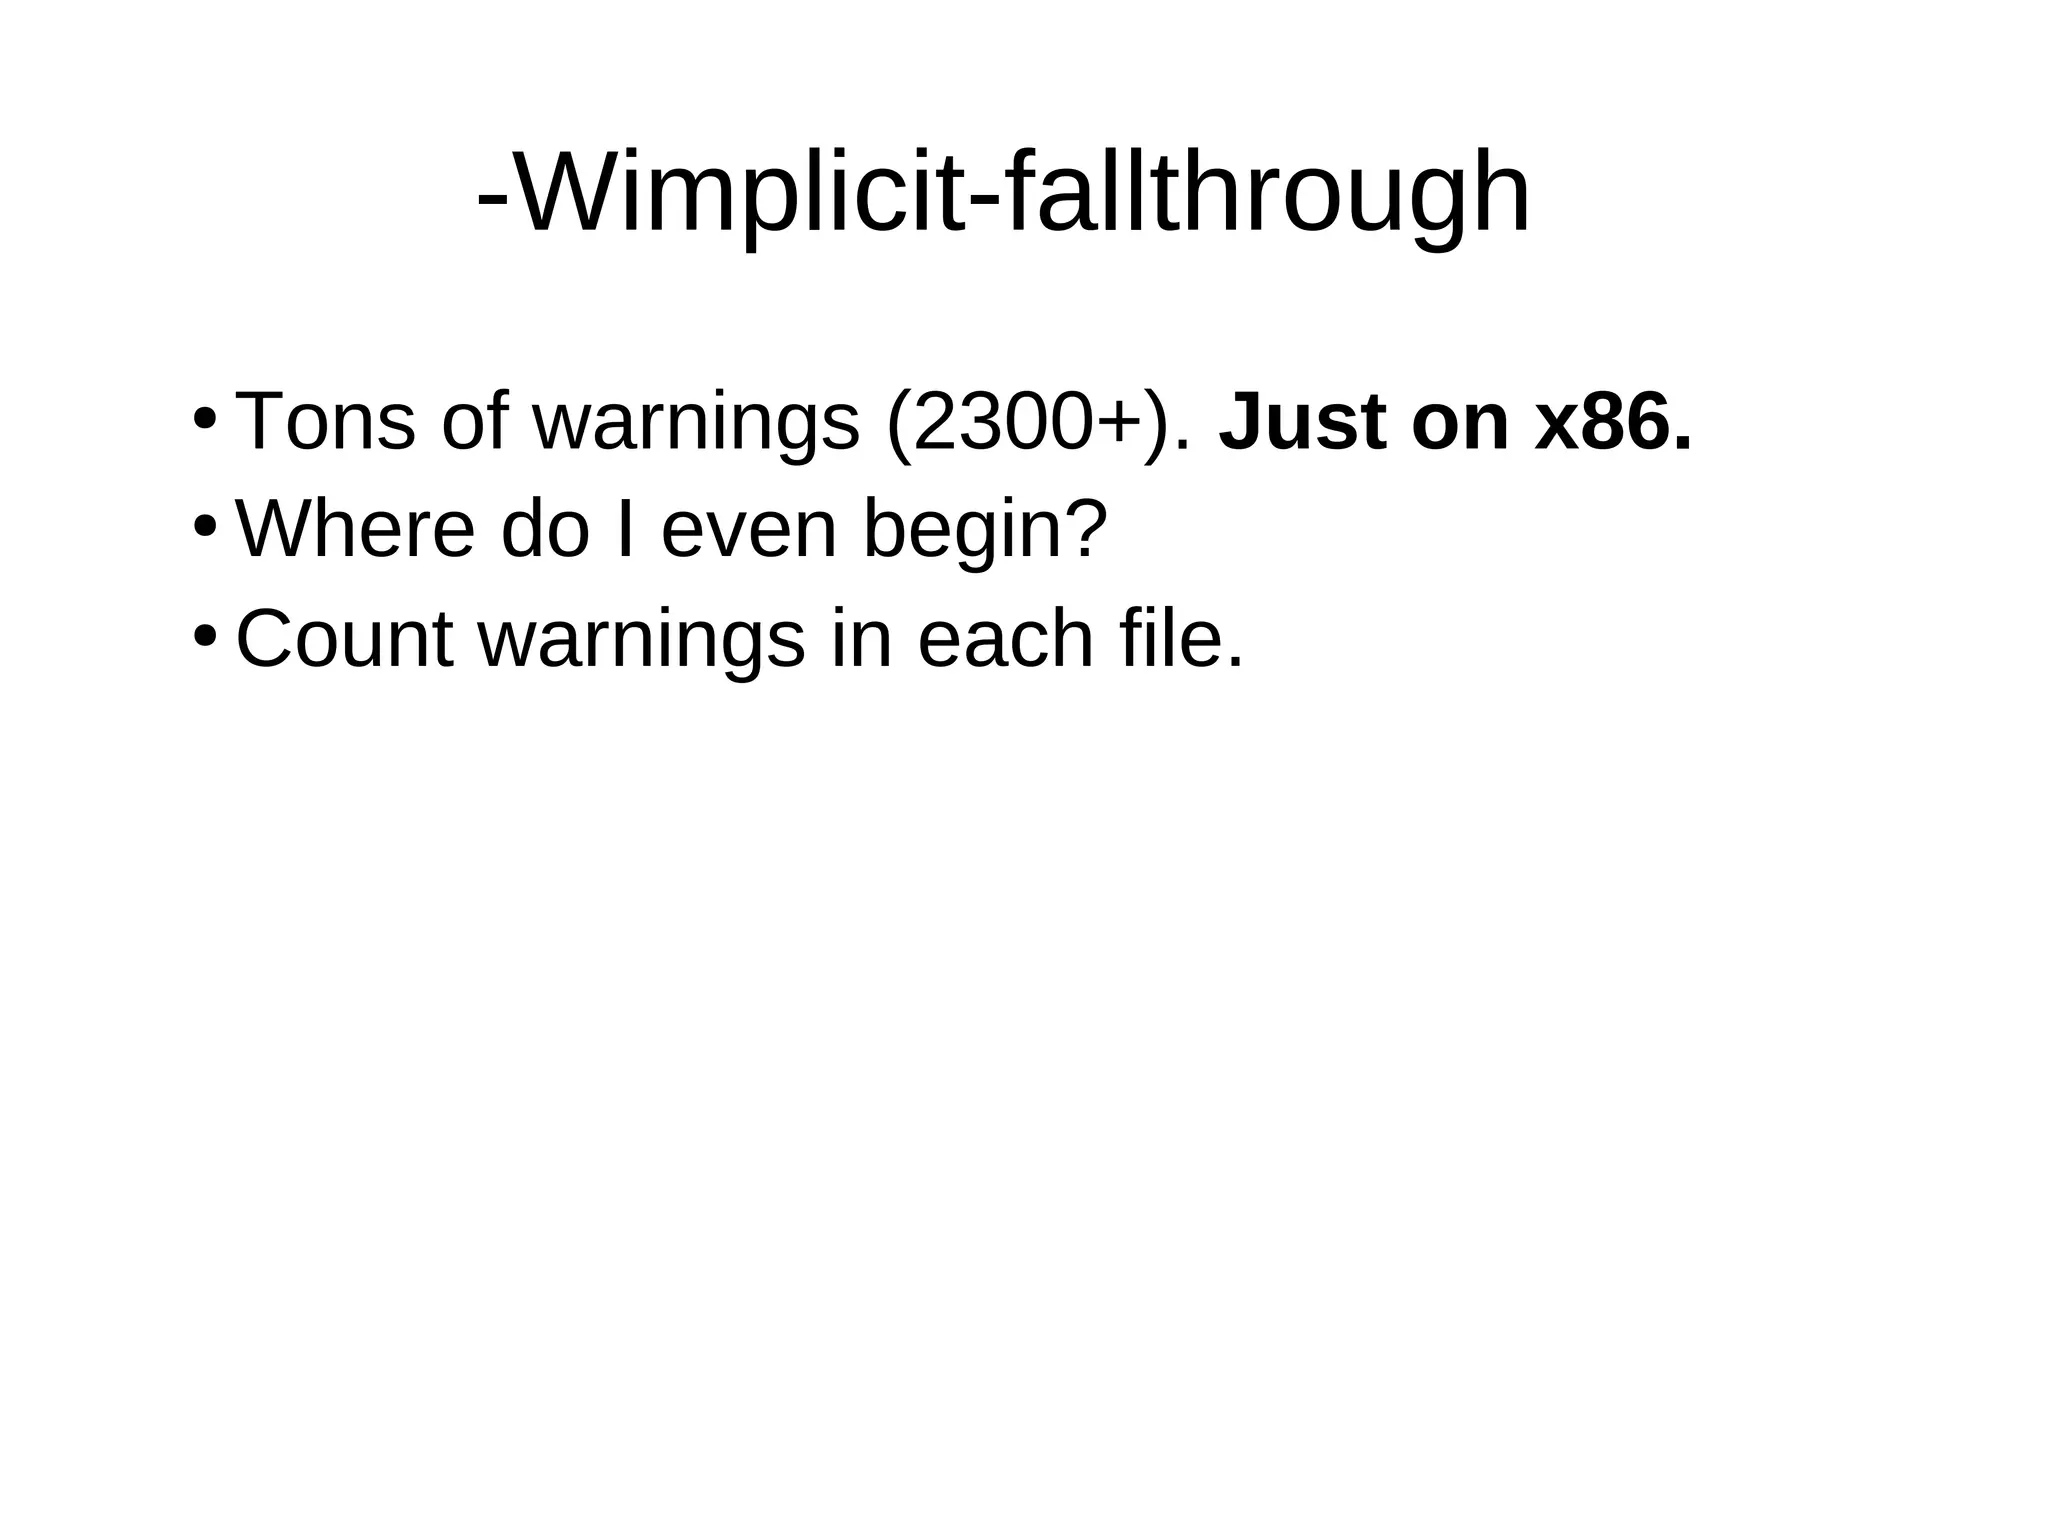
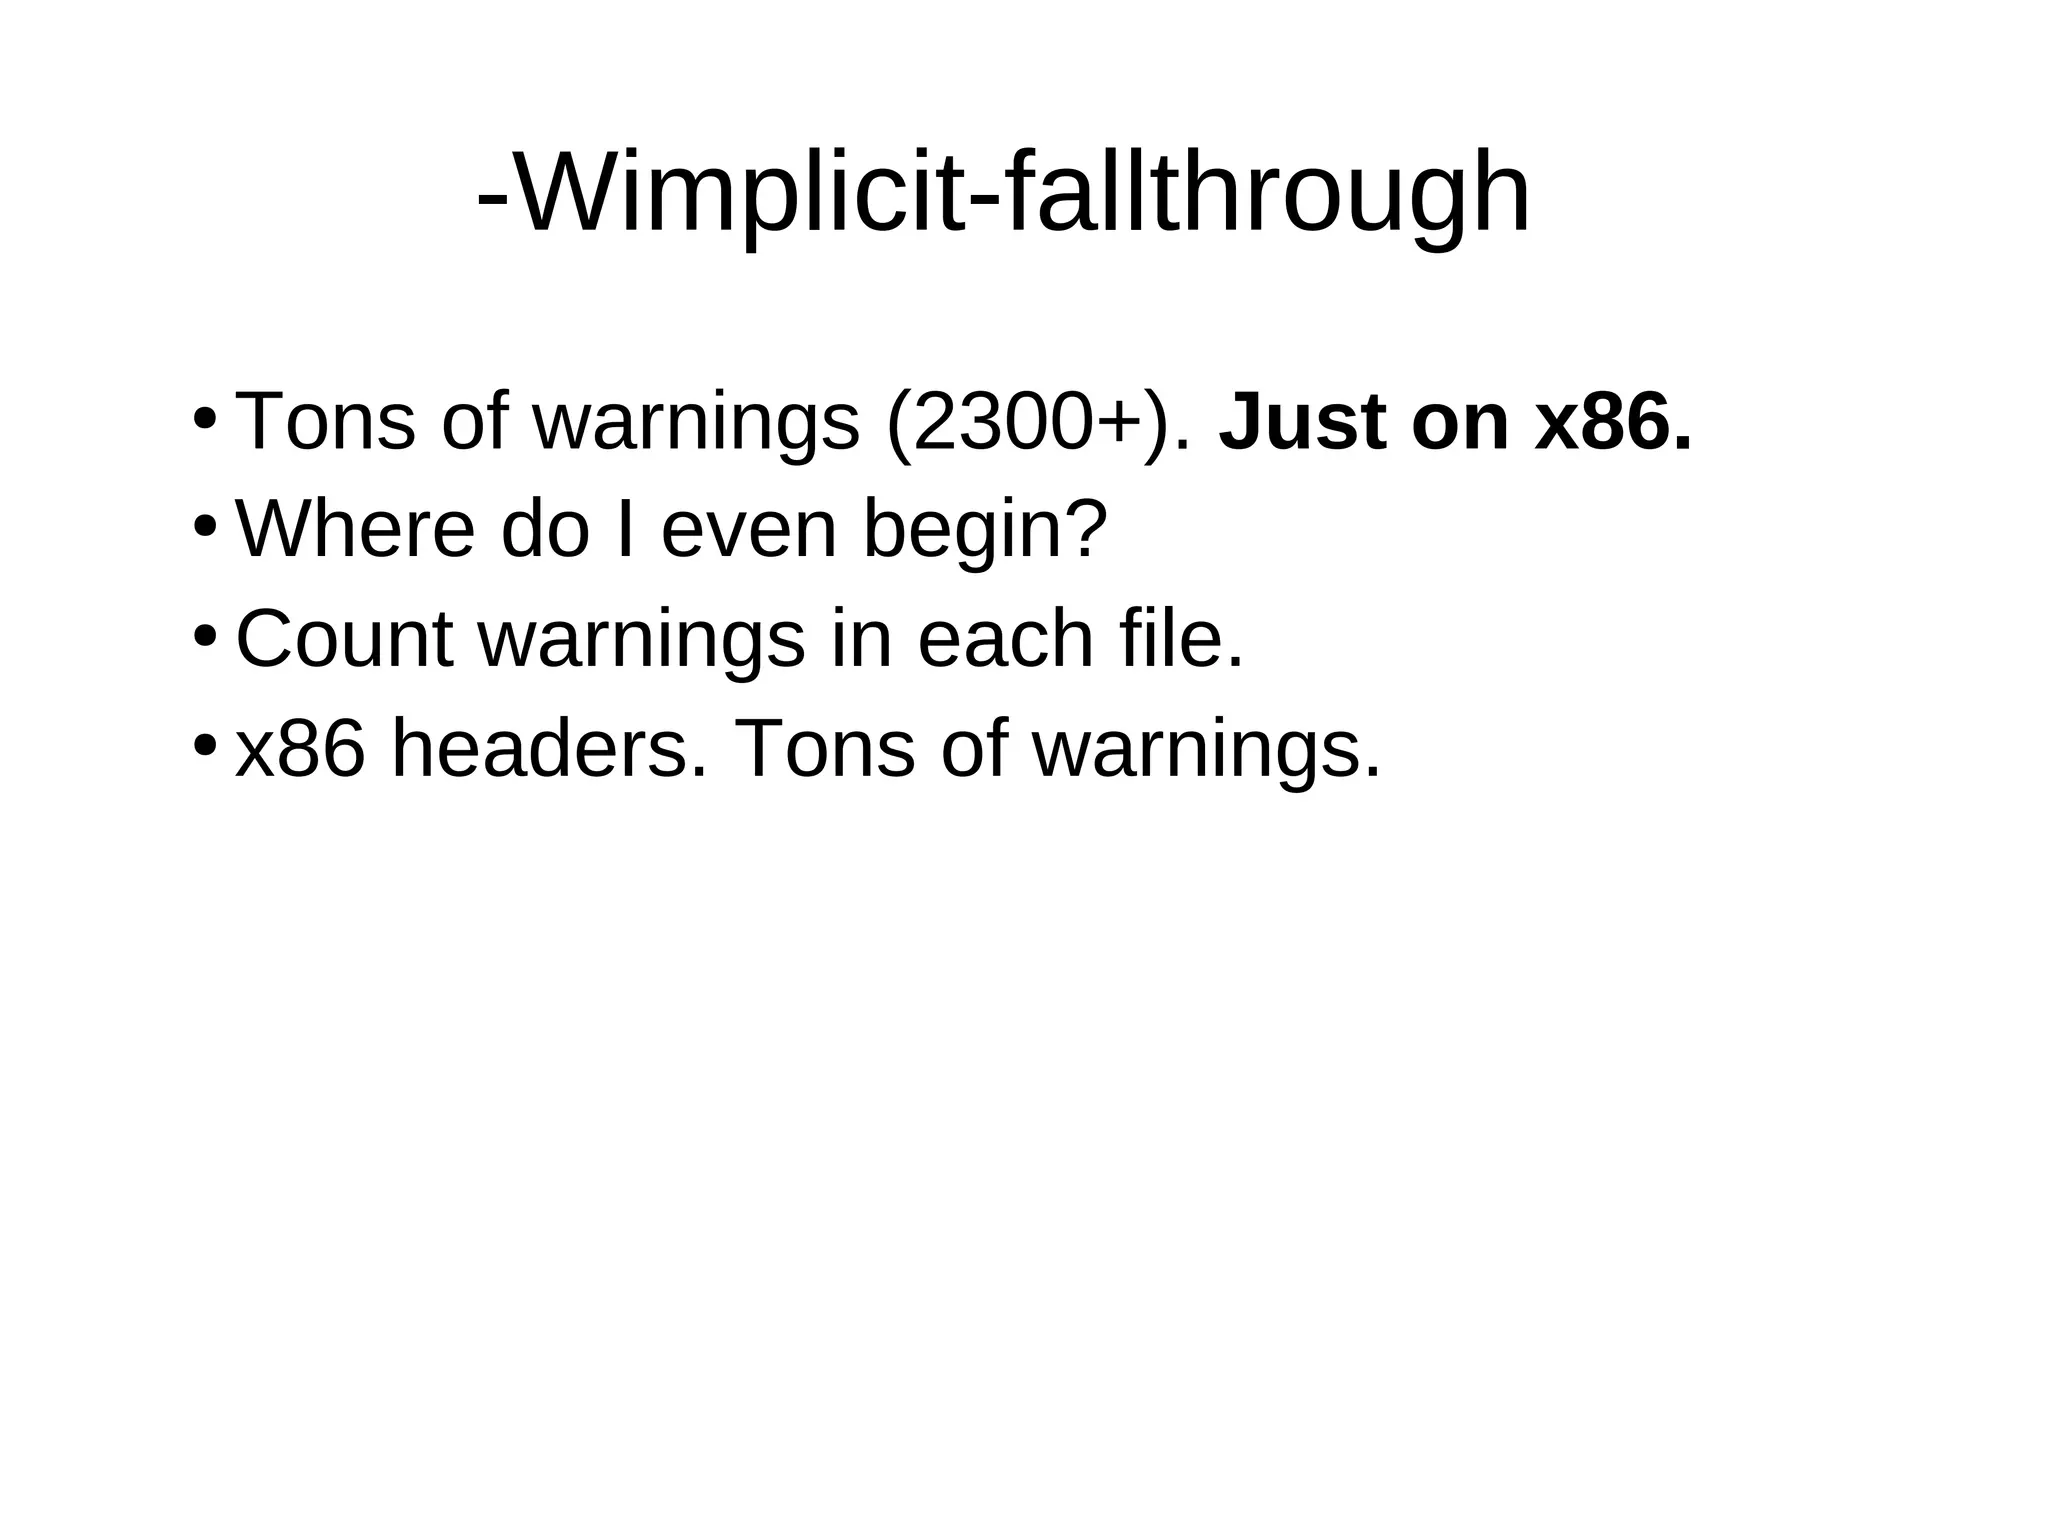
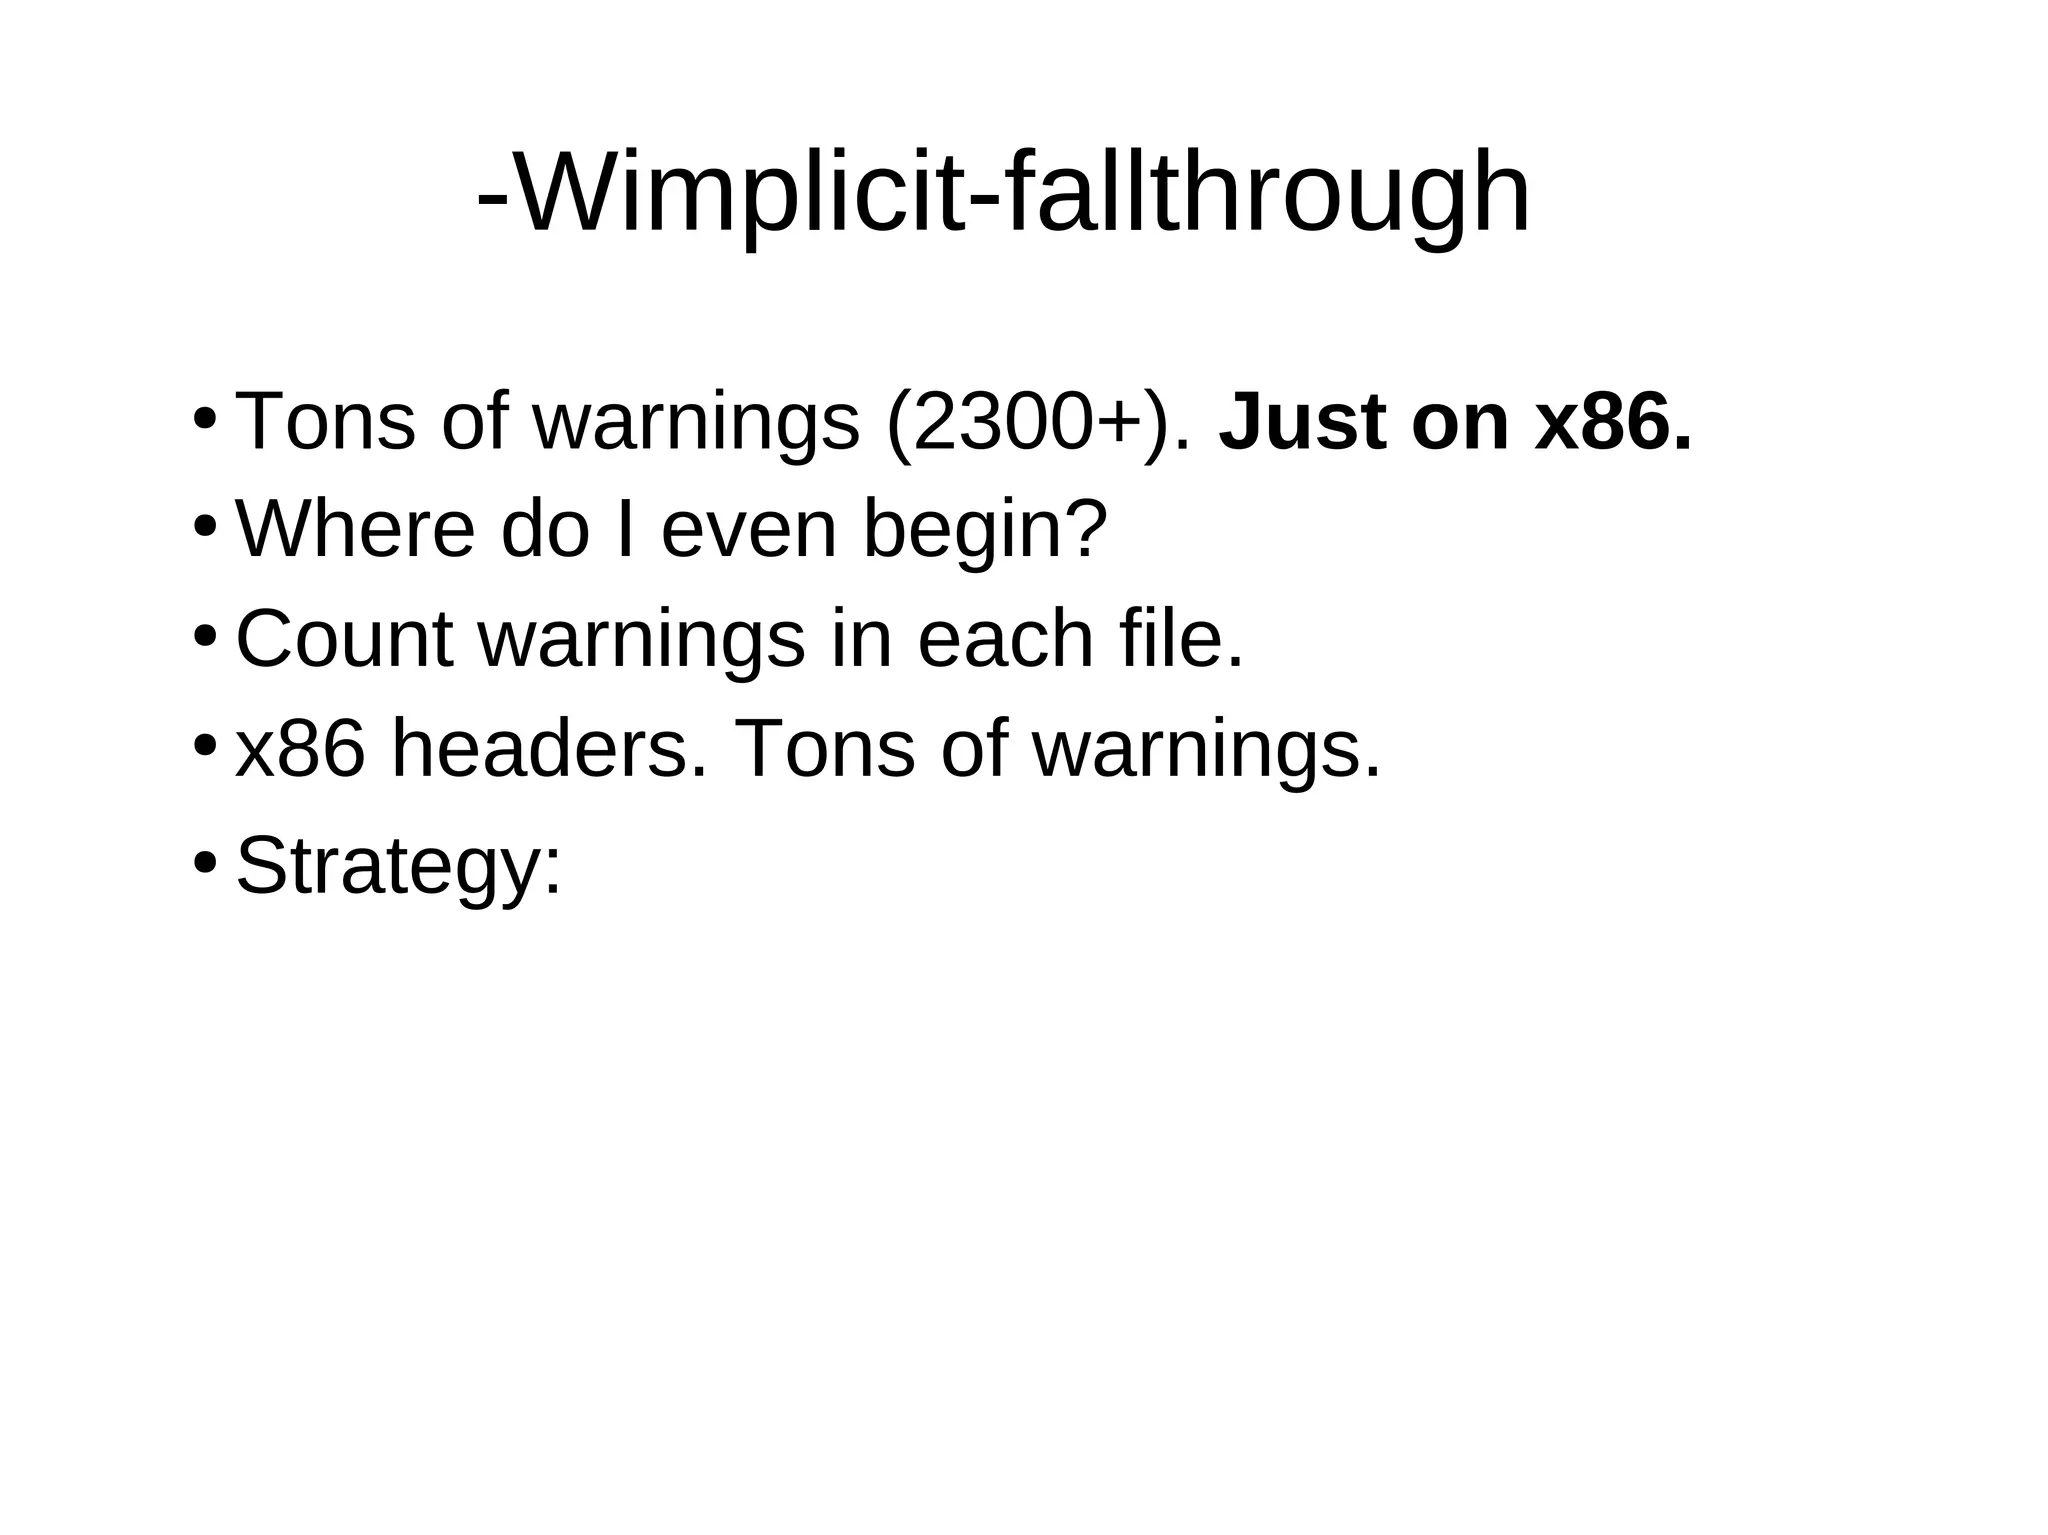
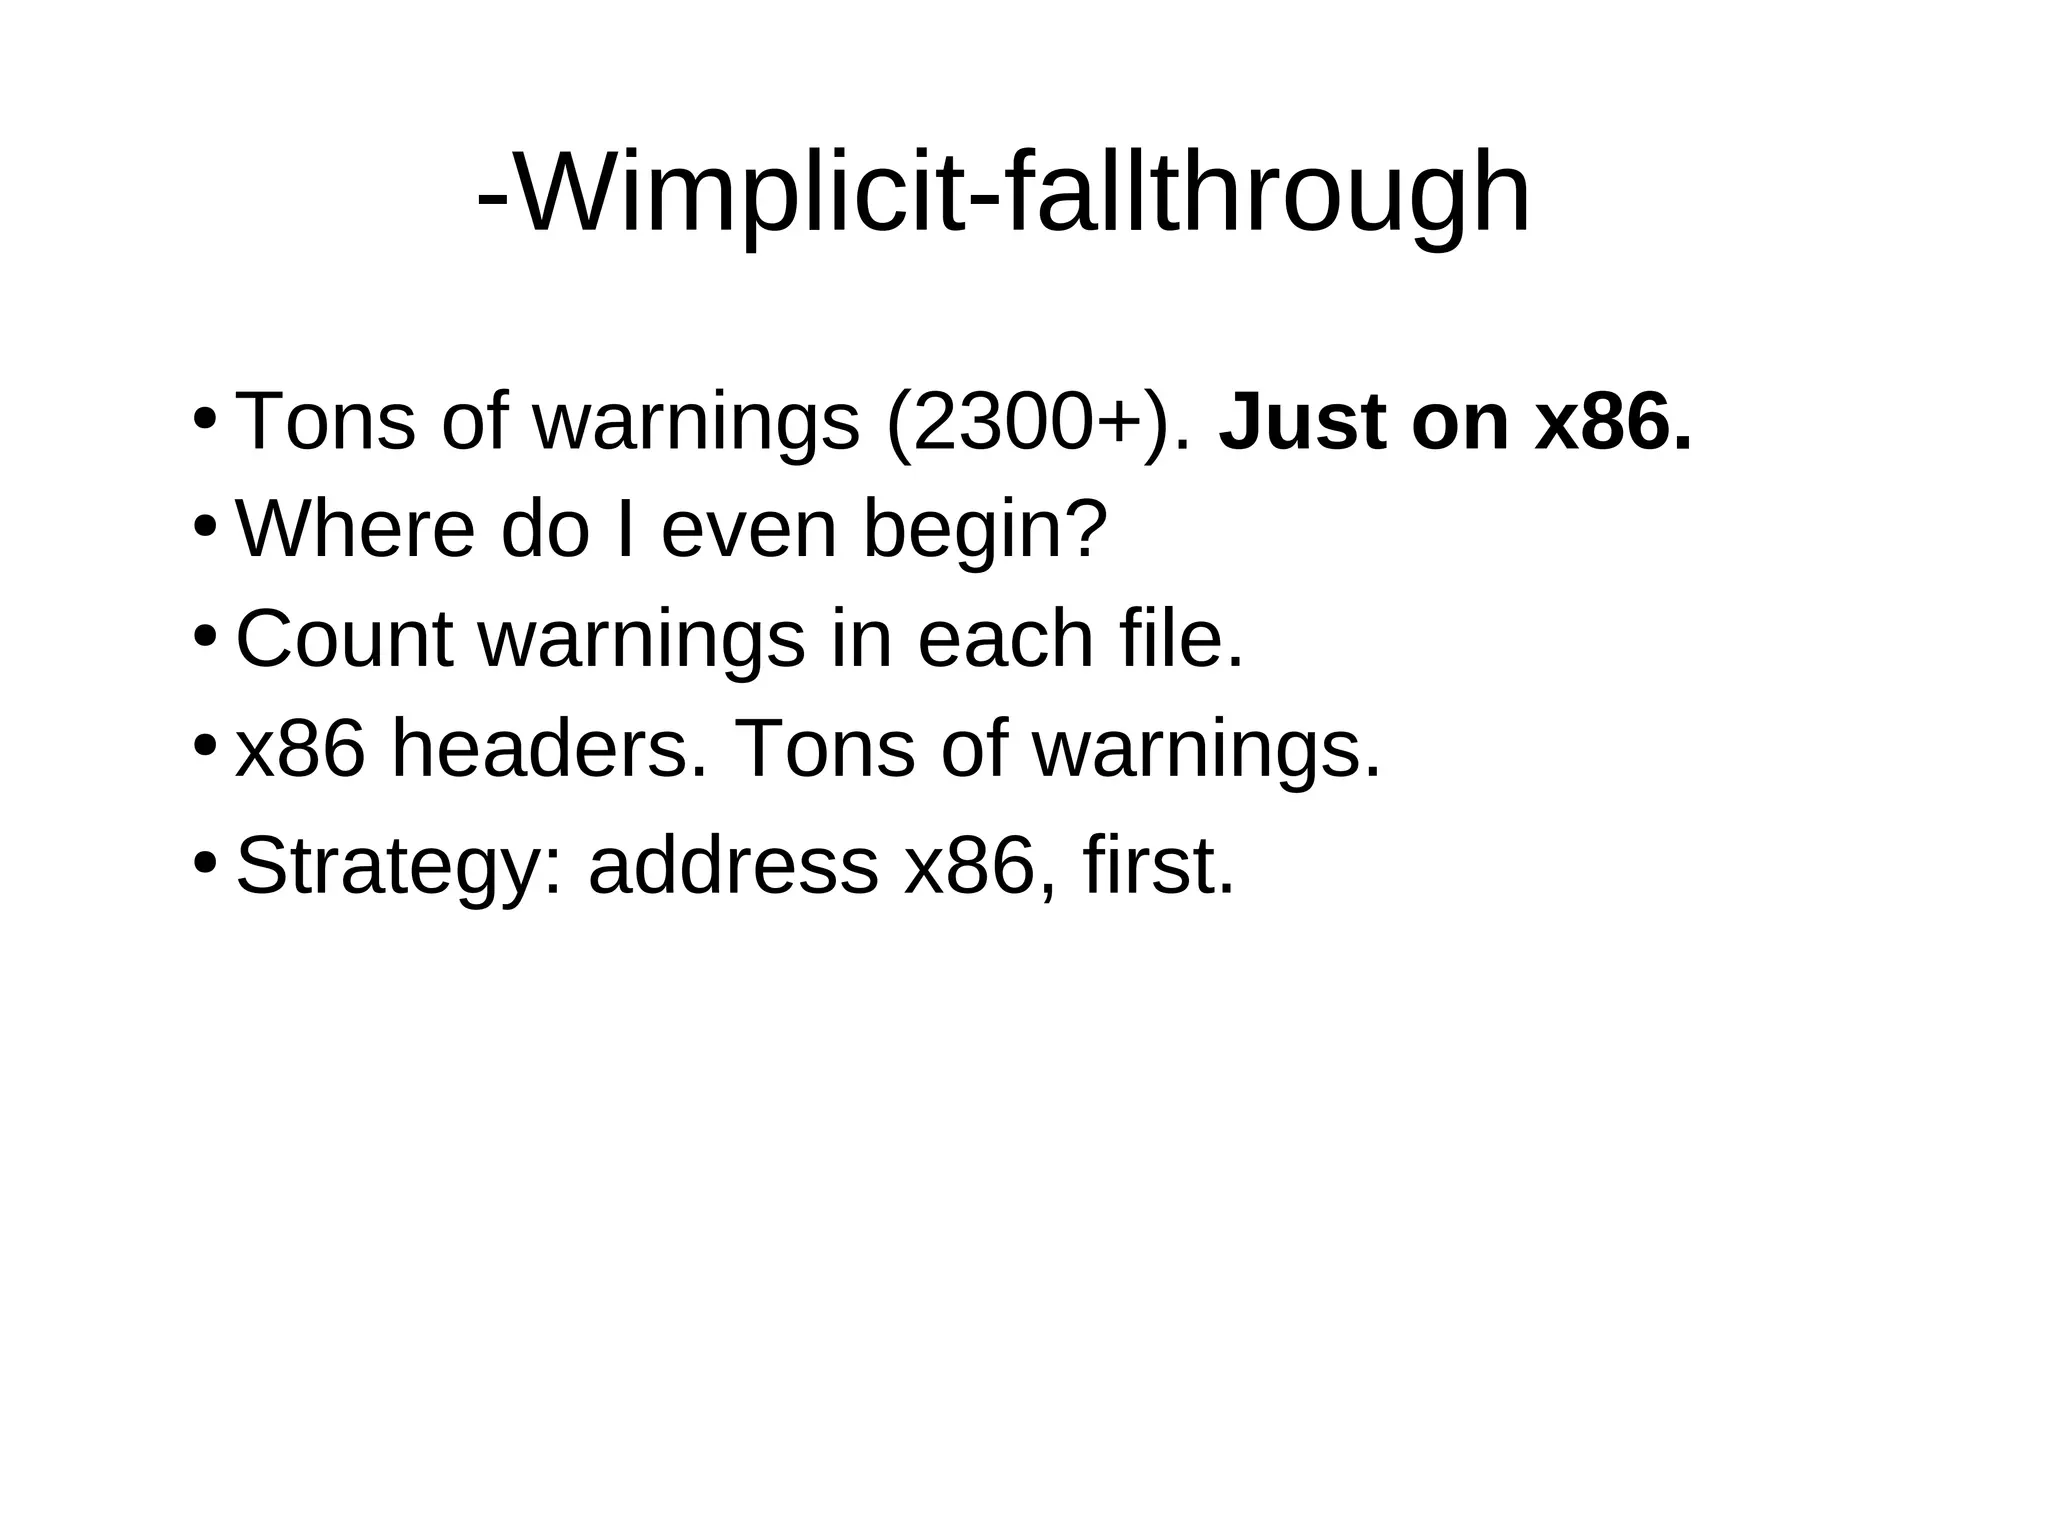
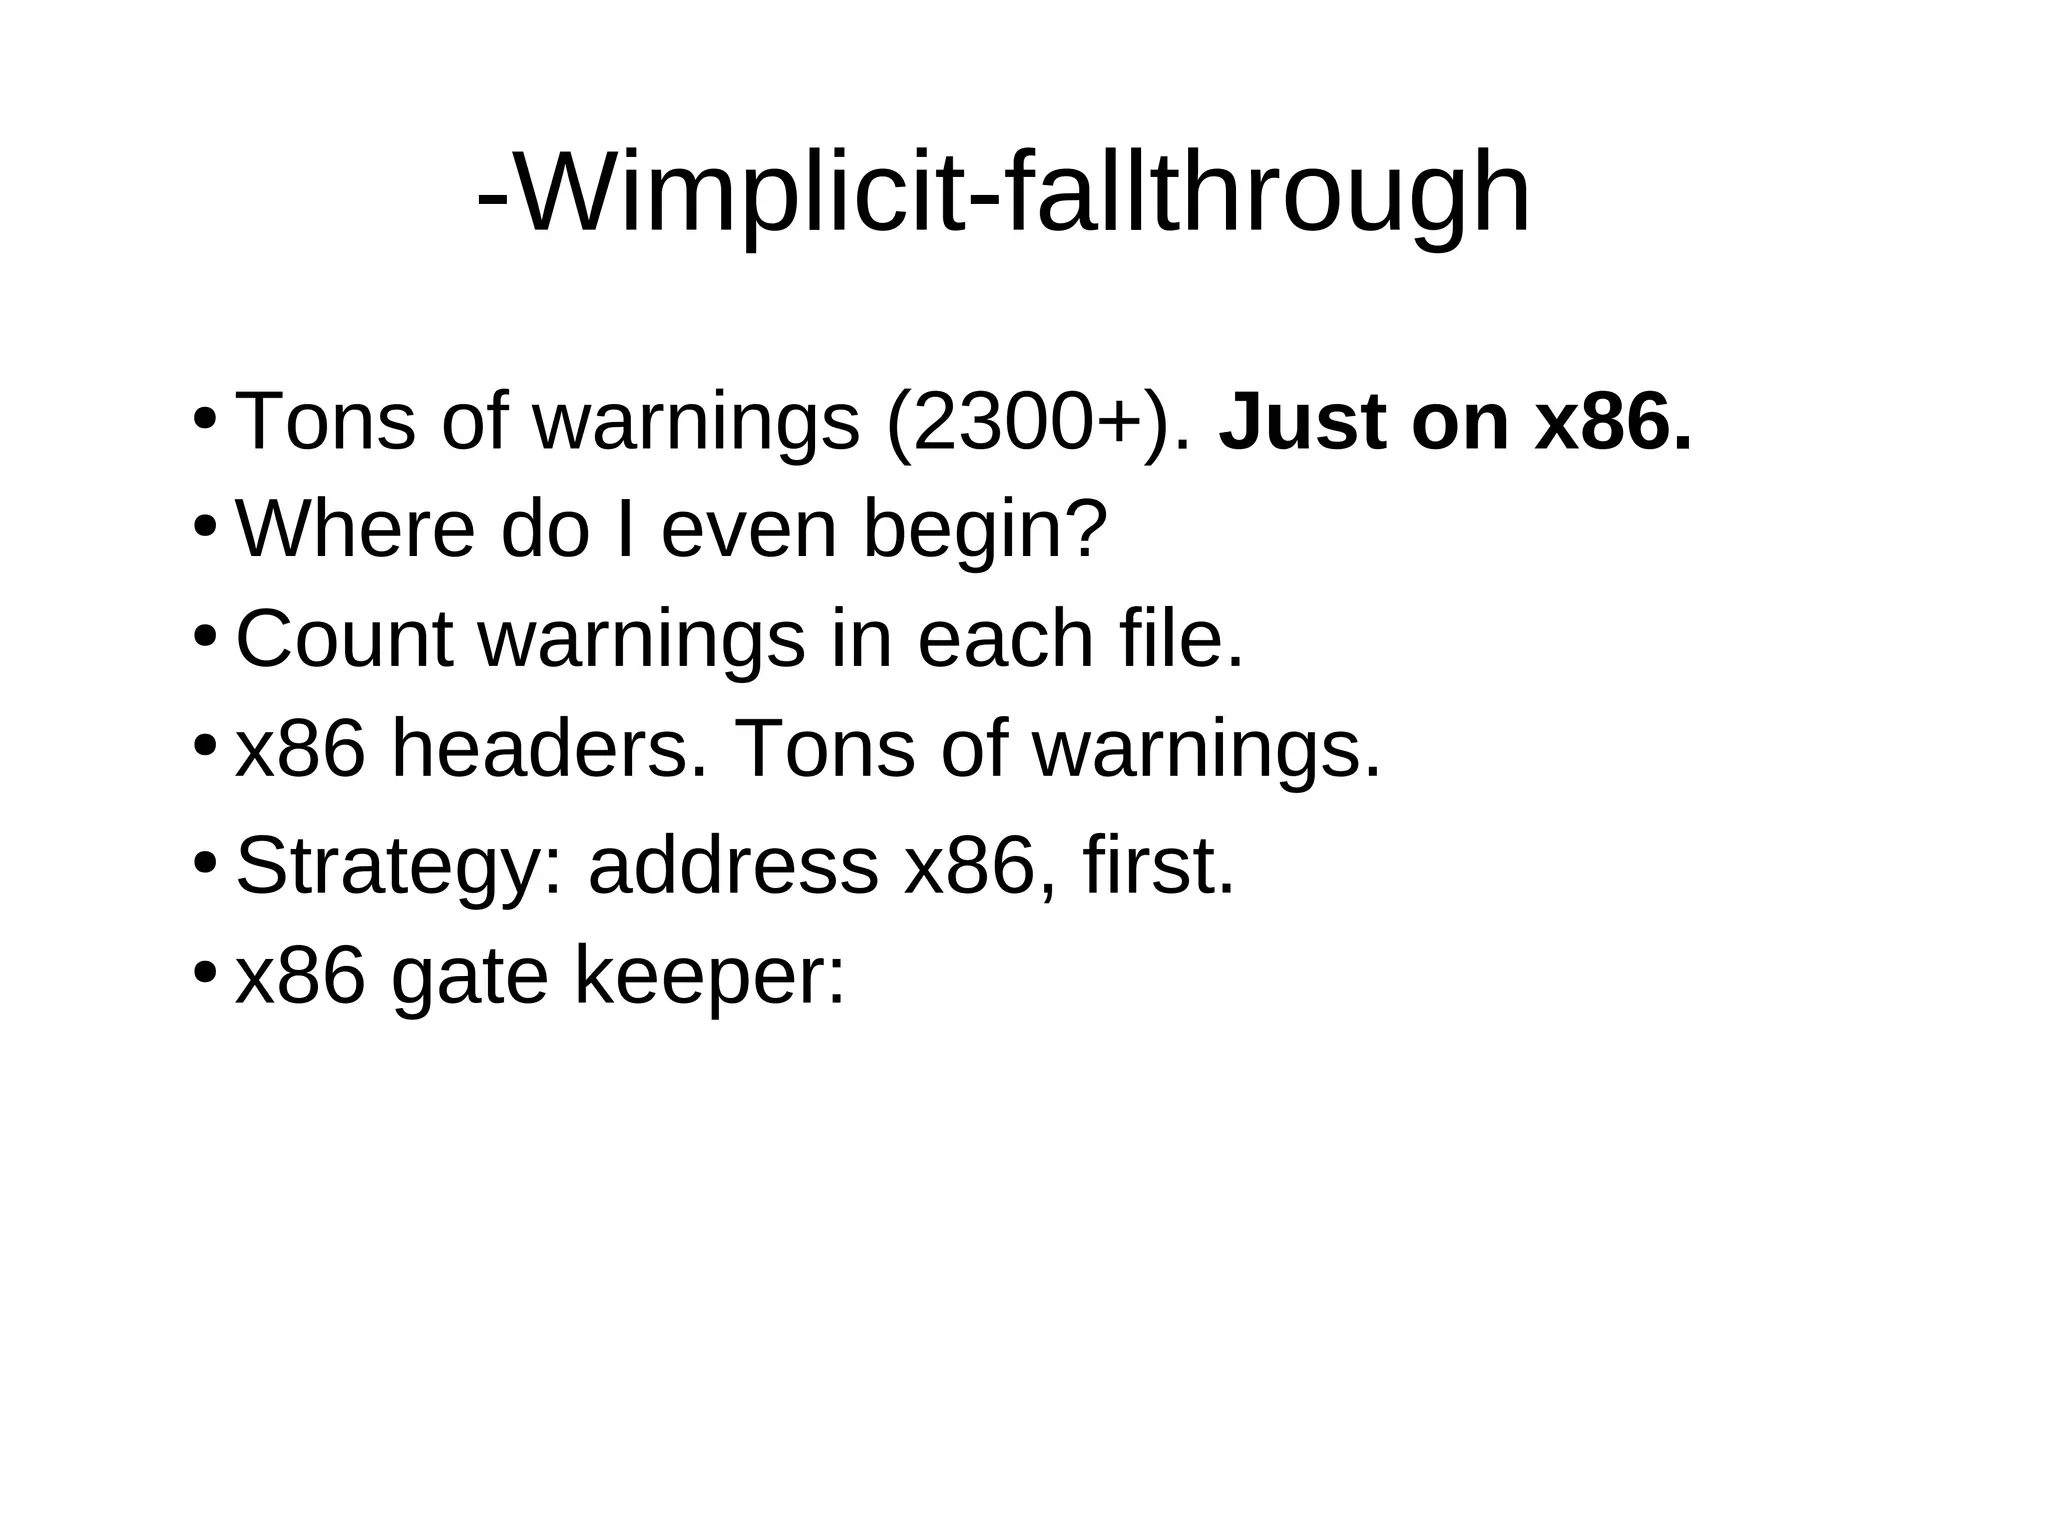
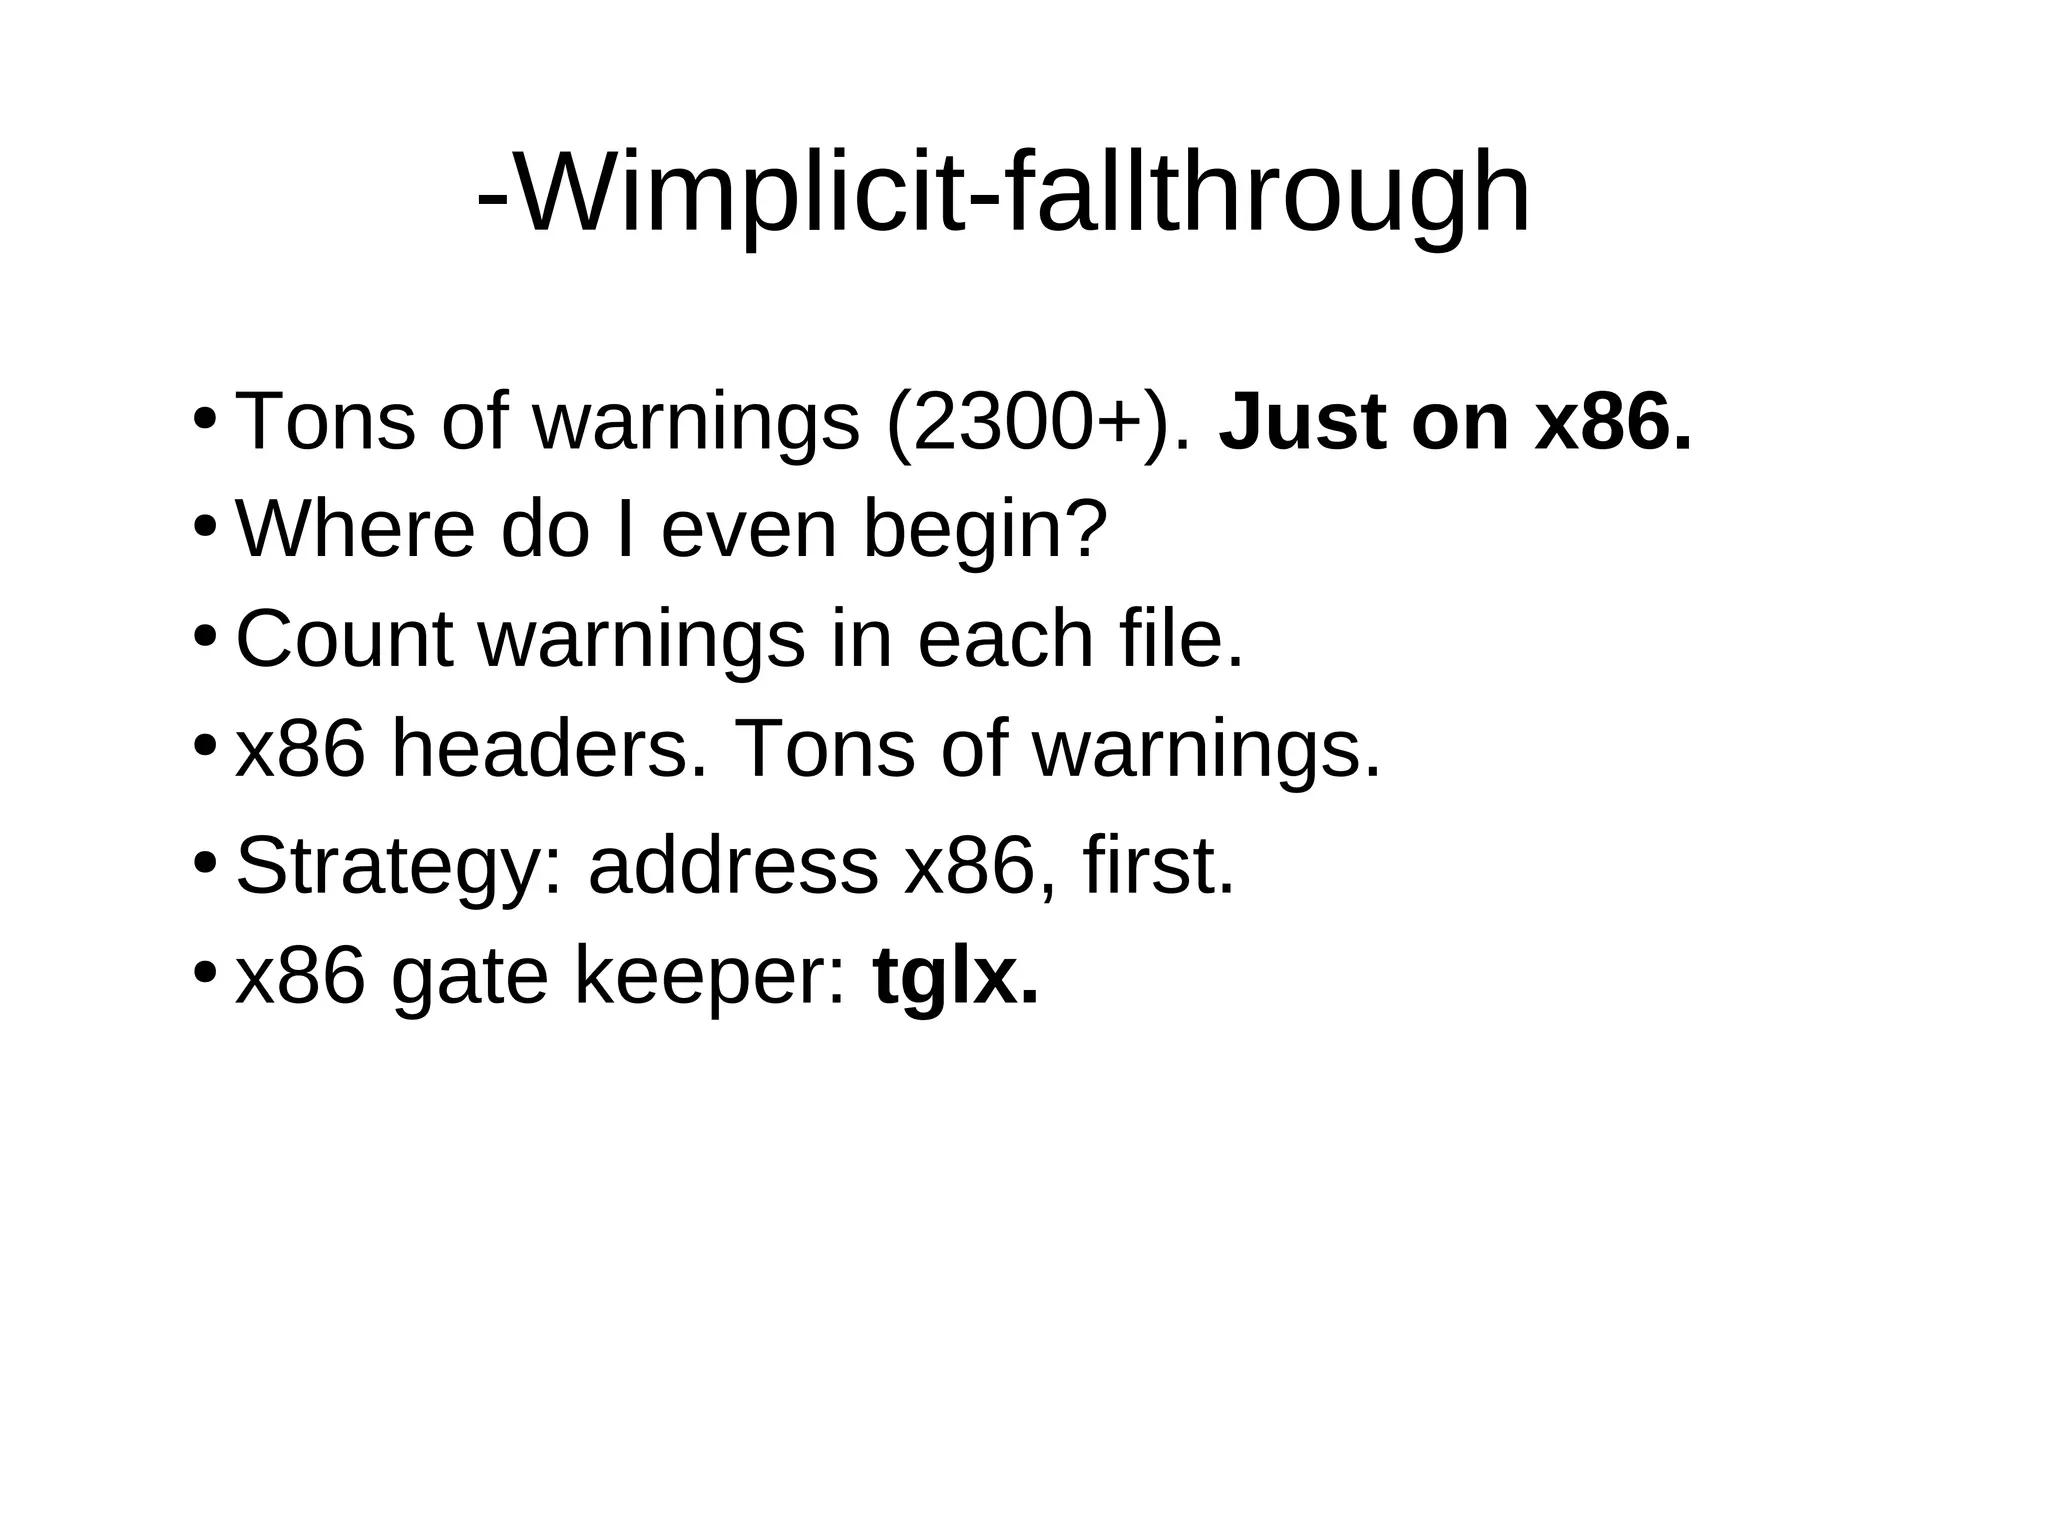
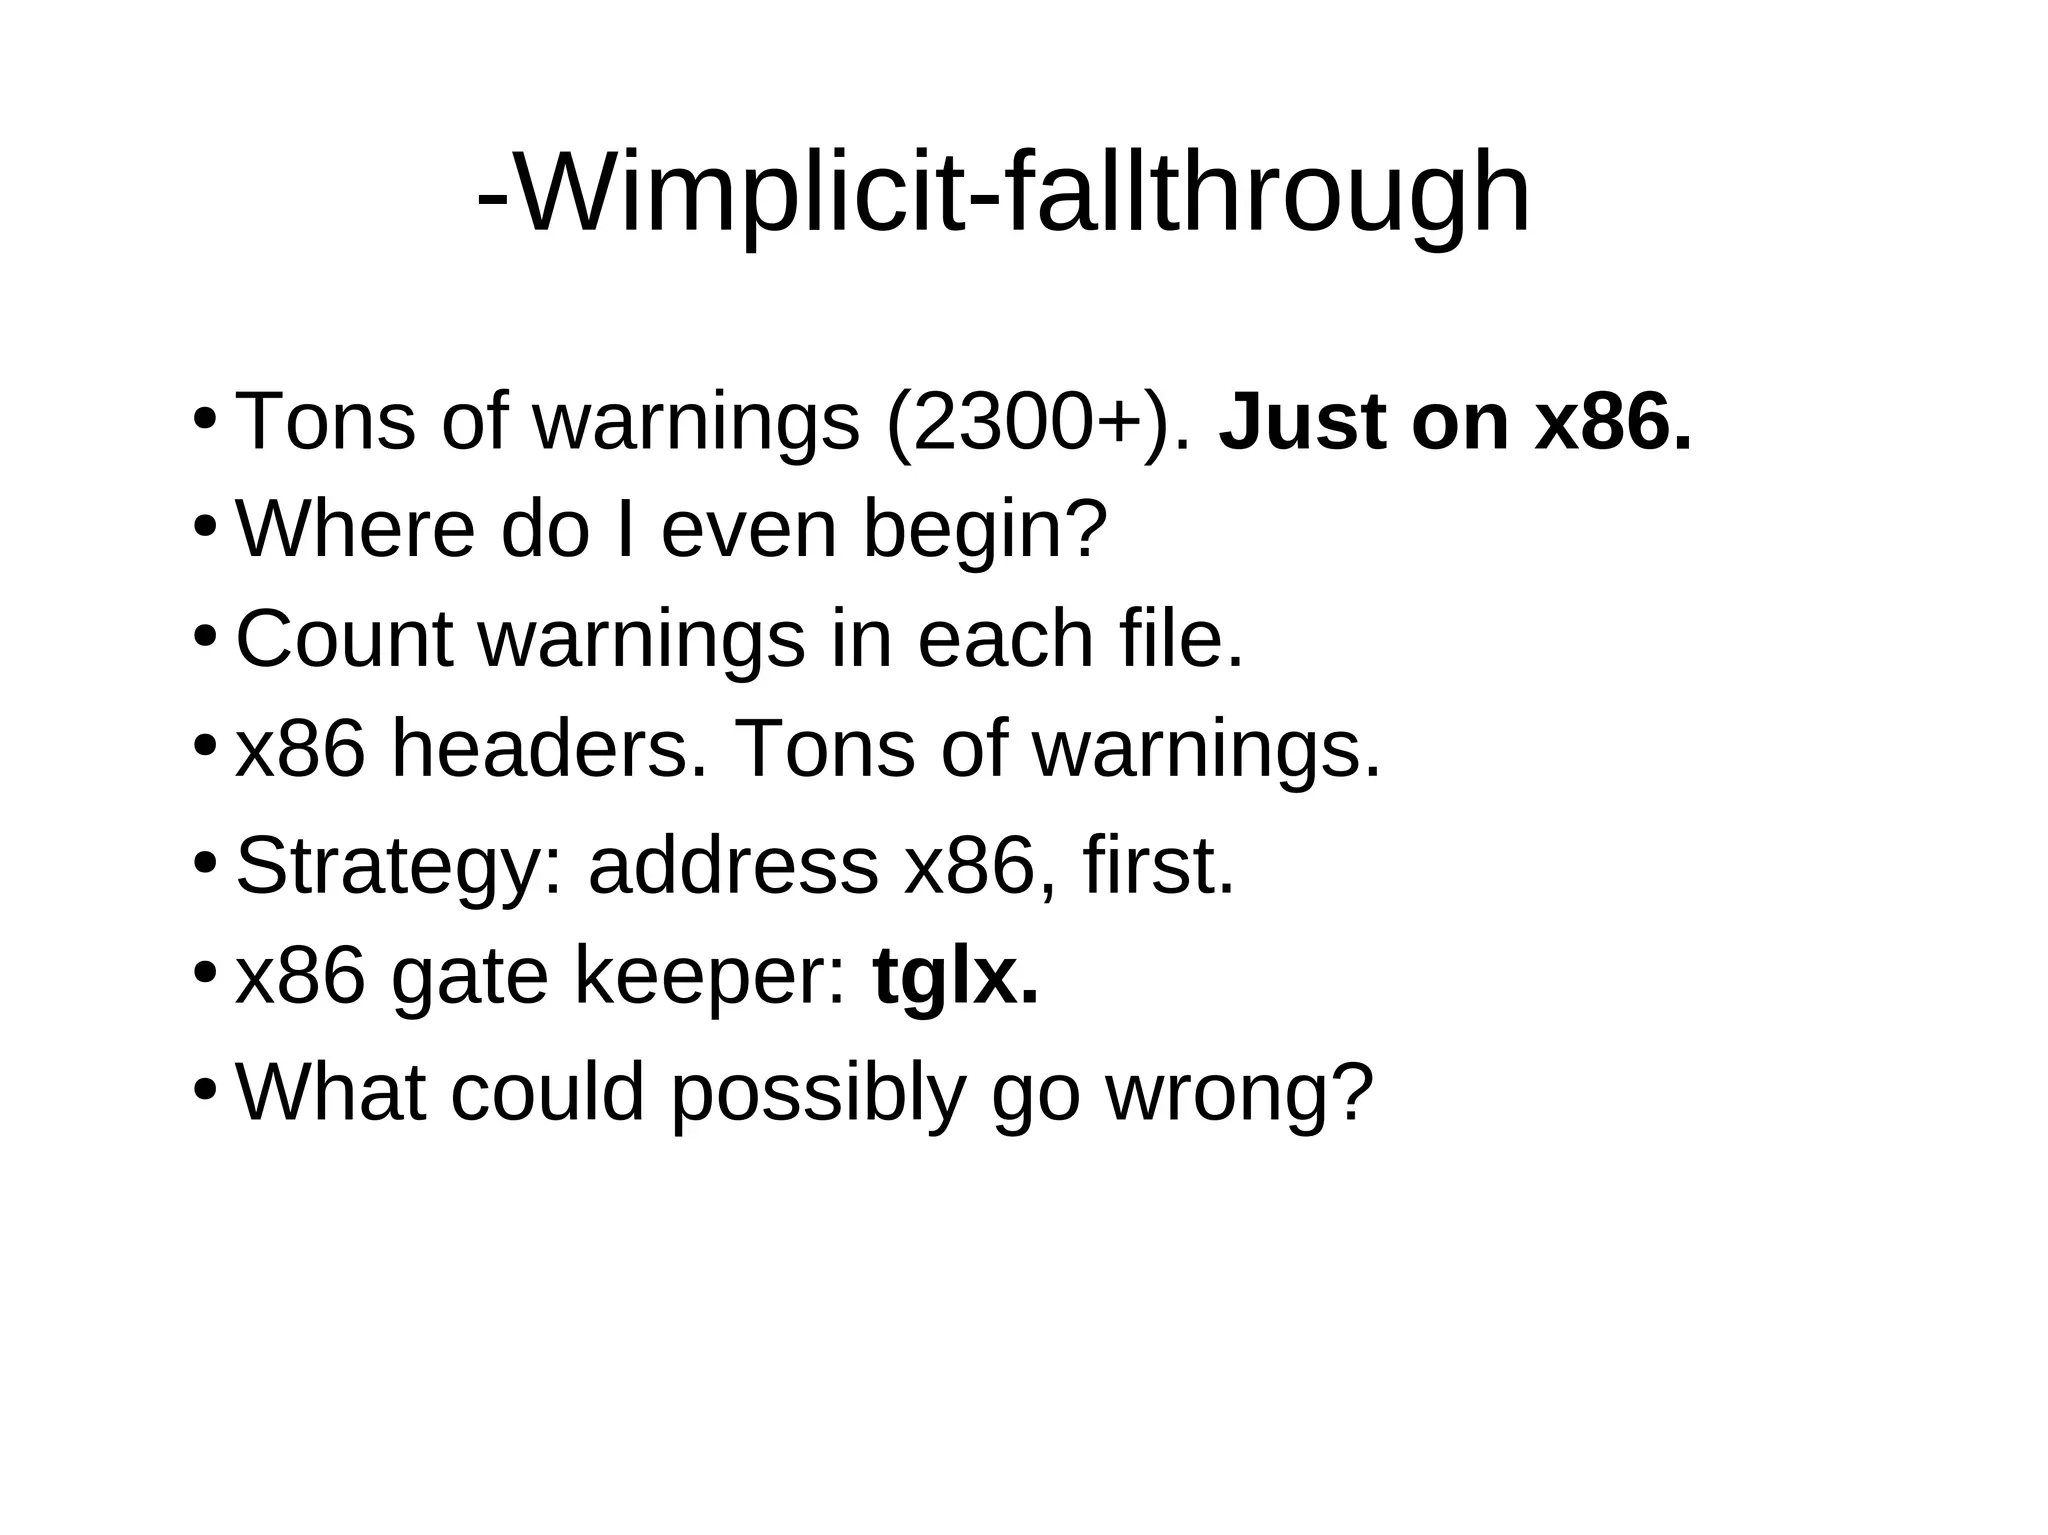
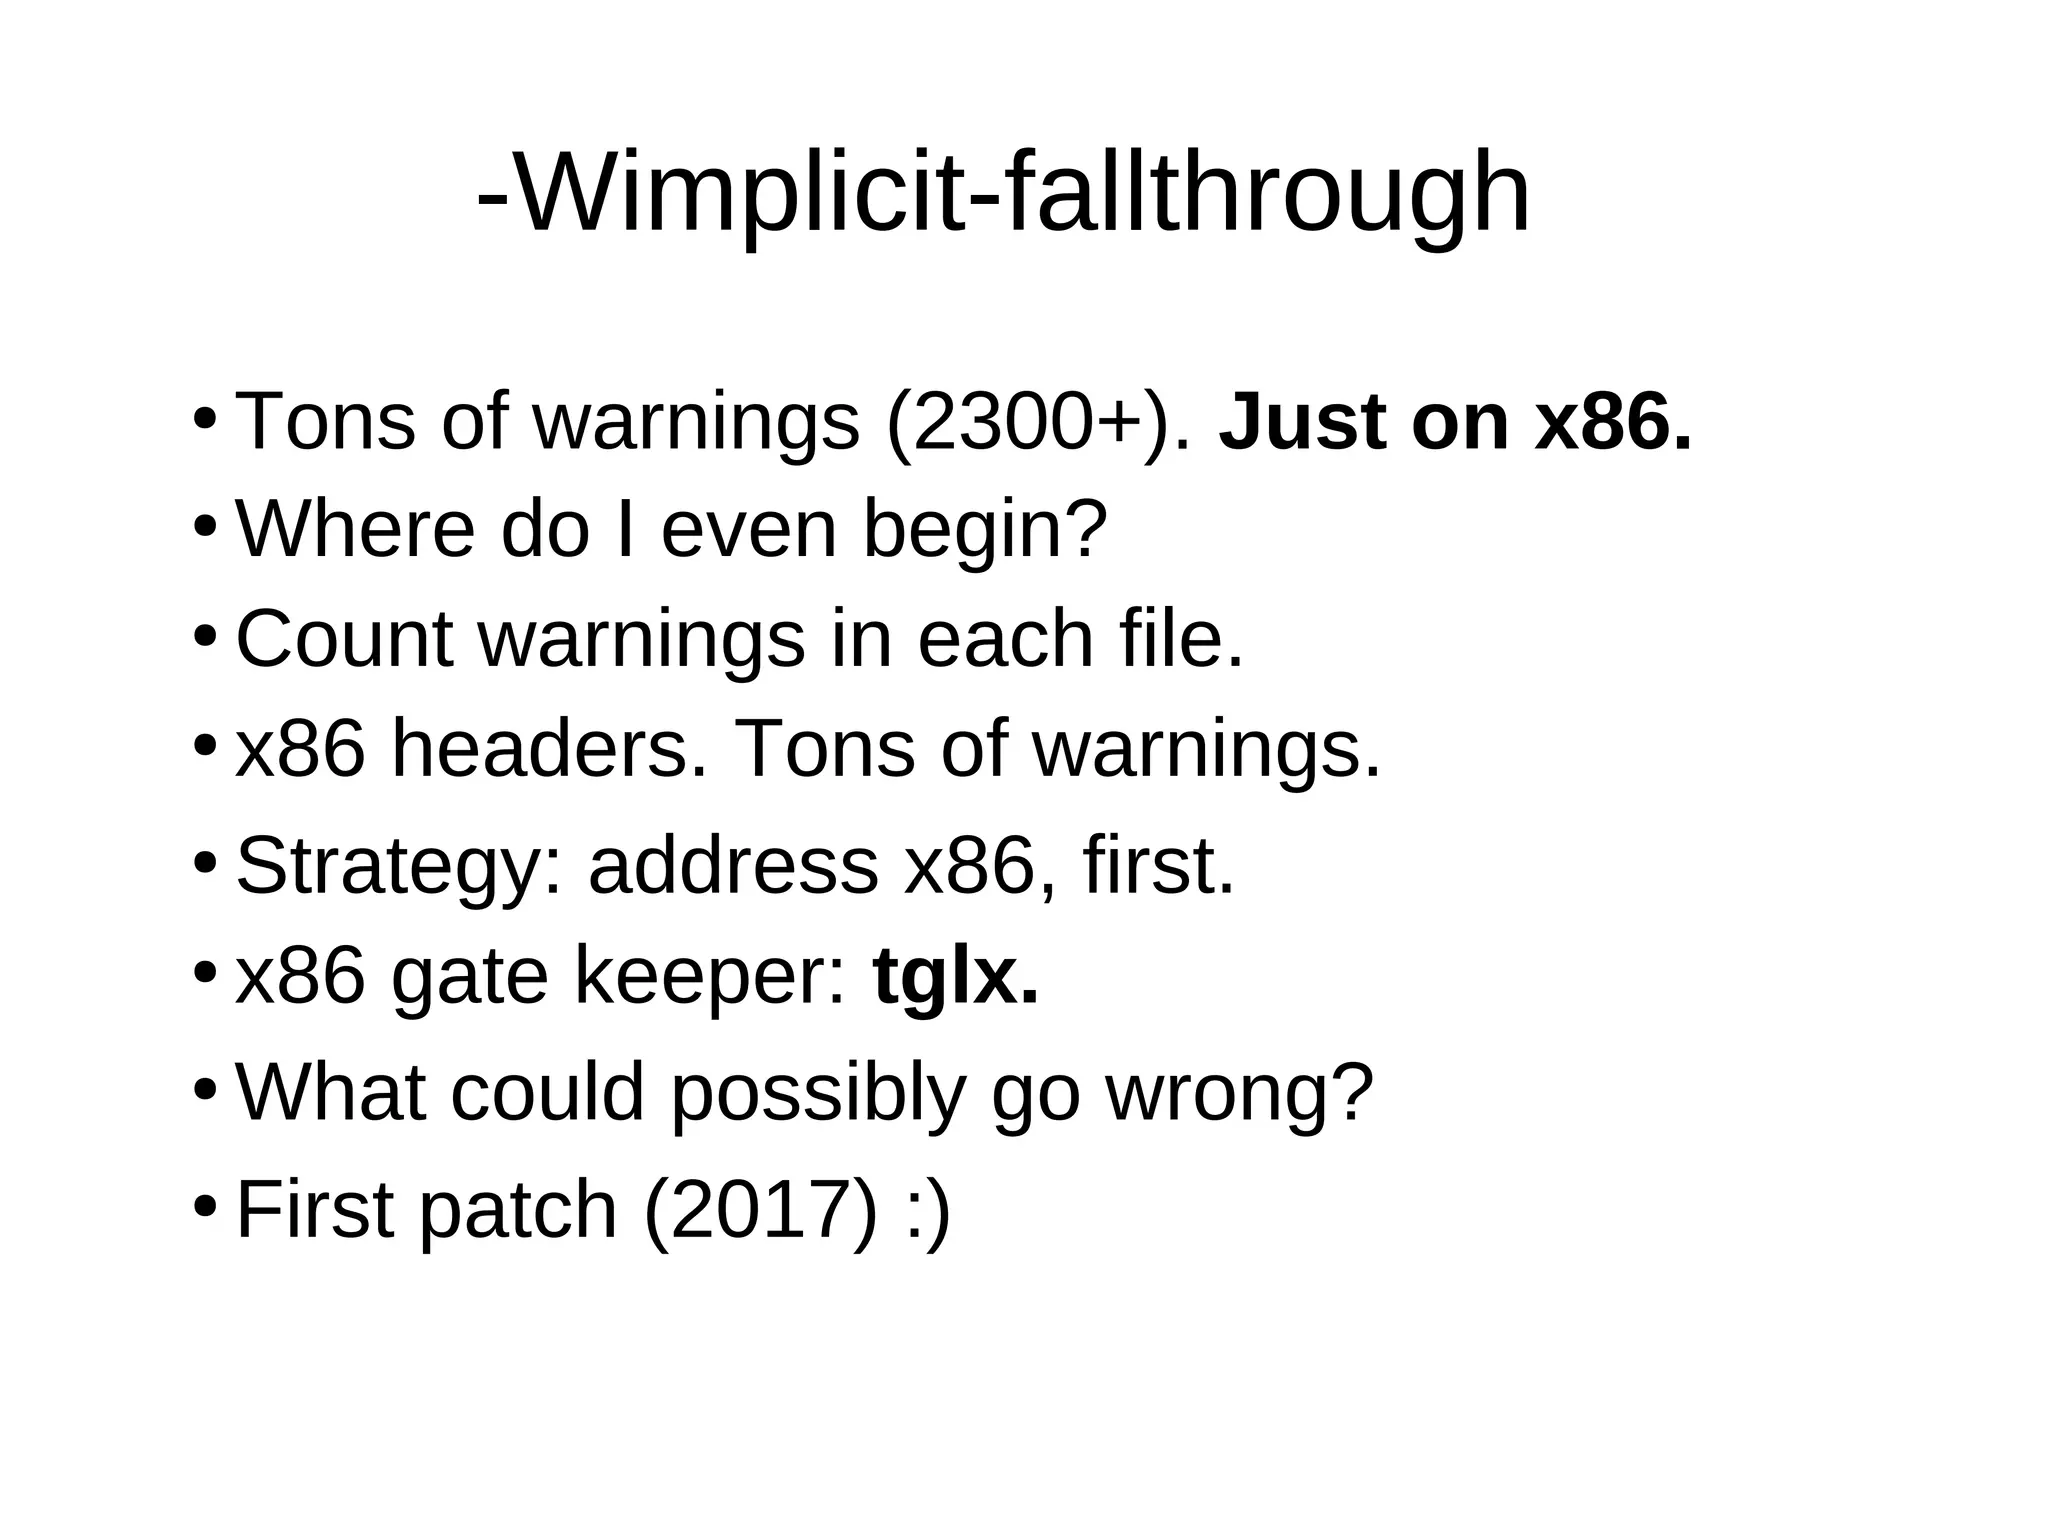
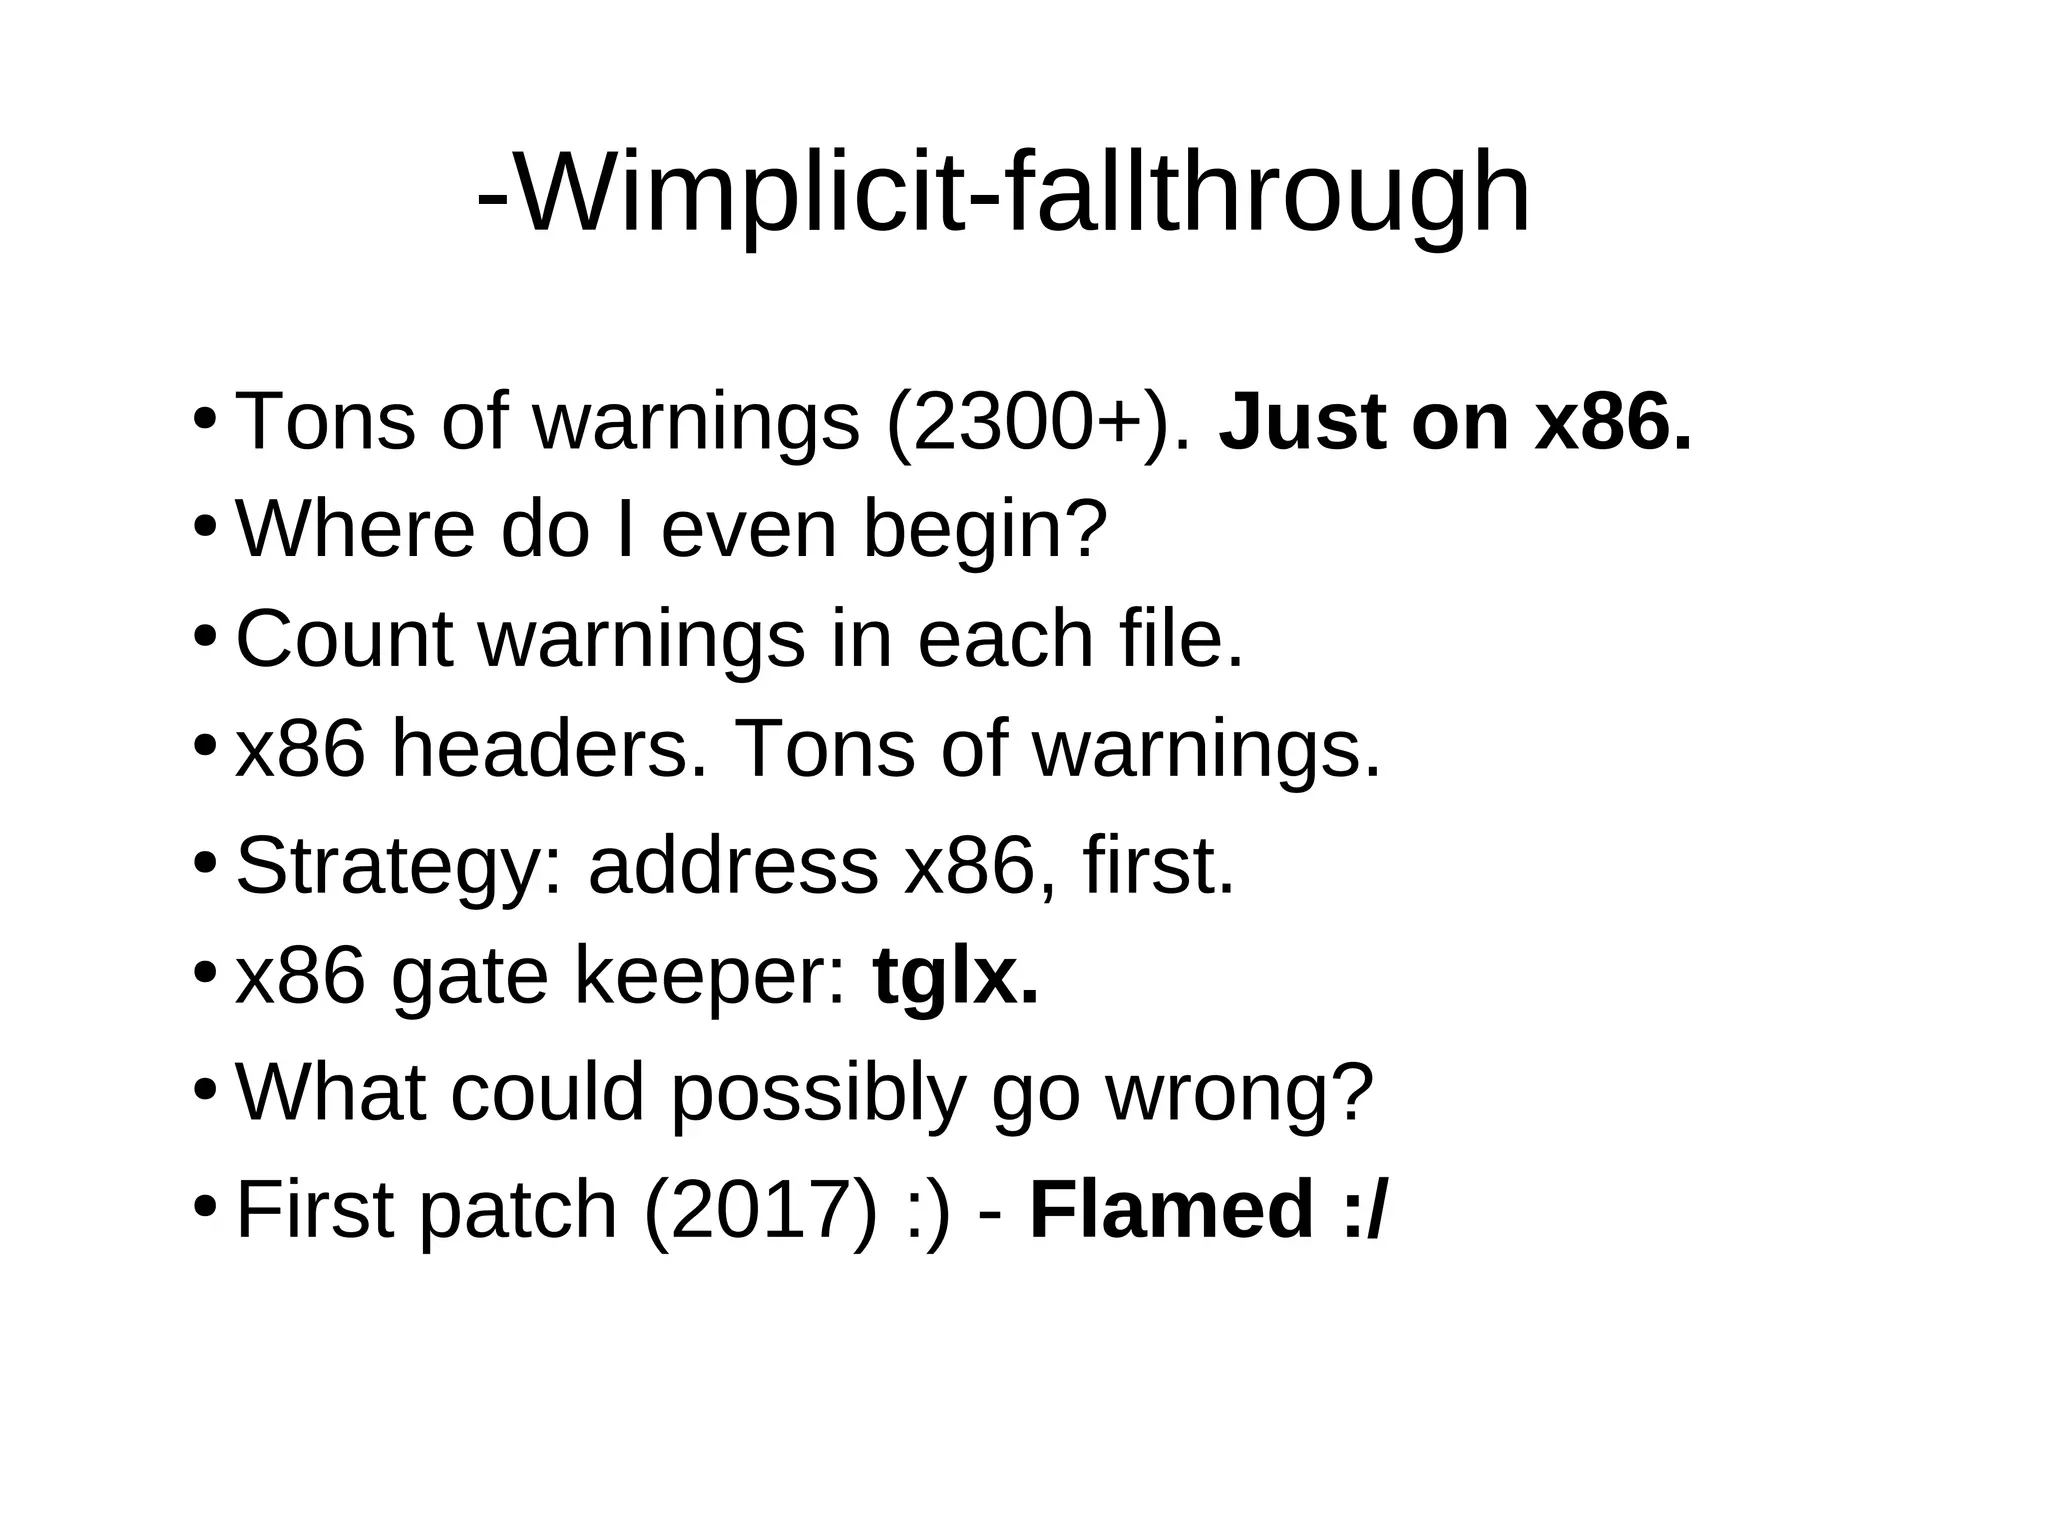
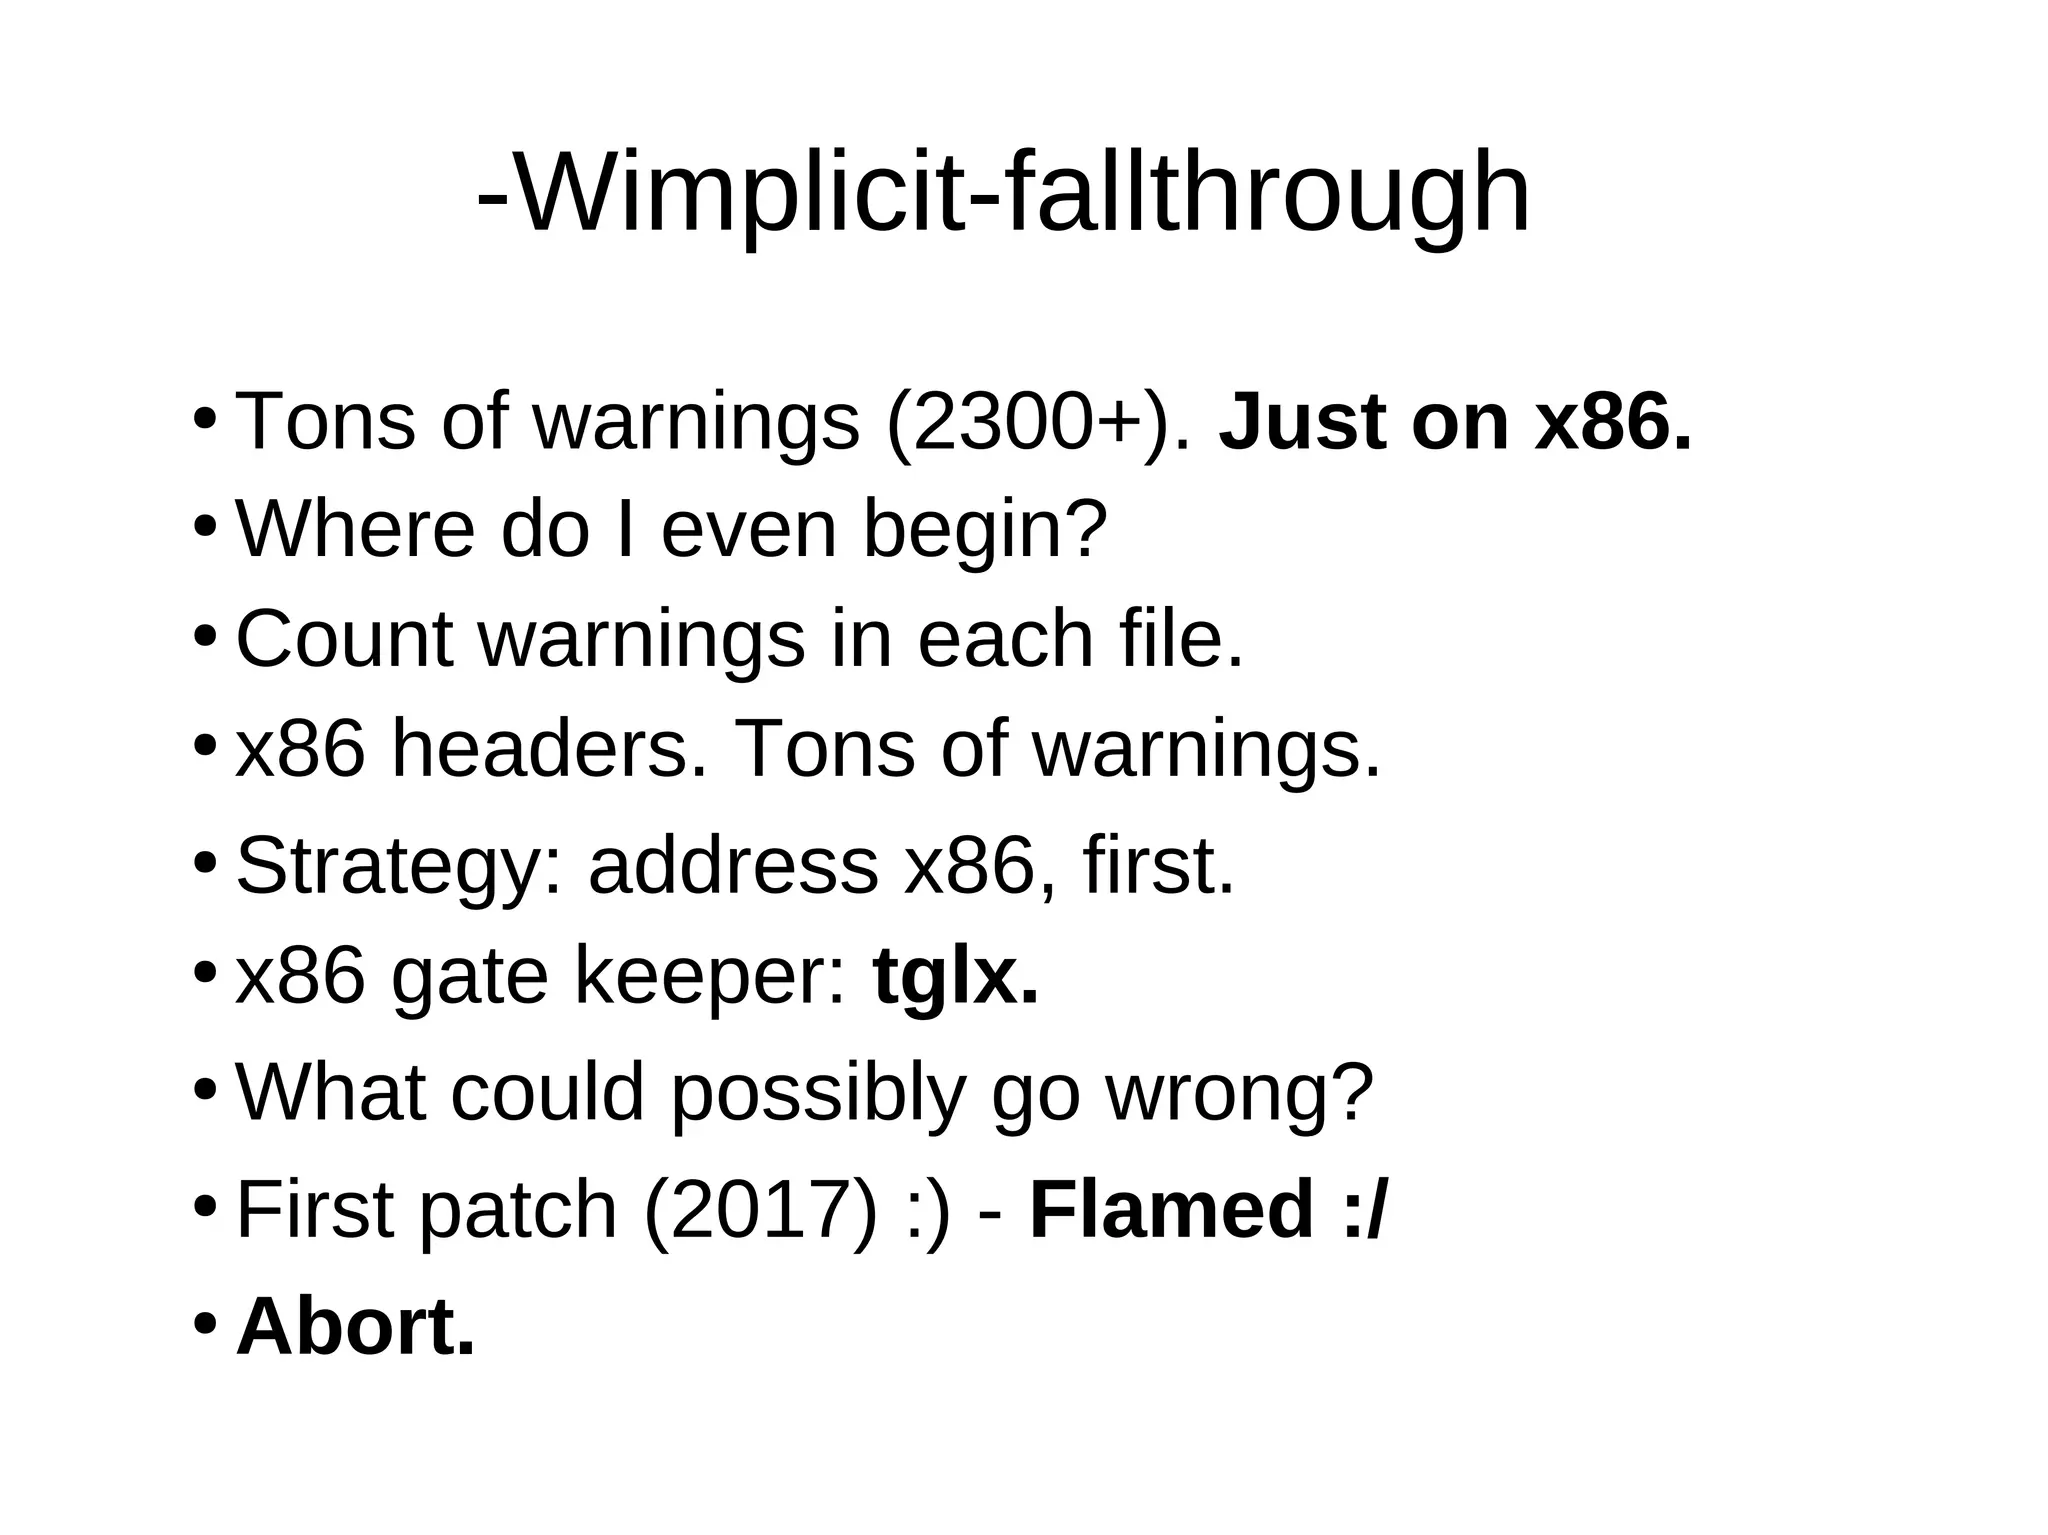
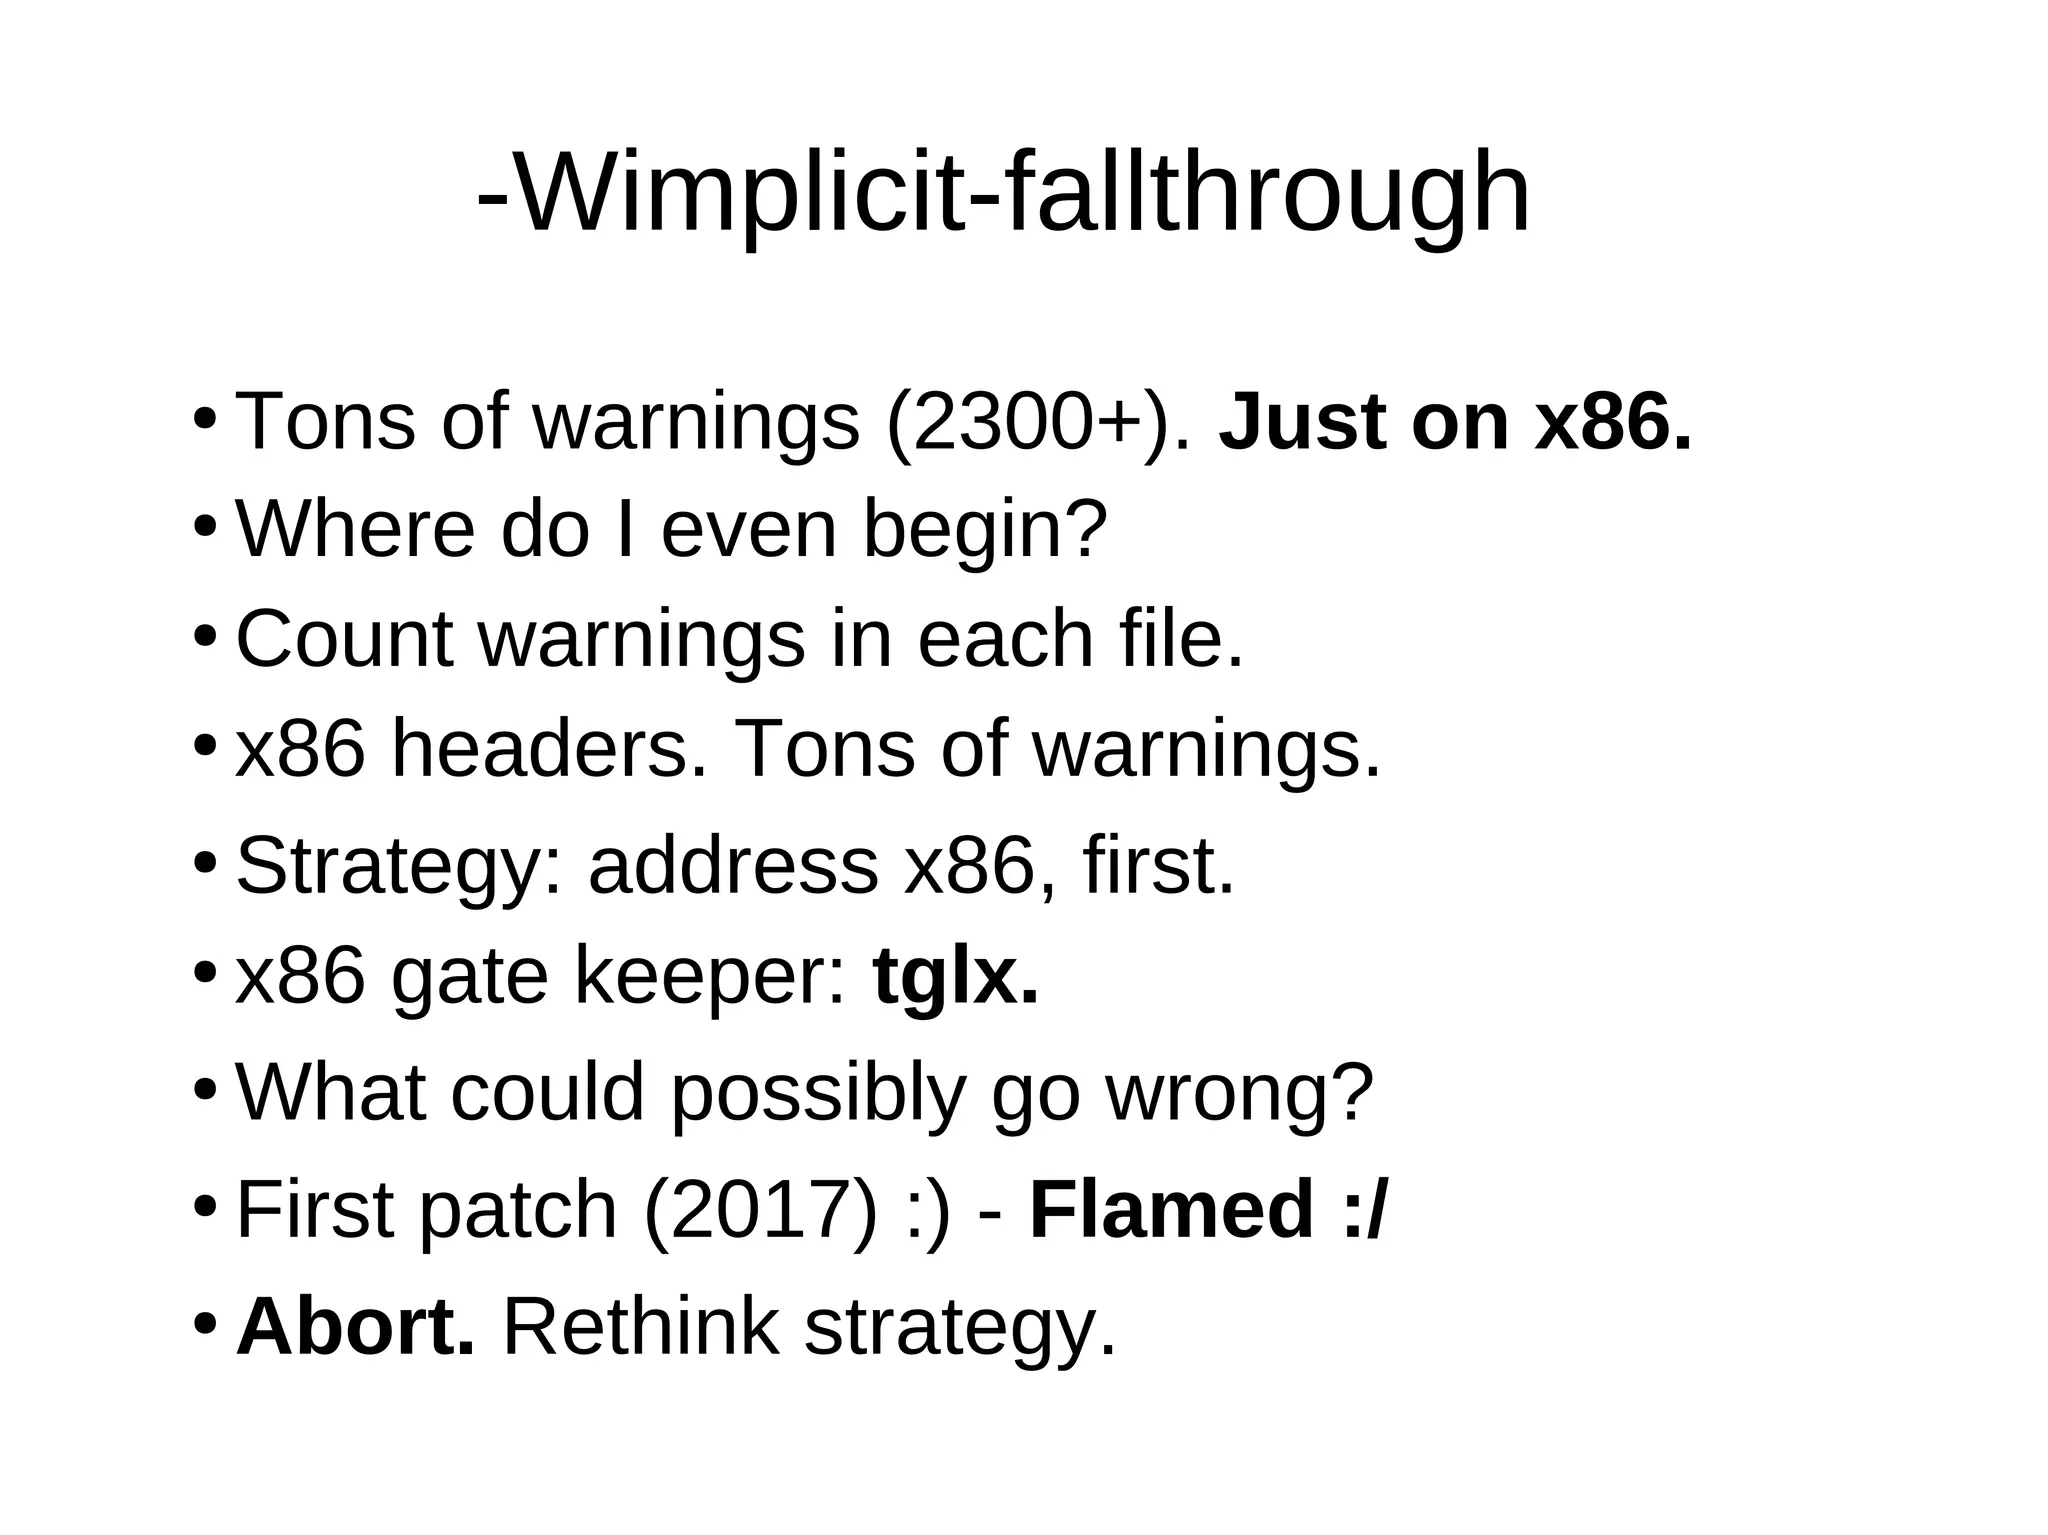
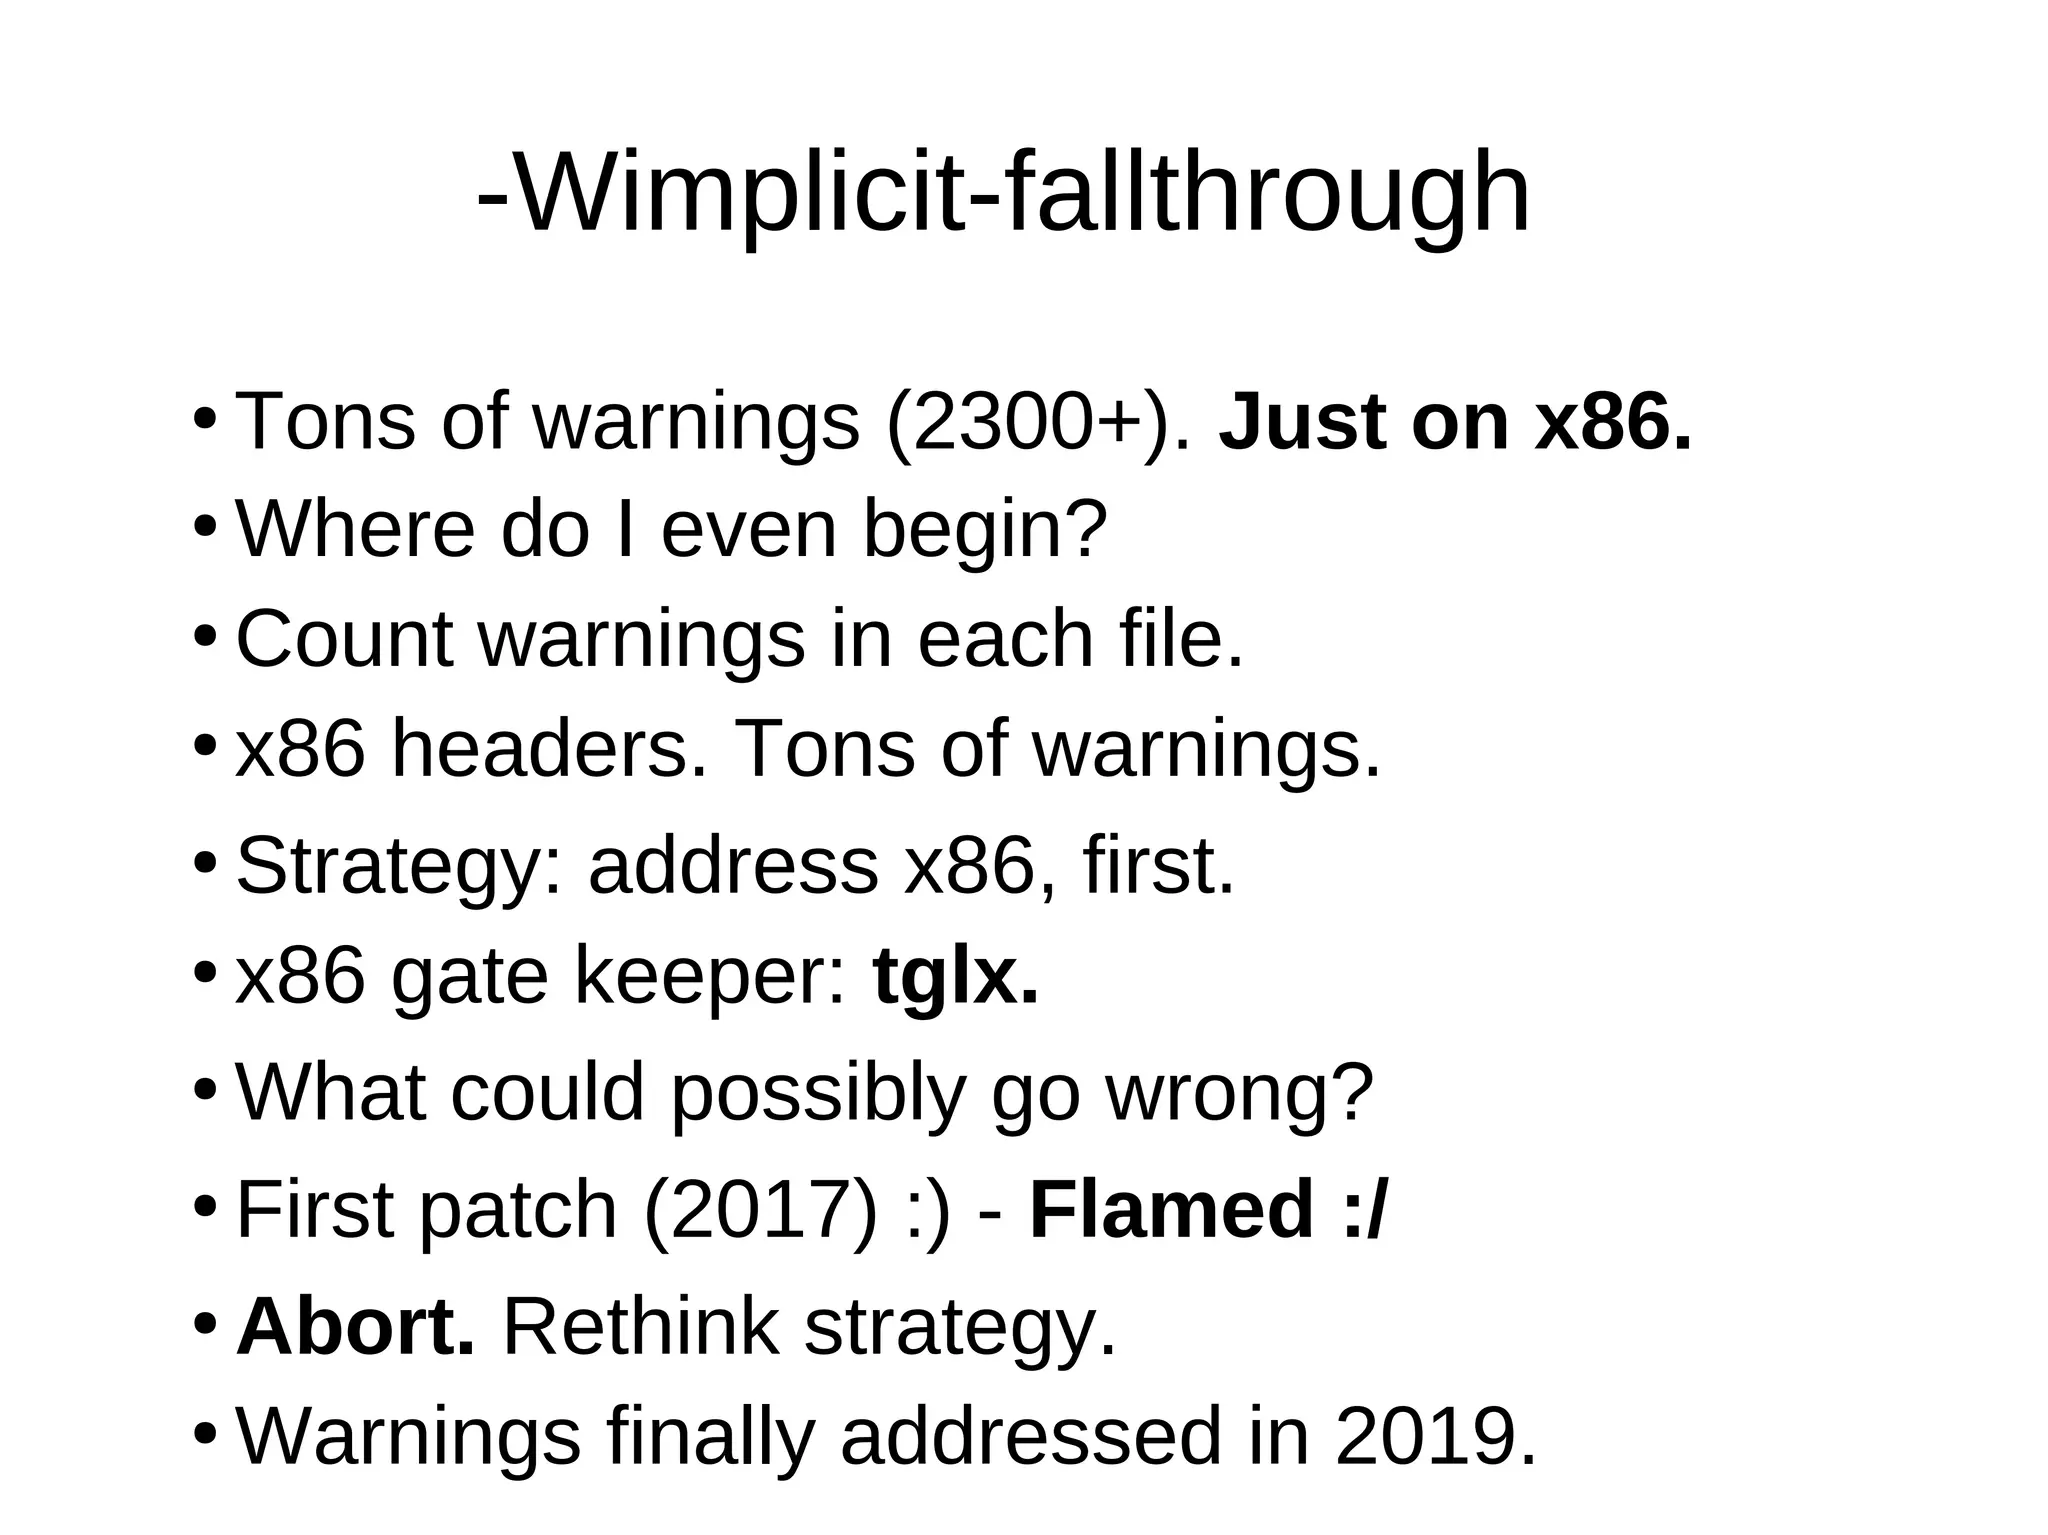
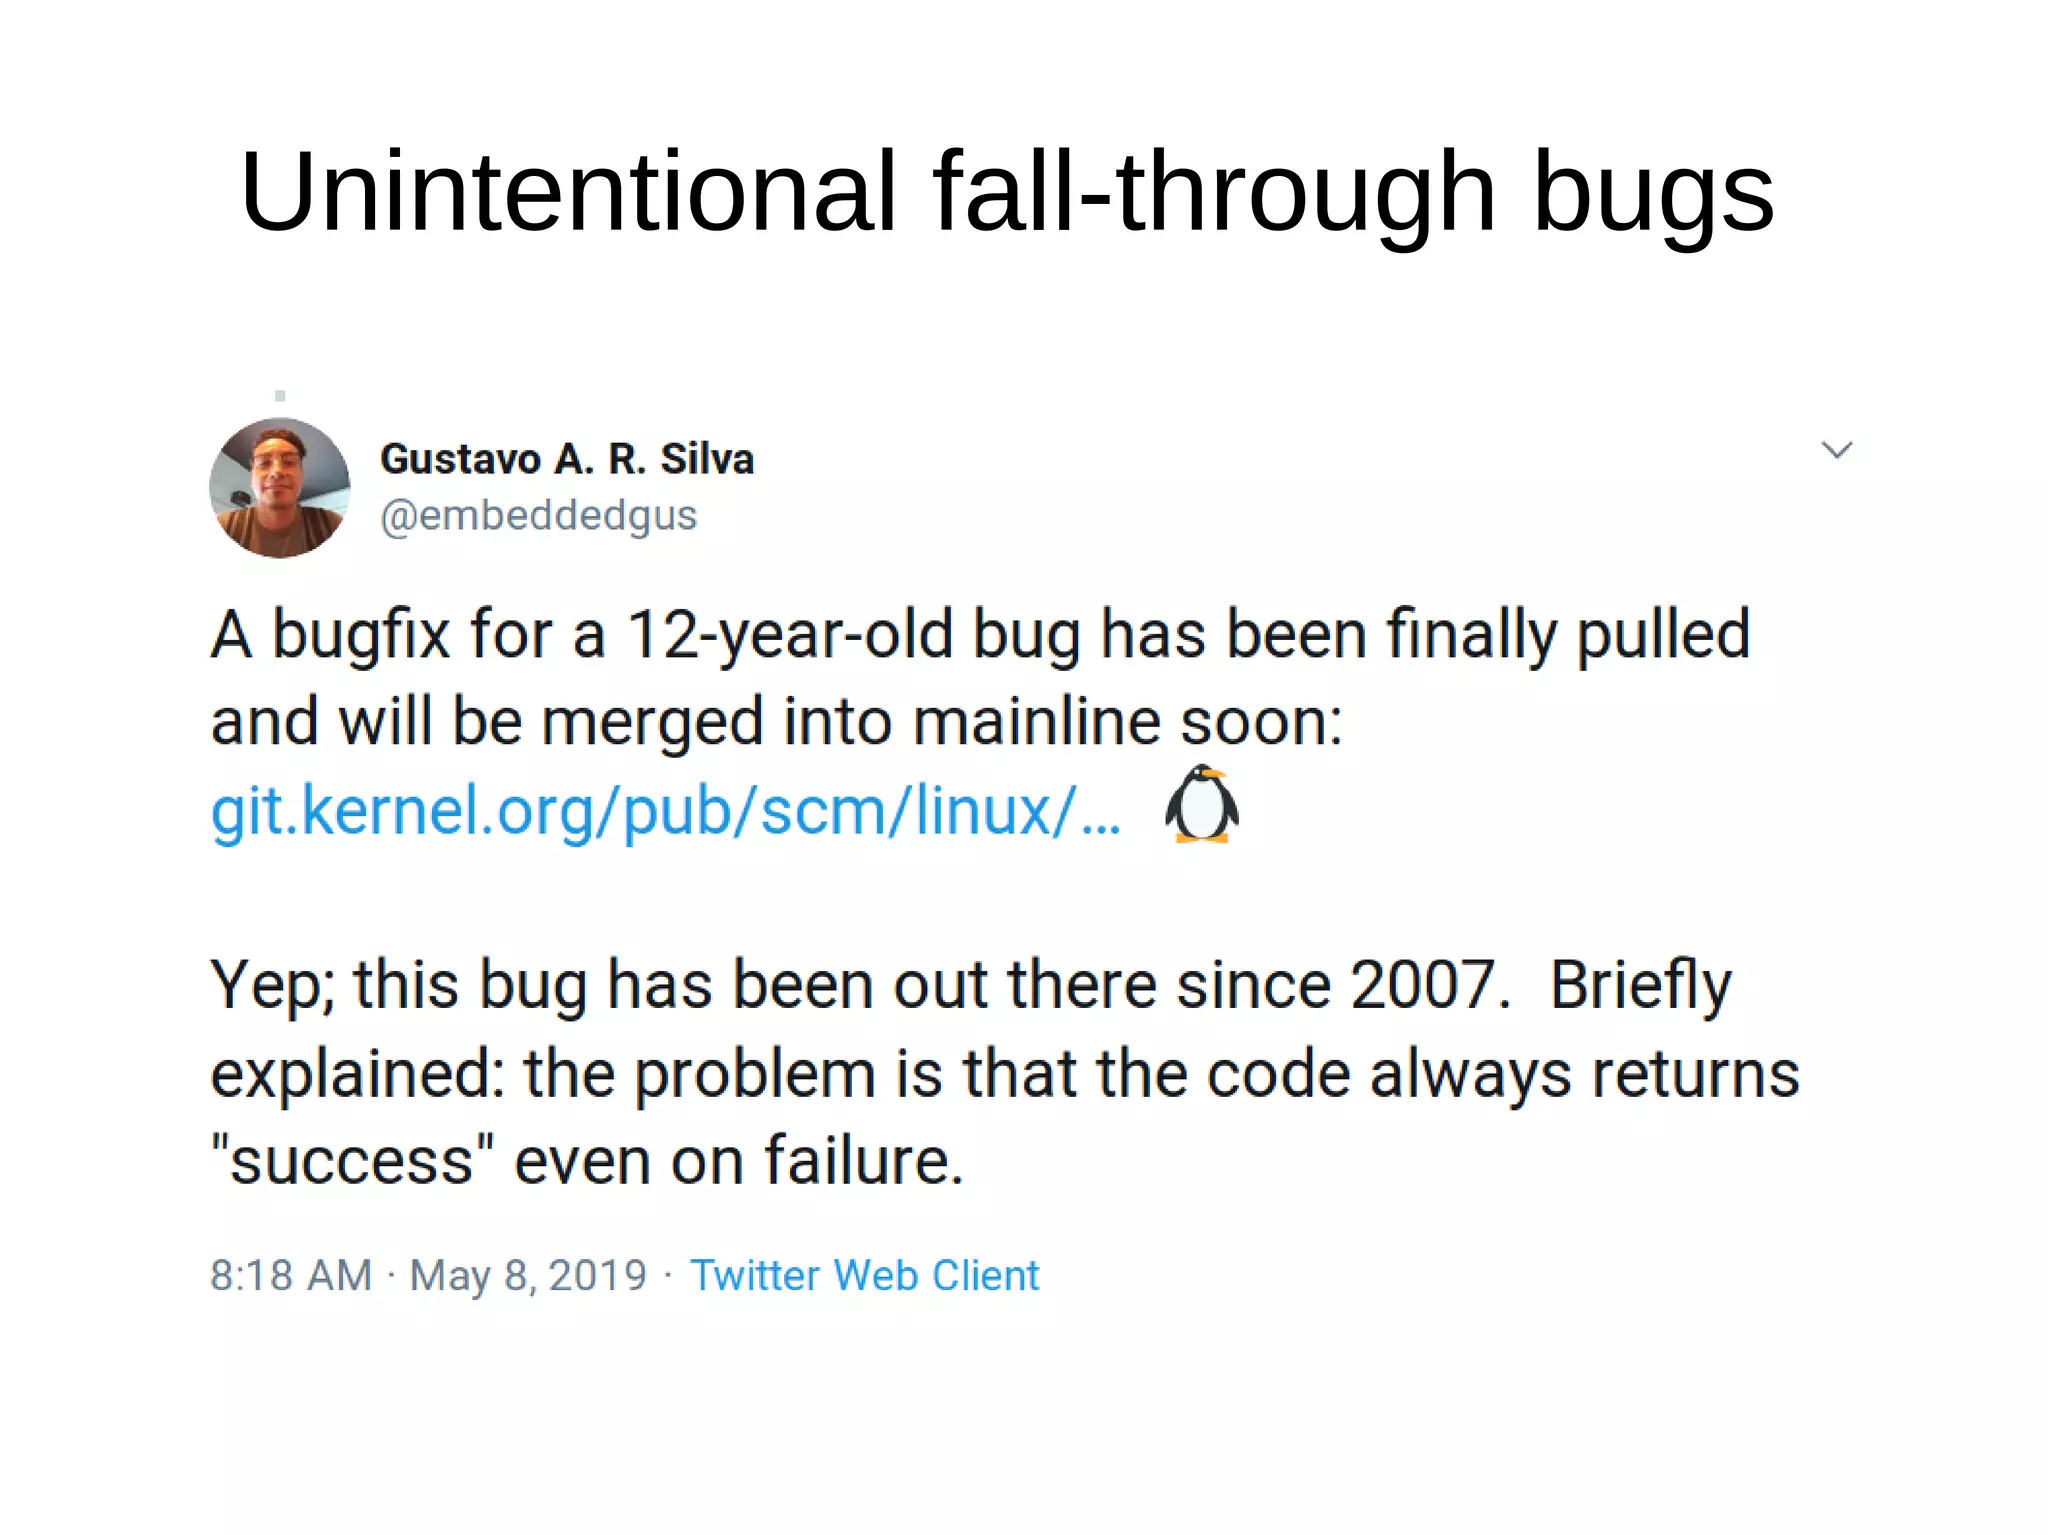
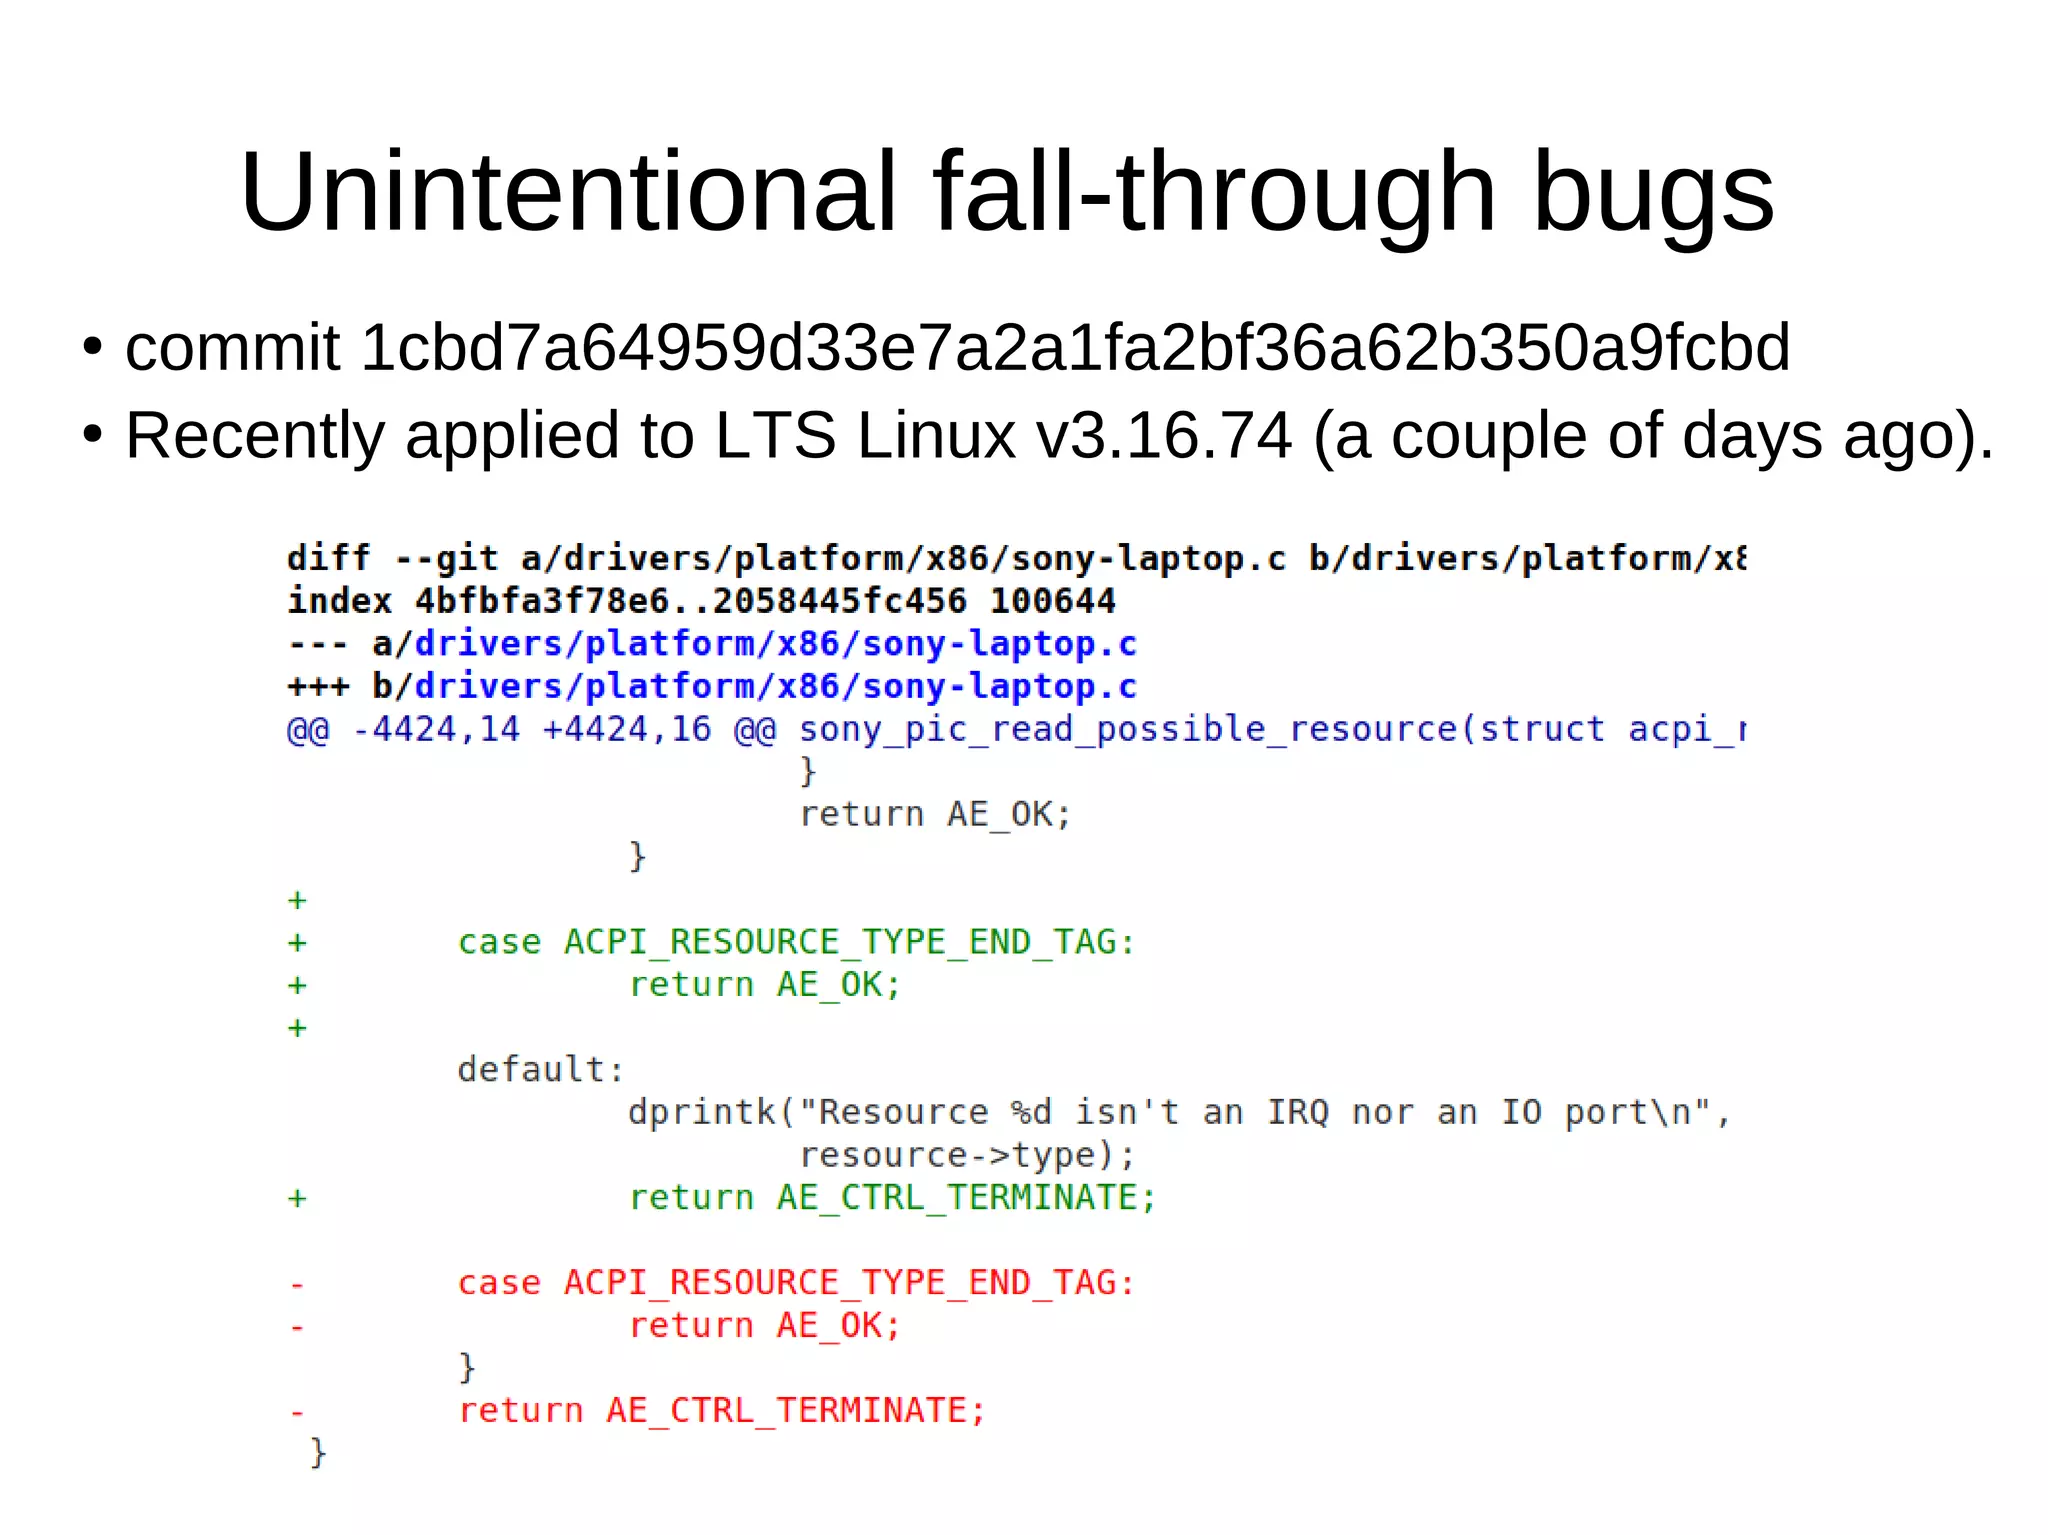
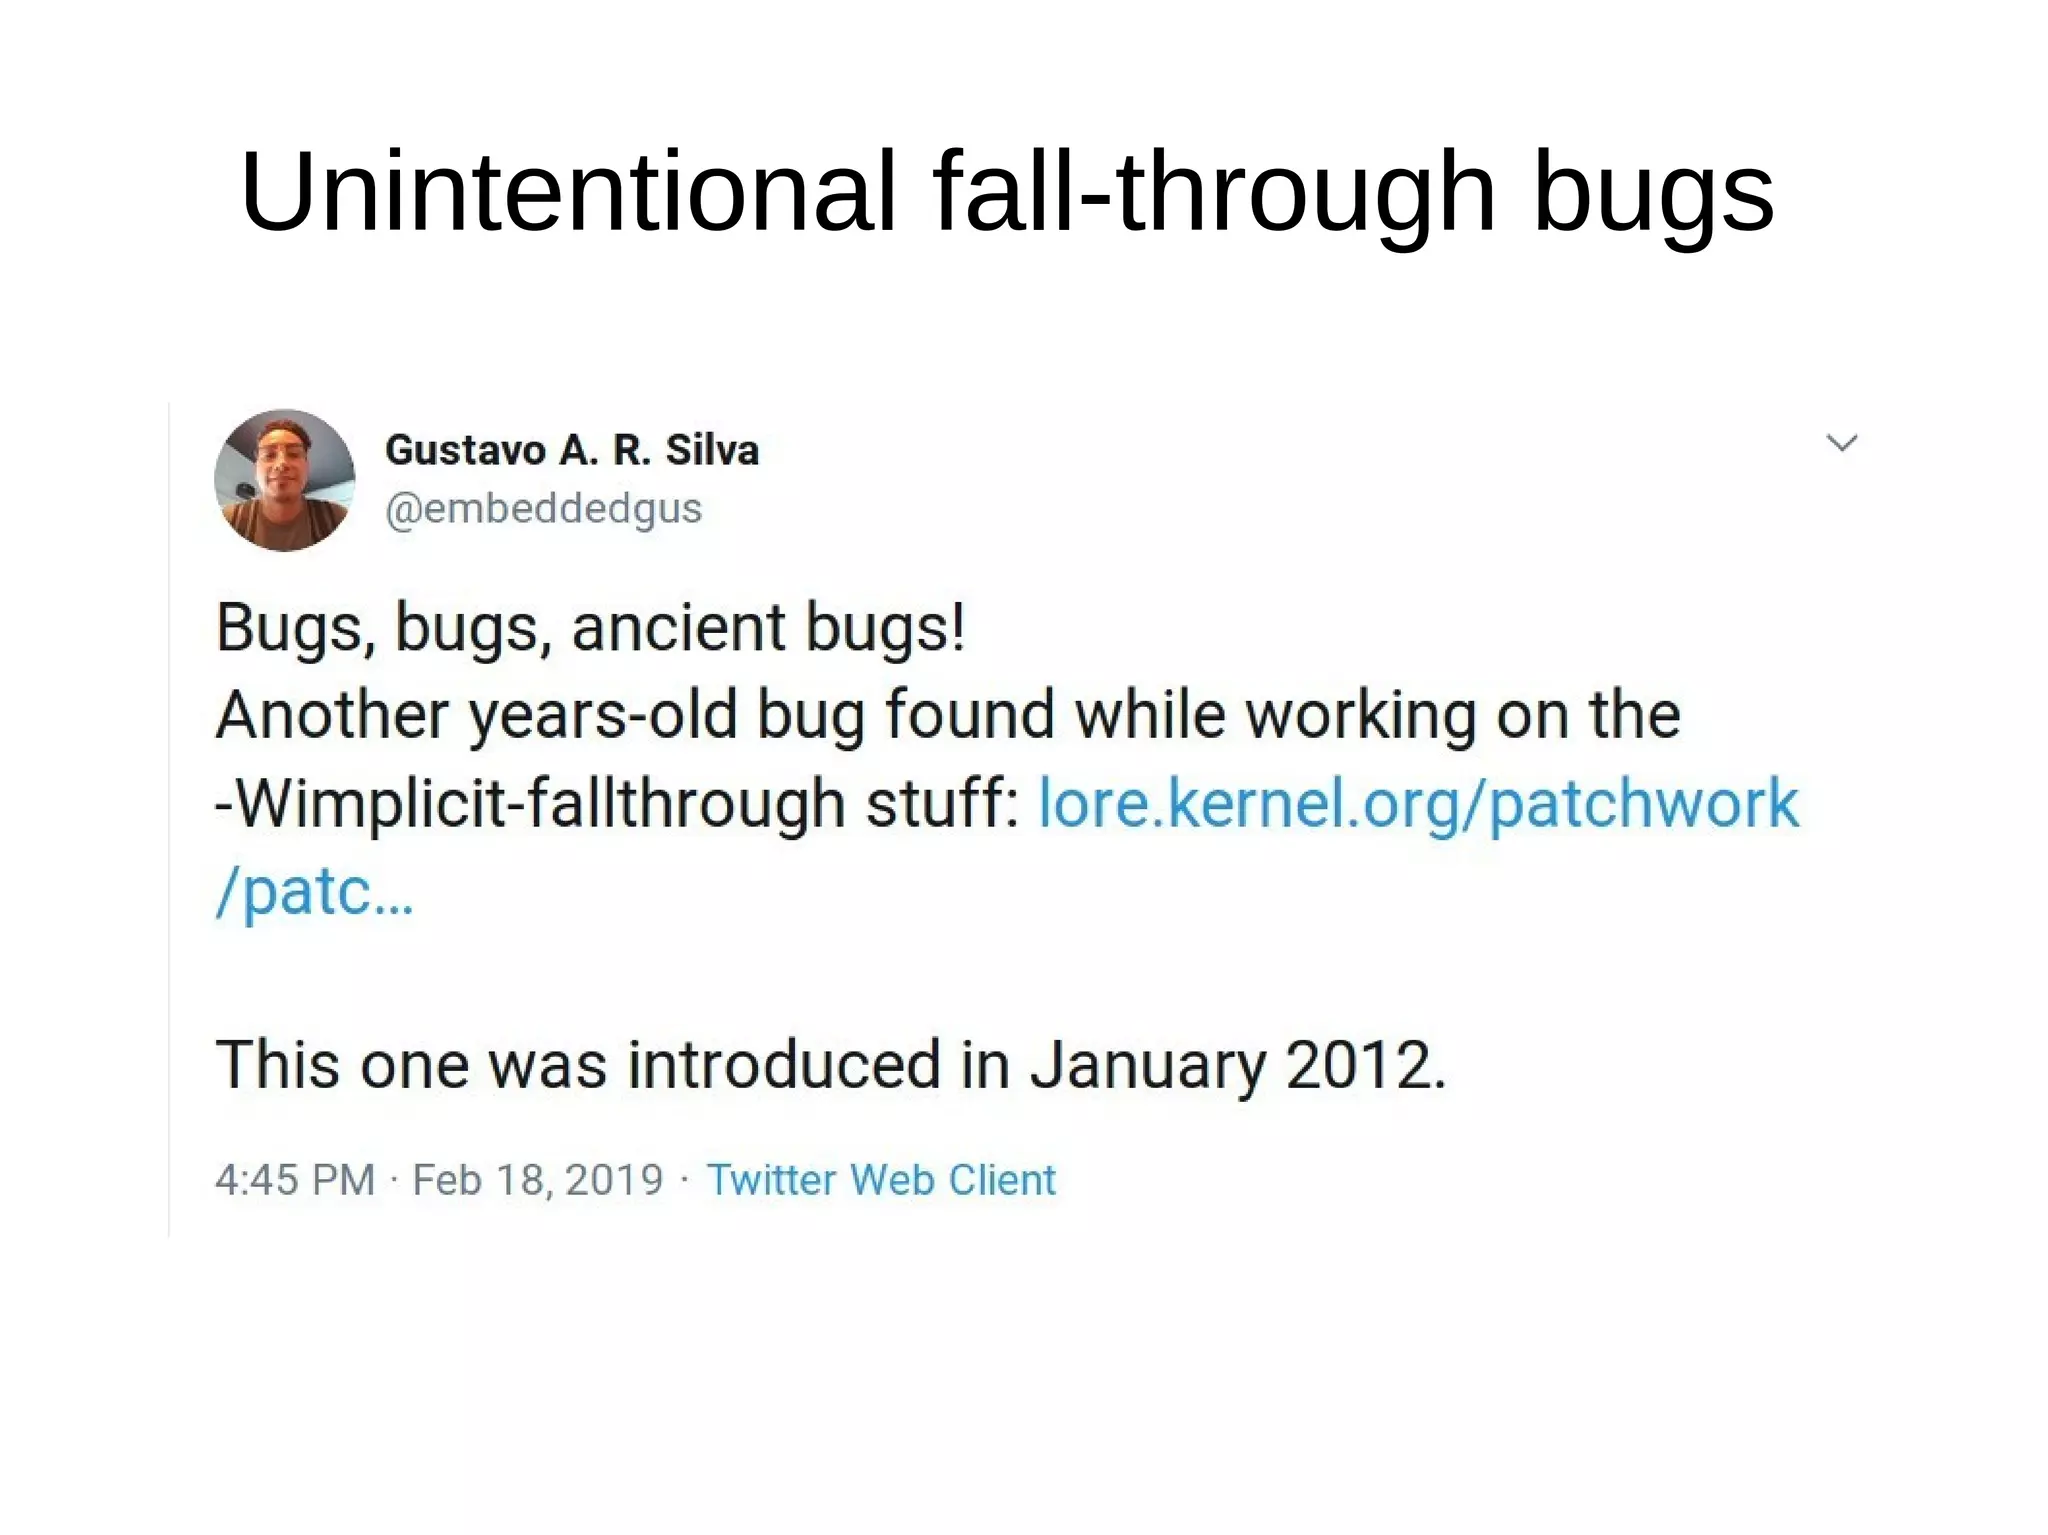
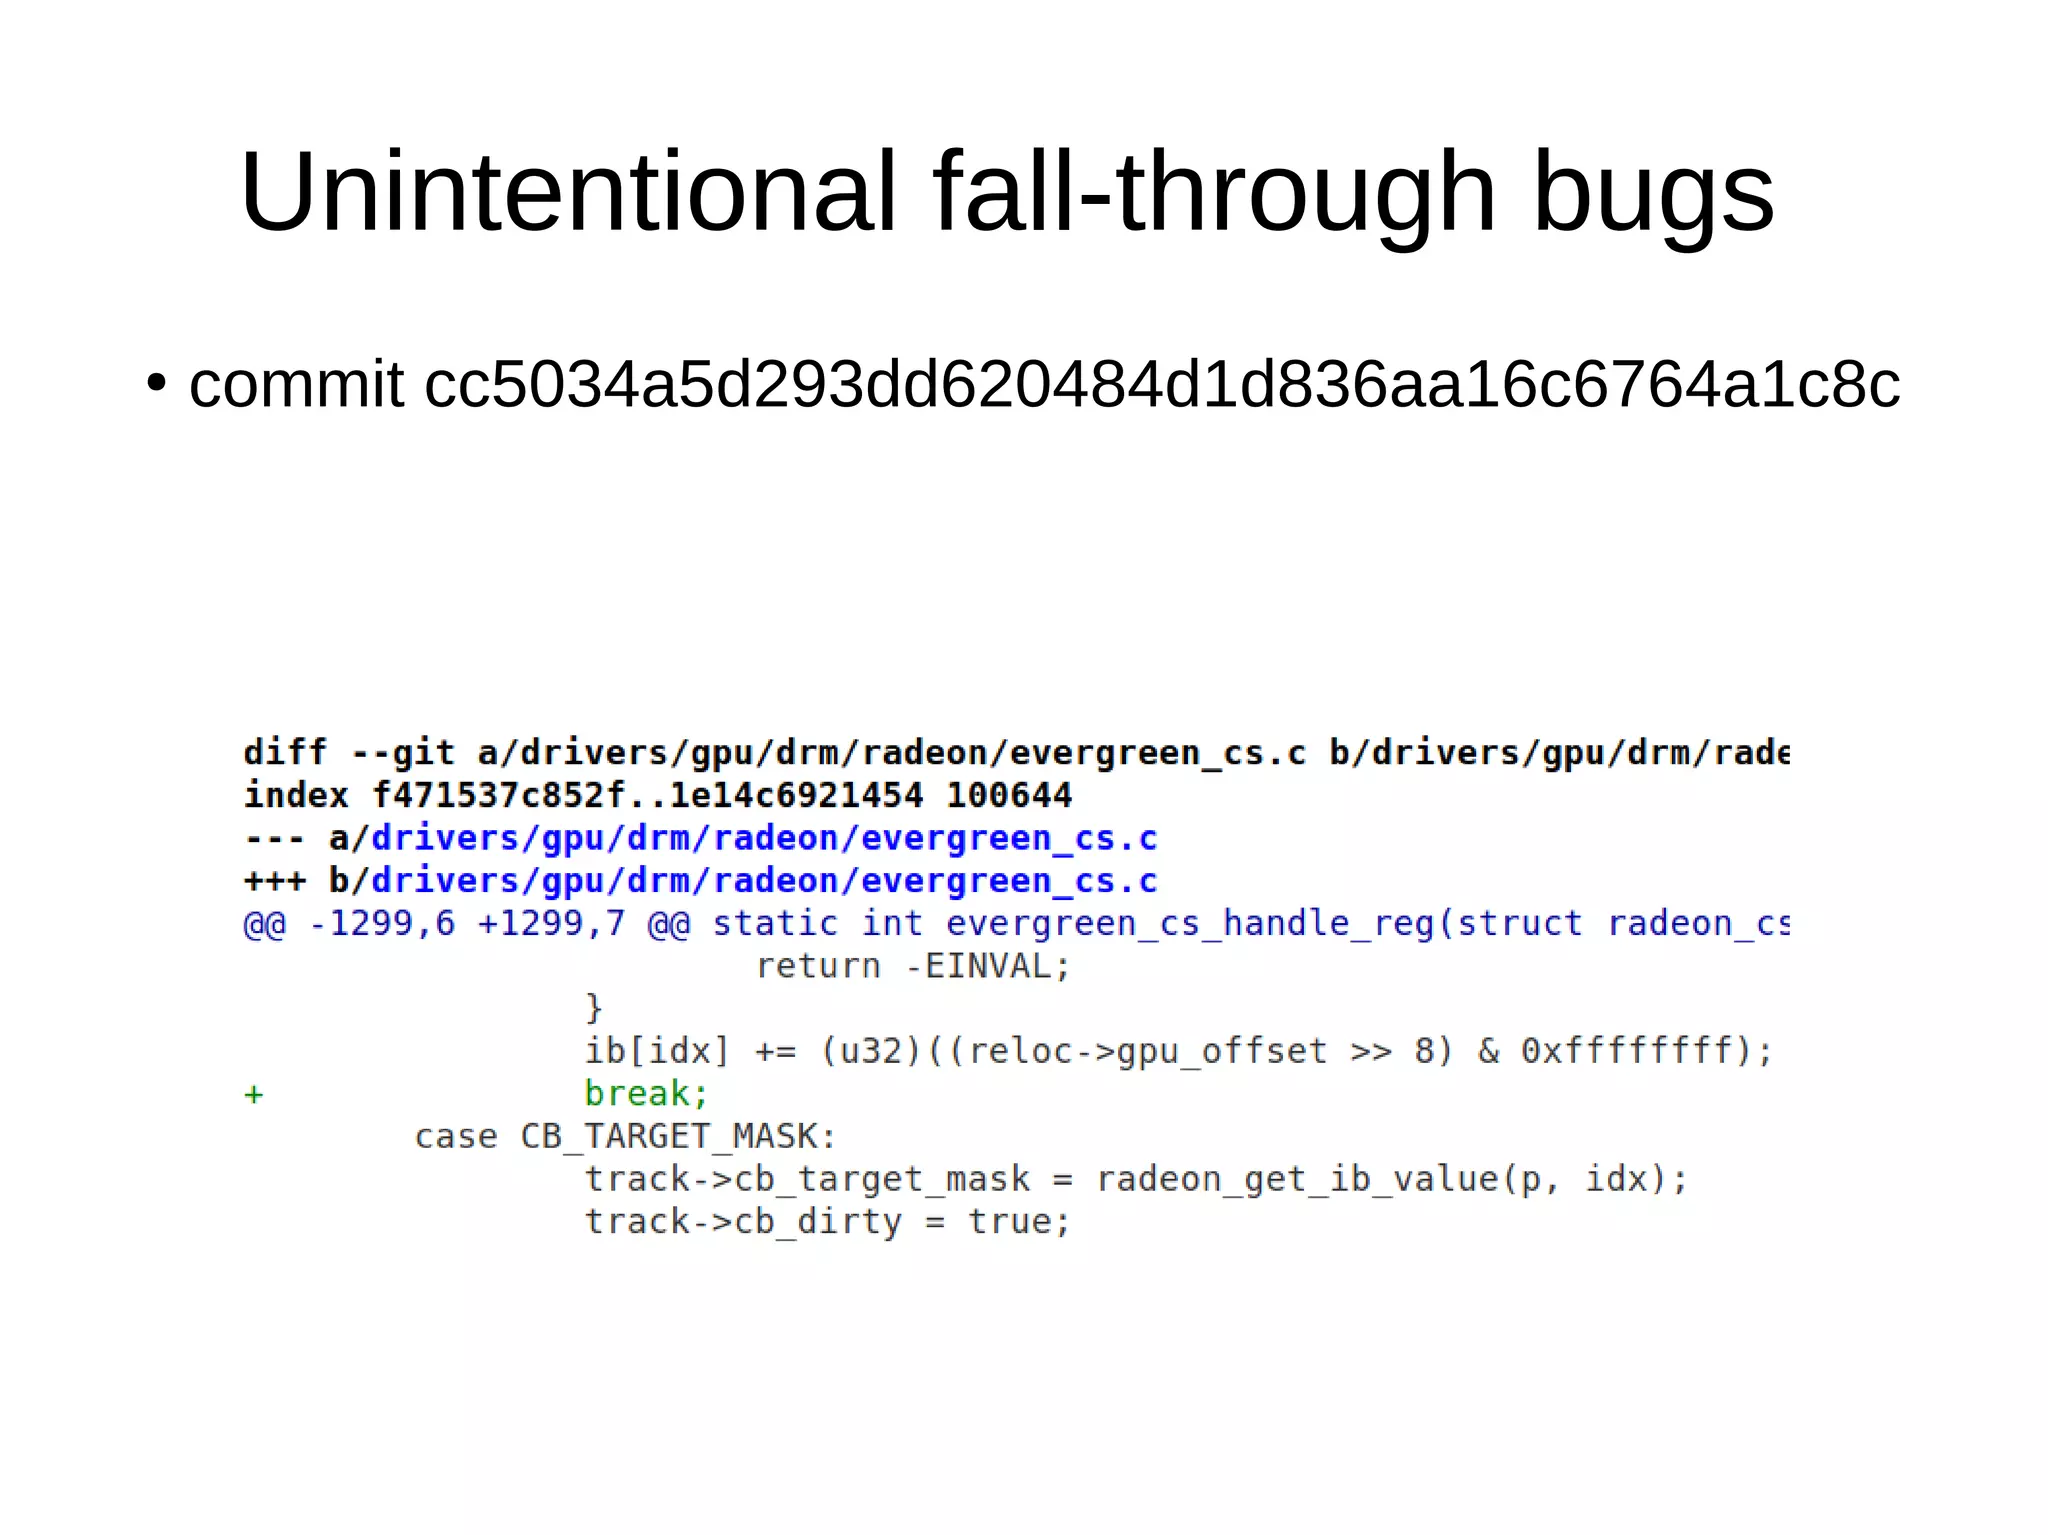
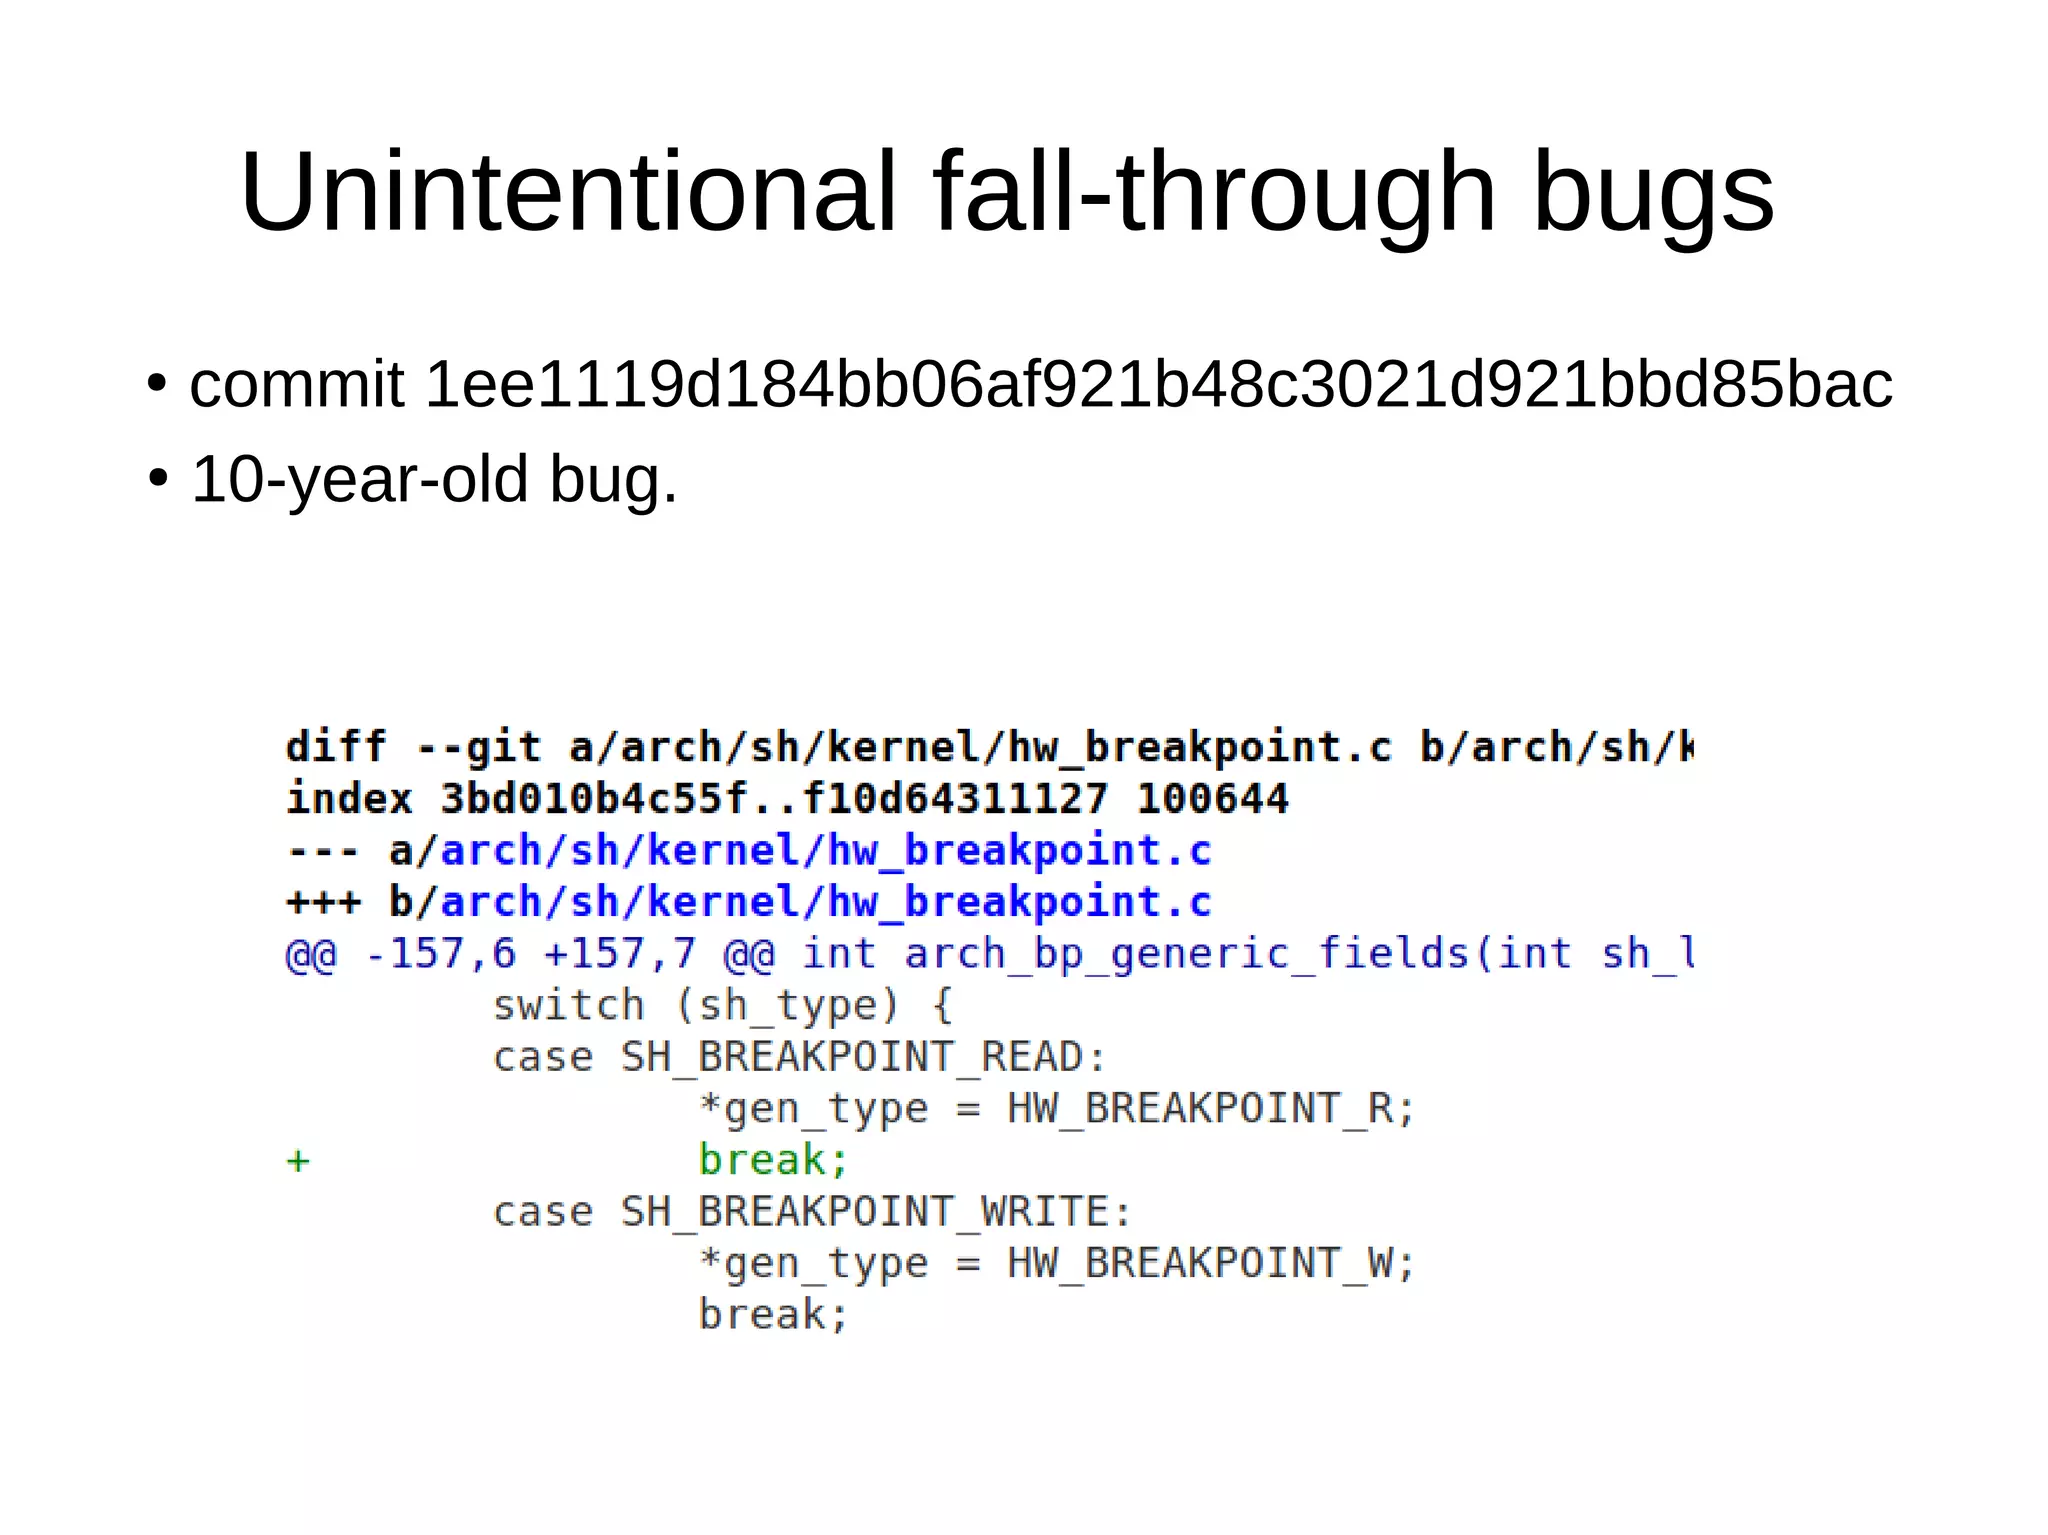
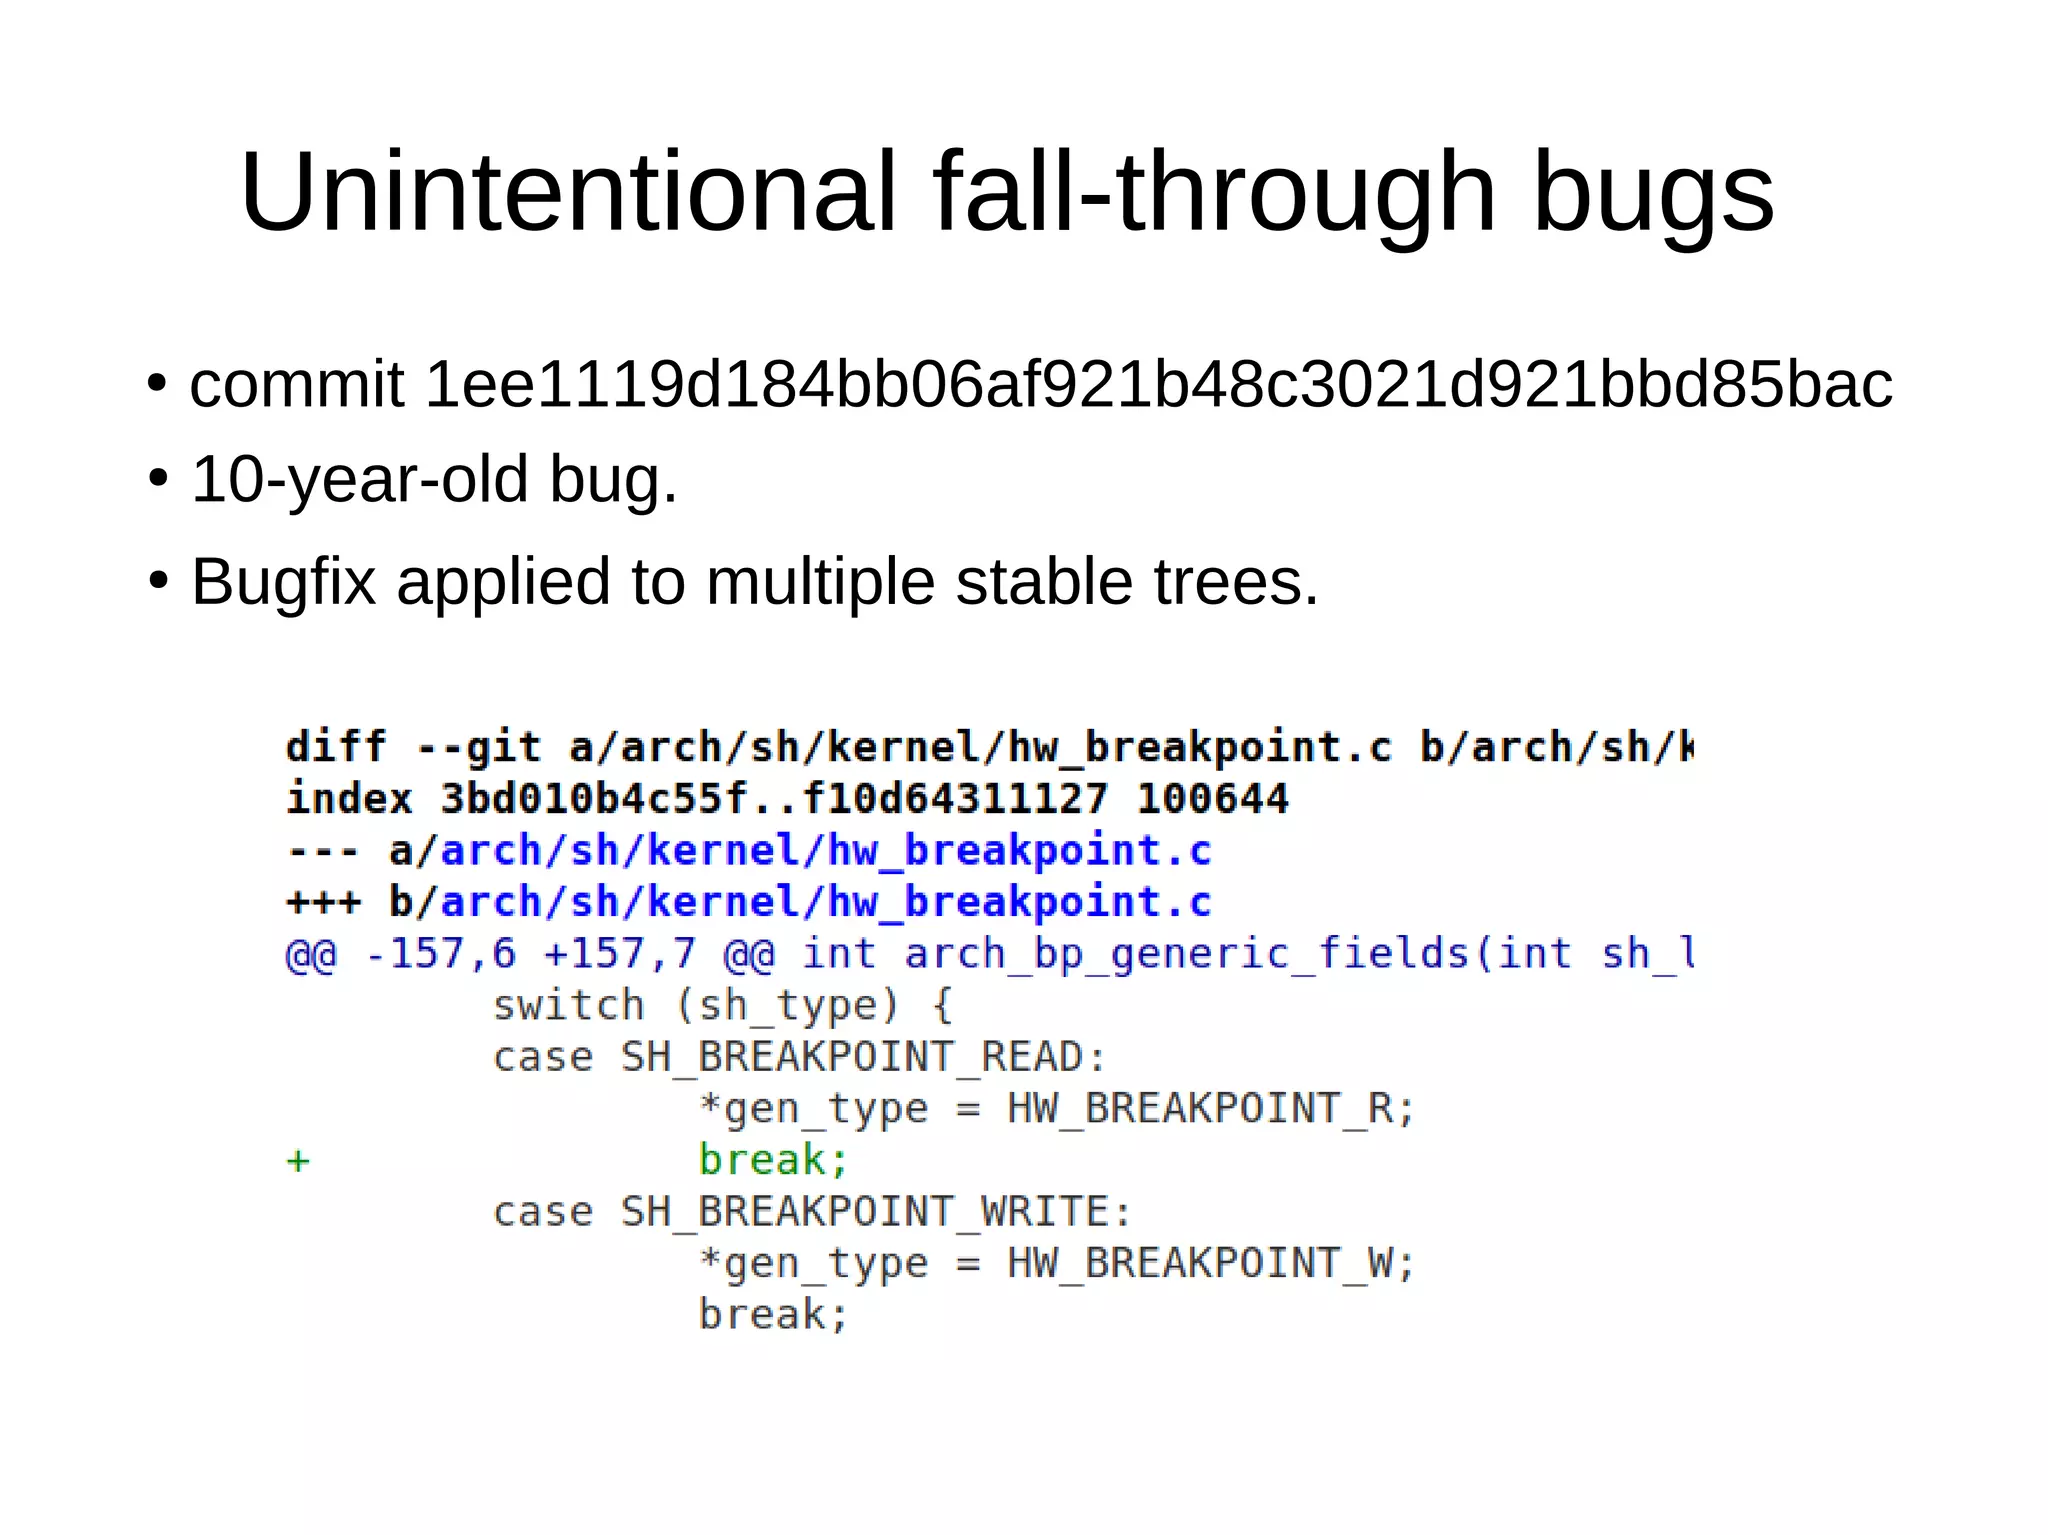
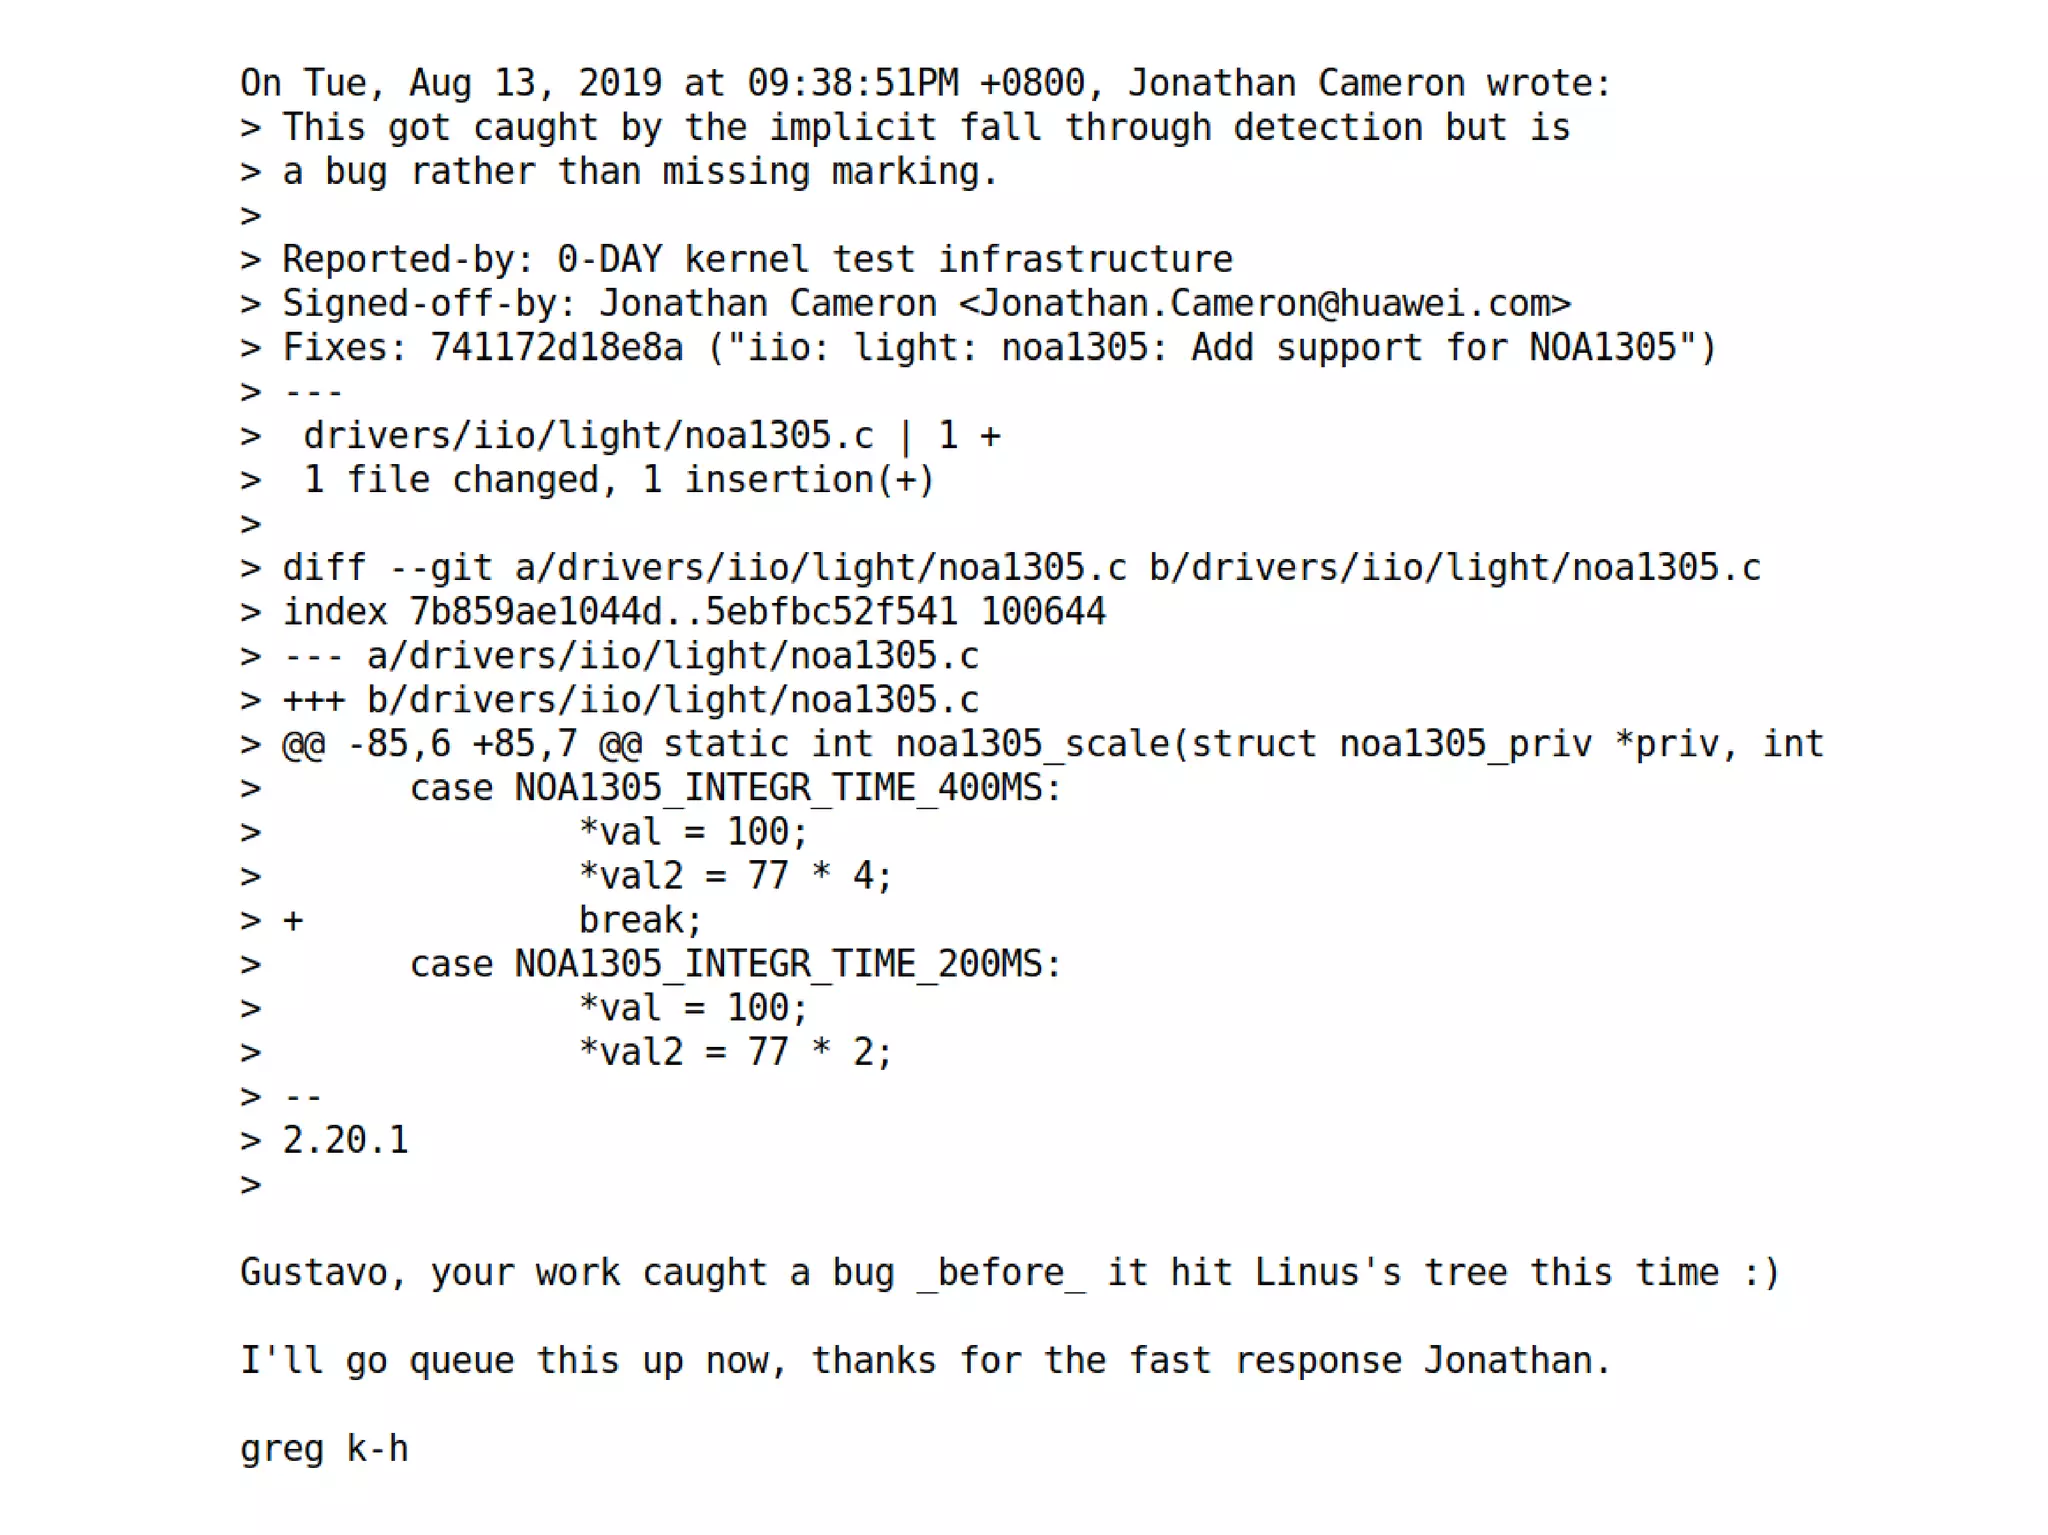
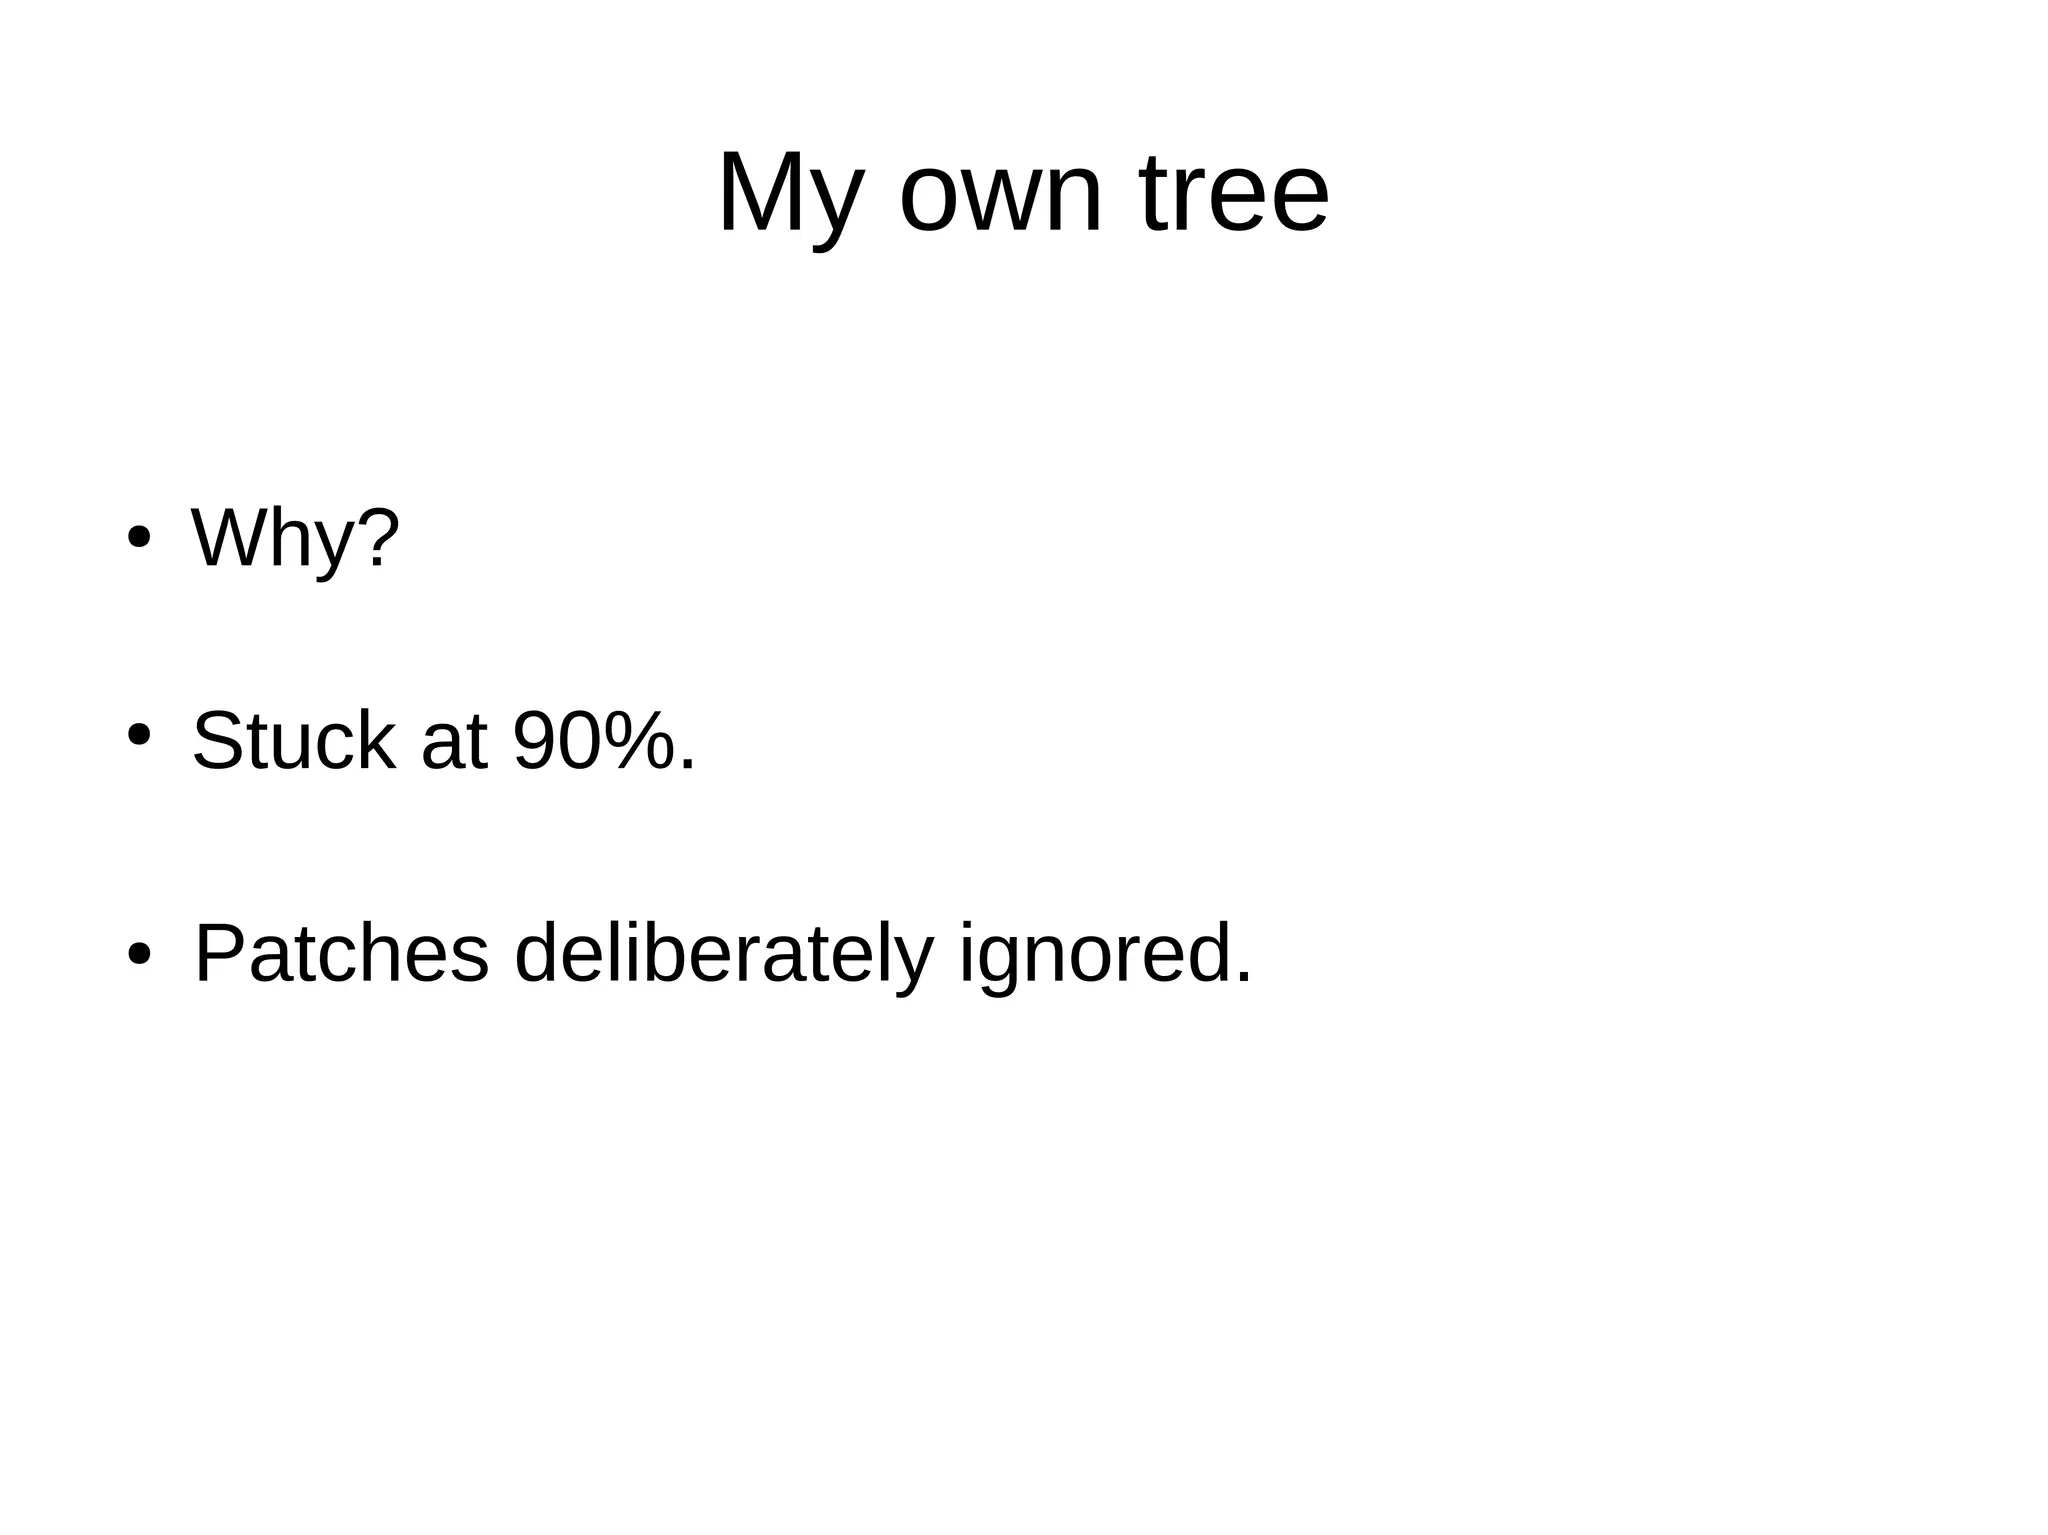
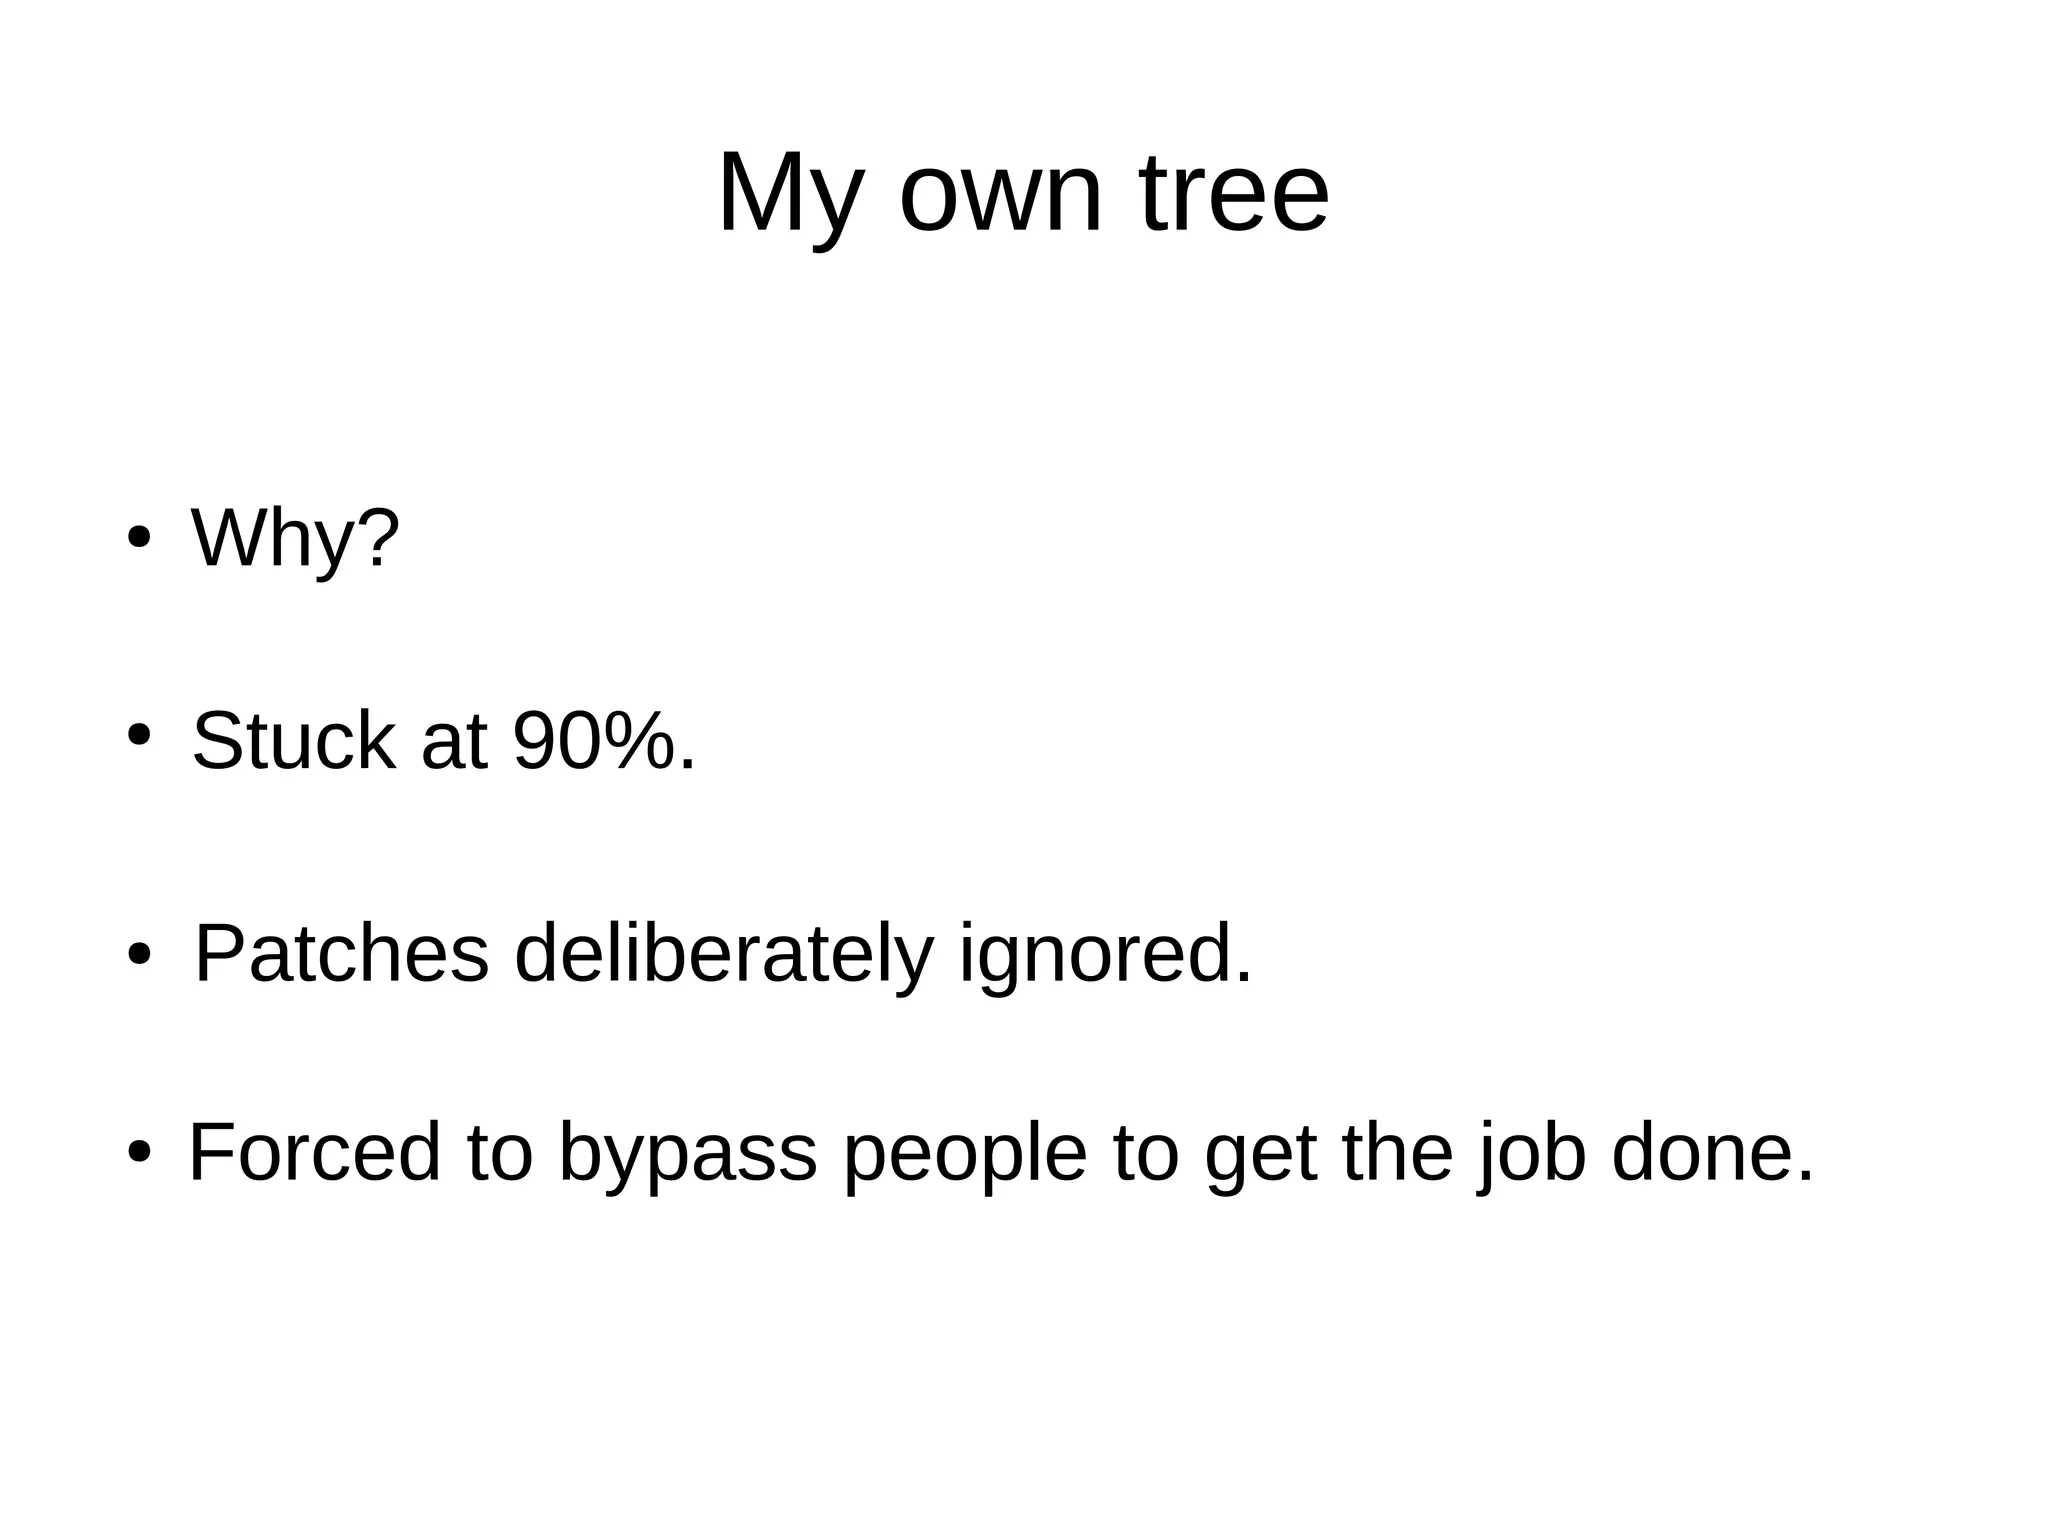
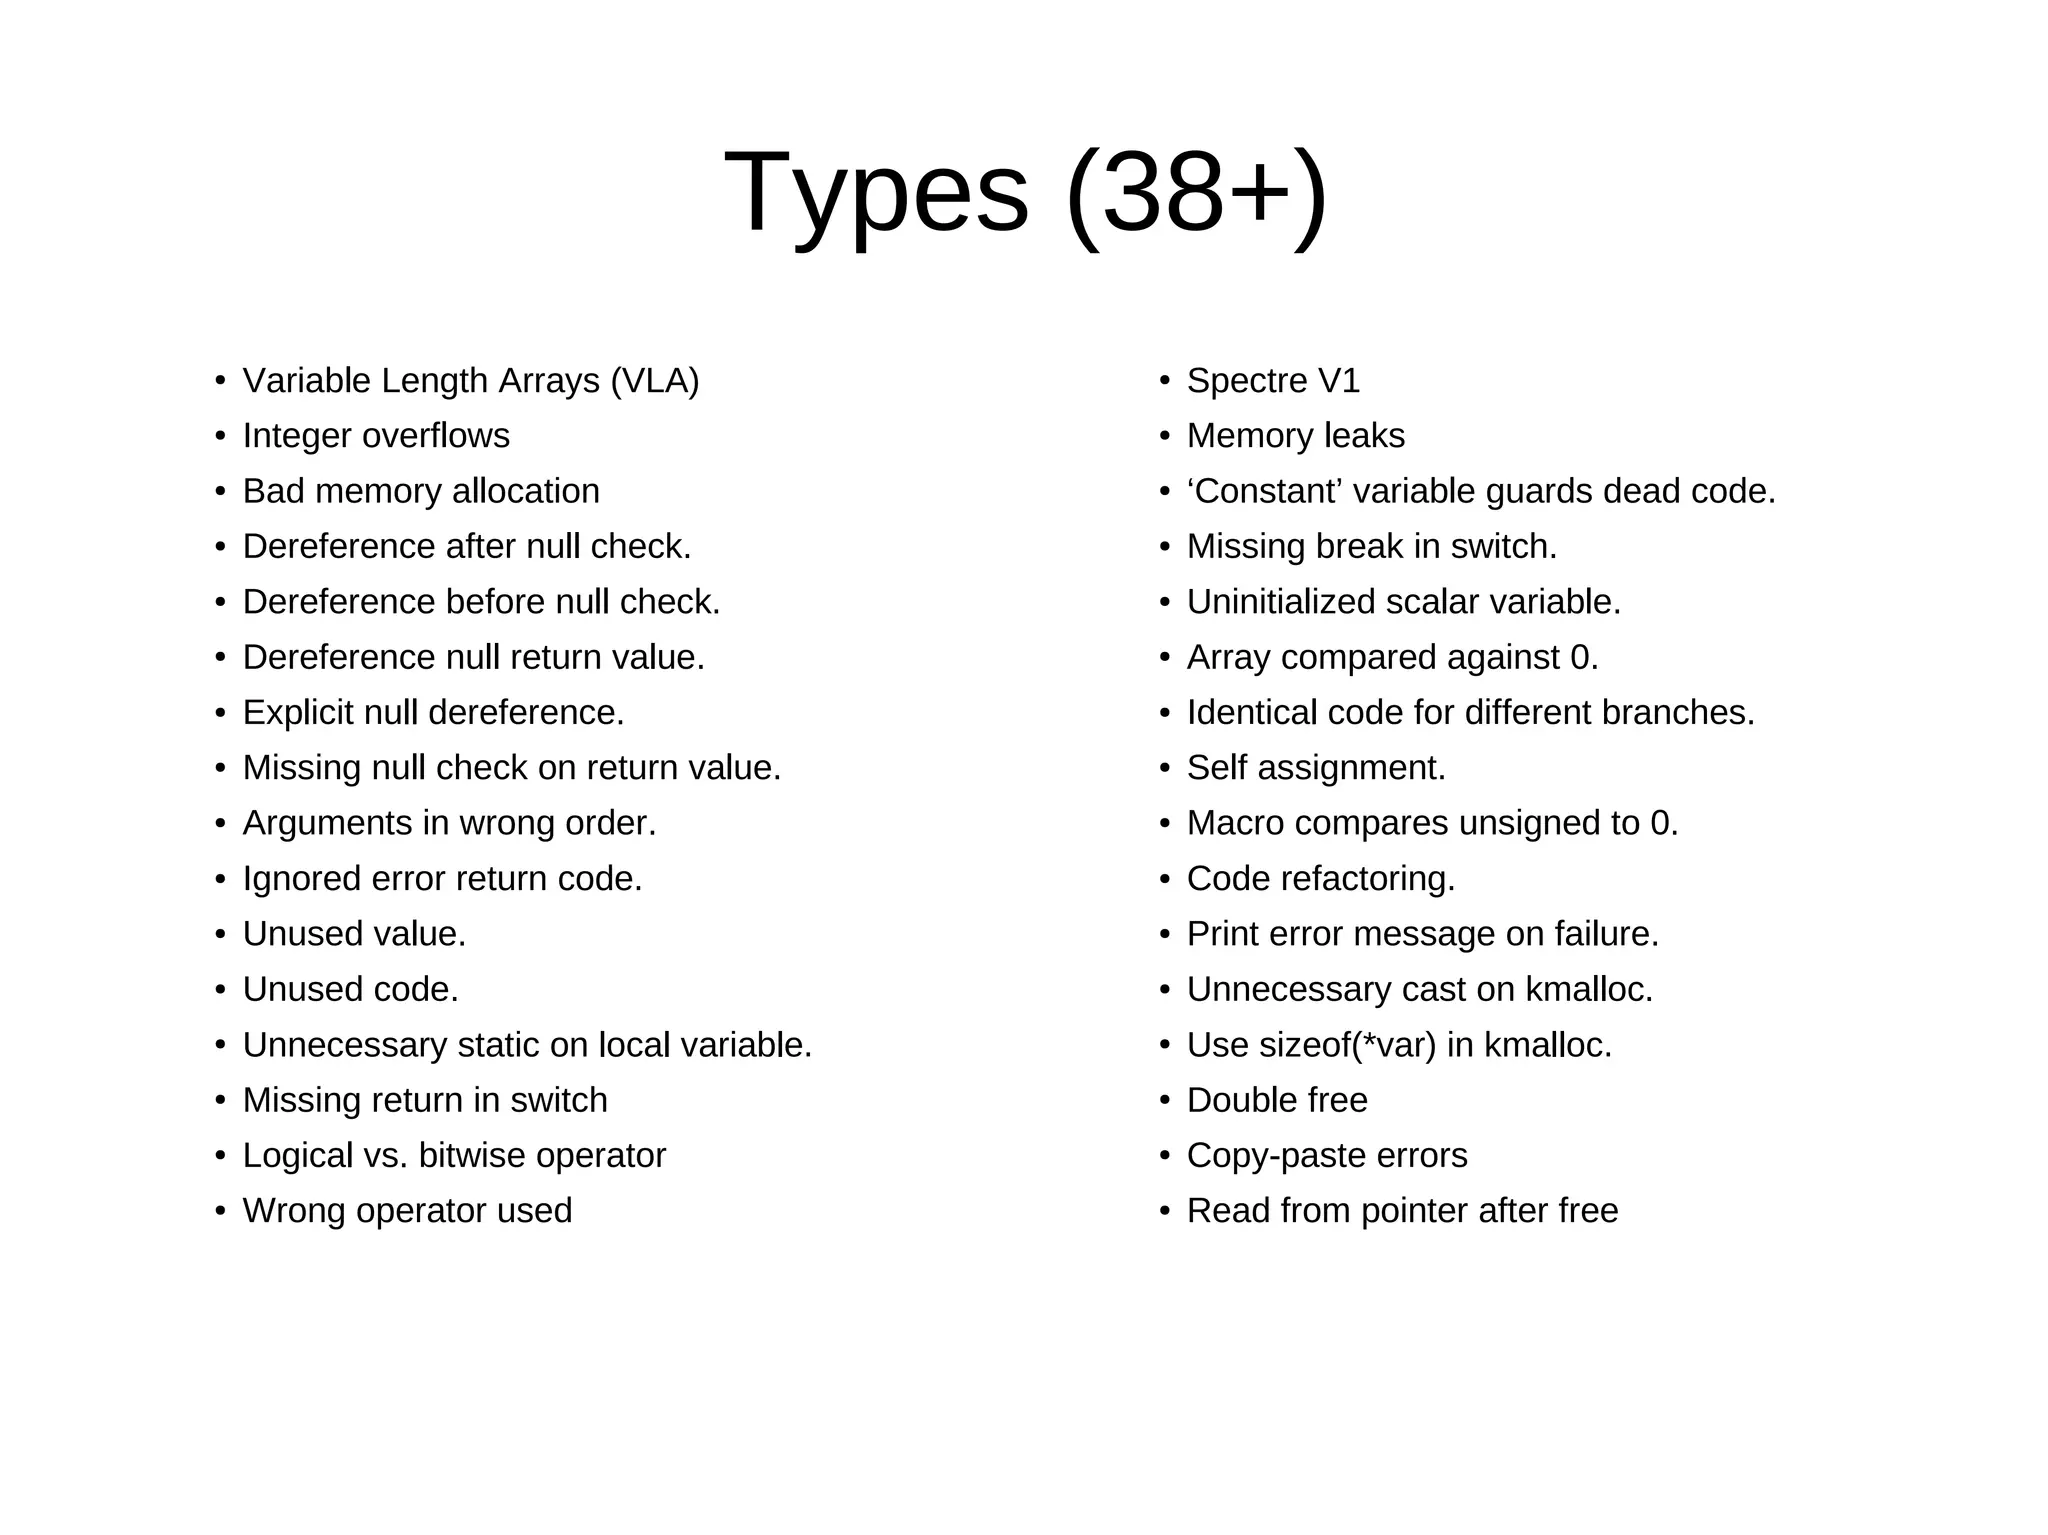
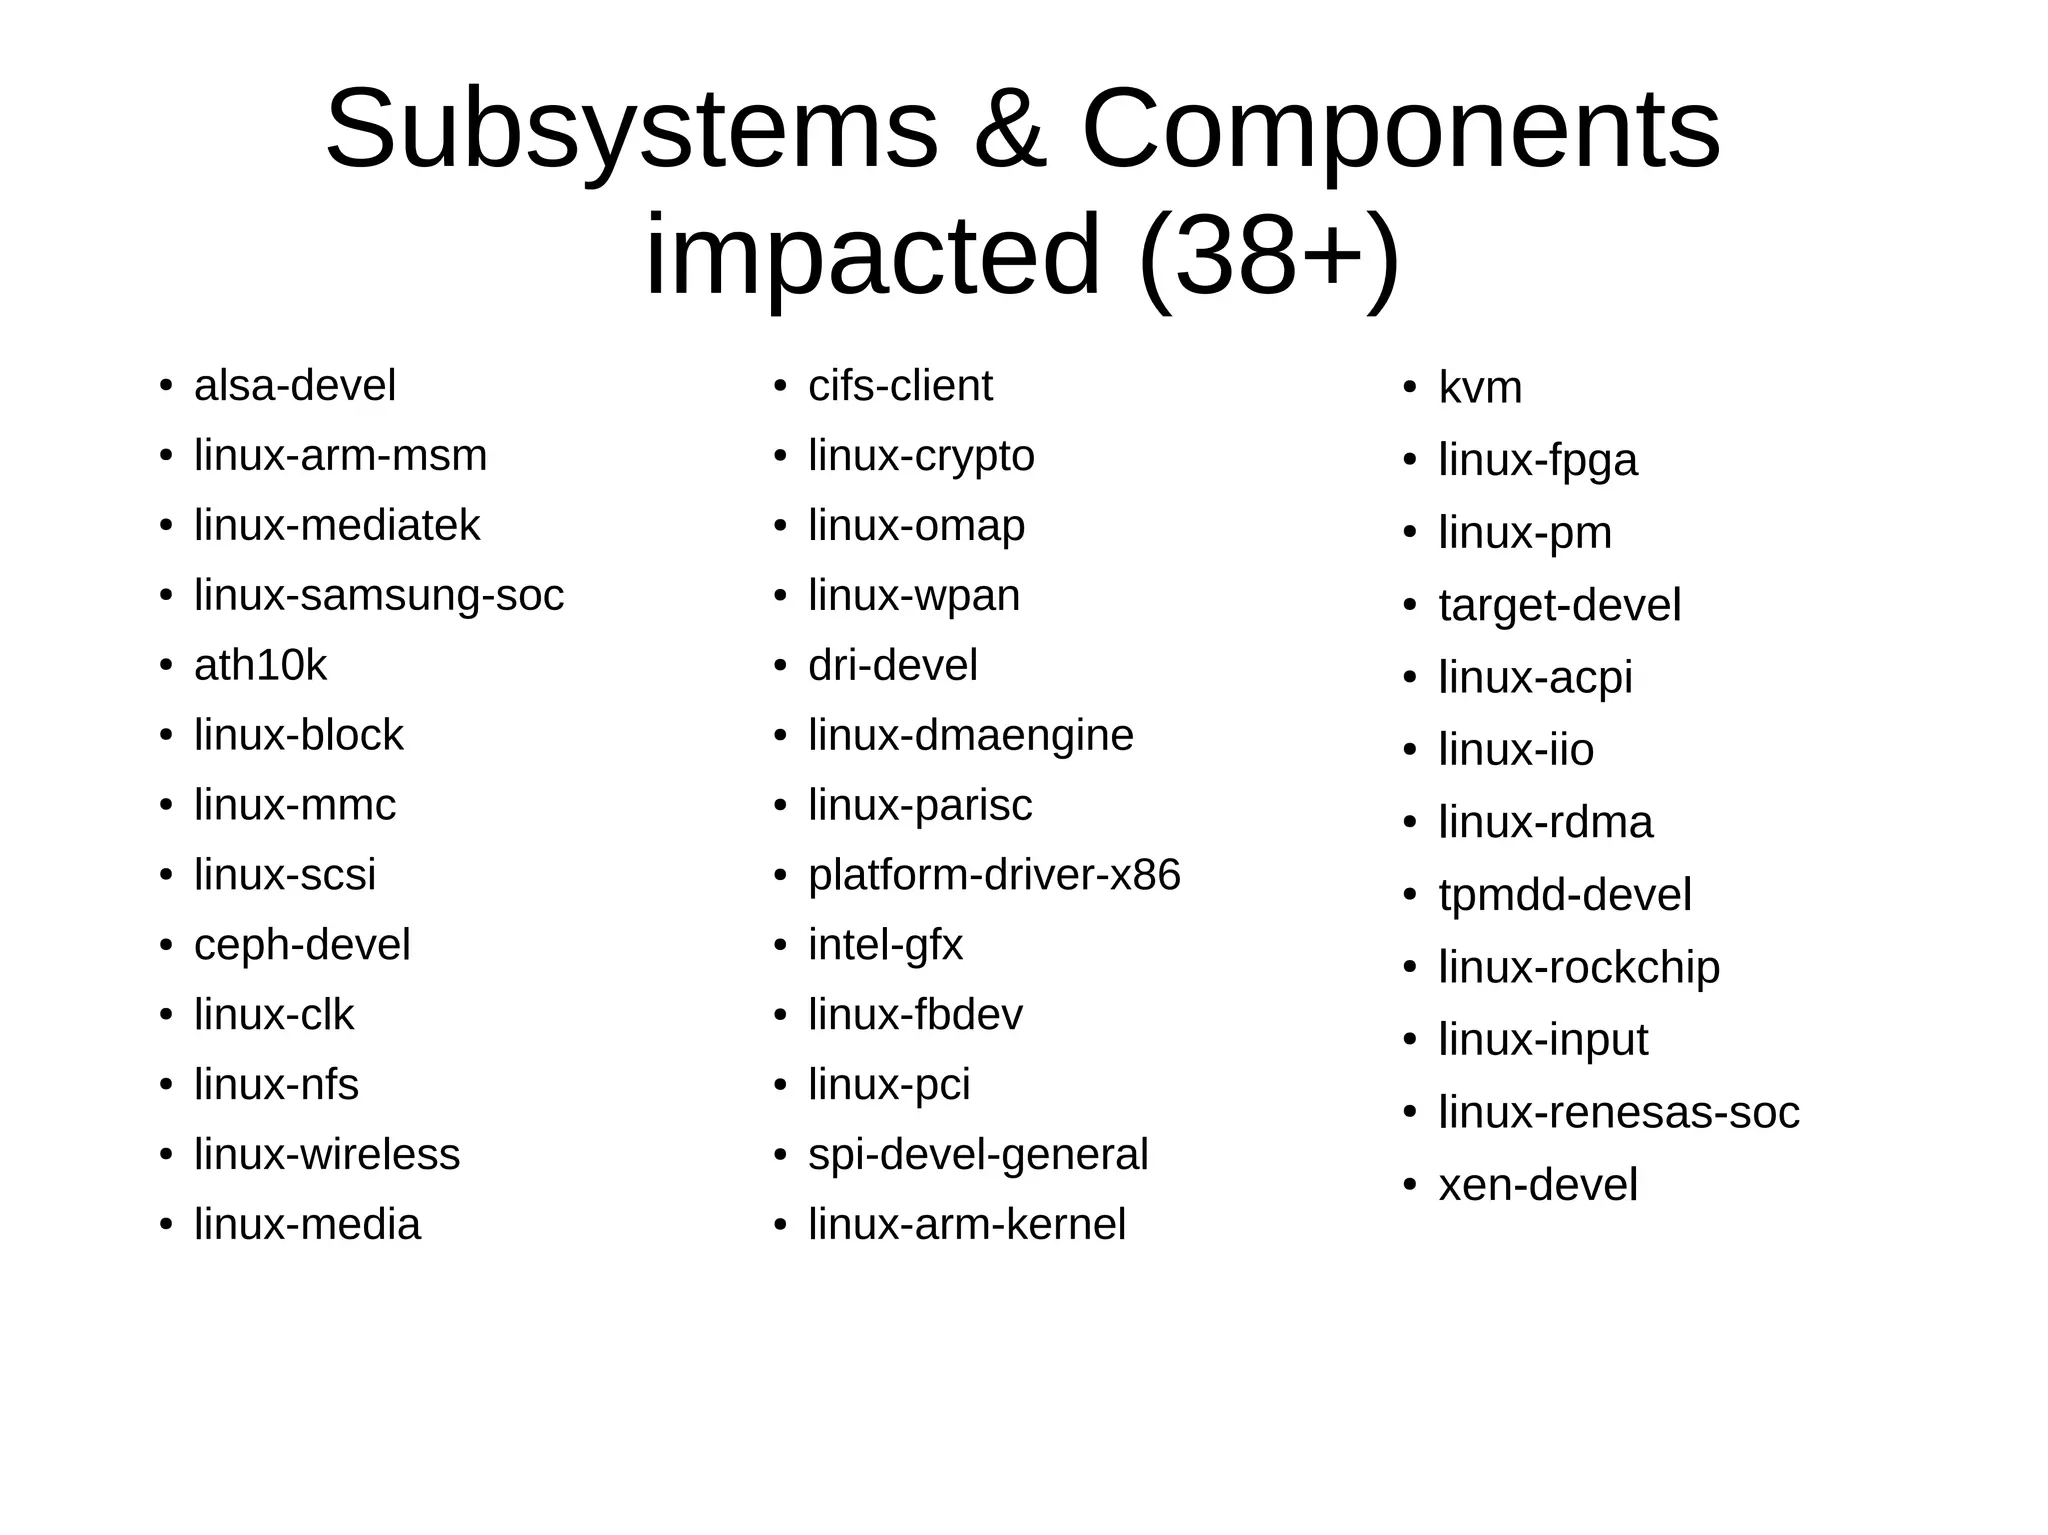
The document discusses Gustavo A. R. Silva's experiences in identifying and fixing bugs in the Linux kernel, emphasizing the use of Coverity for static code analysis to address both high and medium impact issues. It also highlights challenges, such as the significant number of warnings generated by the '-wimplicit-fallthrough' compiler flag, and describes efforts to eliminate ancient bugs and improve kernel self-protection mechanisms. Additionally, it touches on the balance between fixing bugs and maintaining the integrity of the codebase amidst community responses to proposed changes.


![[ROOTCON13] Pilot Study on Semi-Automated Patch Diffing by Applying Machine-L...](https://cdn.slidesharecdn.com/ss_thumbnails/rootcon-200517103713-thumbnail.jpg?width=640&height=640&fit=bounds)


