Download as PDF, PPTX


![The Function Tracer
# echo function > current_tracer
# cat trace
# tracer: function
#
# entries-in-buffer/entries-written: 205061/4300296 #P:4
#
# _-----=> irqs-off
# / _----=> need-resched
# | / _---=> hardirq/softirq
# || / _--=> preempt-depth
# ||| / delay
# TASK-PID CPU# |||| TIMESTAMP FUNCTION
# | | | |||| | |
Timer-11765 [002] d... 1193197.836818: irq_enter <-smp_apic_timer_interrupt
Timer-11765 [002] d... 1193197.836818: rcu_irq_enter <-irq_enter
Timer-11765 [002] d.h. 1193197.836818: local_apic_timer_interrupt <-smp_apic_timer_interrup
Timer-11765 [002] d.h. 1193197.836819: hrtimer_interrupt <-smp_apic_timer_interrupt
Timer-11765 [002] d.h. 1193197.836819: _raw_spin_lock <-hrtimer_interrupt
Timer-11765 [002] d.h. 1193197.836819: ktime_get_update_offsets_now <-hrtimer_interrupt
Timer-11765 [002] d.h. 1193197.836819: __hrtimer_run_queues <-hrtimer_interrupt
Timer-11765 [002] d.h. 1193197.836820: __remove_hrtimer <-__hrtimer_run_queues
Timer-11765 [002] d.h. 1193197.836820: tick_sched_timer <-__hrtimer_run_queues
Timer-11765 [002] d.h. 1193197.836820: ktime_get <-tick_sched_timer
Timer-11765 [002] d.h. 1193197.836820: tick_sched_do_timer <-tick_sched_timer
Timer-11765 [002] d.h. 1193197.836821: tick_do_update_jiffies64.part.12 <-tick_sched_timer
Timer-11765 [002] d.h. 1193197.836821: _raw_spin_lock <-tick_do_update_jiffies64.part.12
Timer-11765 [002] d.h. 1193197.836821: do_timer <-tick_do_update_jiffies64.part.12`](https://image.slidesharecdn.com/understanding-linux-ftrace-kernel-recipes-2017-171007150617/85/Kernel-Recipes-2017-Understanding-the-Linux-kernel-via-ftrace-Steven-Rostedt-12-320.jpg)


![set_ftrace_filter
# echo schedule > set_ftrace_filter
# echo function > current_tracer
# cat trace
# tracer: function
#
# entries-in-buffer/entries-written: 43340/43340 #P:4
#
# _-----=> irqs-off
# / _----=> need-resched
# | / _---=> hardirq/softirq
# || / _--=> preempt-depth
# ||| / delay
# TASK-PID CPU# |||| TIMESTAMP FUNCTION
# | | | |||| | |
<idle>-0 [001] .N.. 18377.251971: schedule <-schedule_preempt_disabled
irq/30-iwlwifi-399 [001] .... 18377.251996: schedule <-irq_thread
<idle>-0 [003] .N.. 18377.251997: schedule <-schedule_preempt_disabled
http-26069 [003] .... 18377.252079: schedule <-schedule_hrtimeout_range_clock
<idle>-0 [000] .N.. 18377.252175: schedule <-schedule_preempt_disabled
bash-2605 [002] .... 18377.252178: schedule <-schedule_hrtimeout_range_clock
<idle>-0 [003] .N.. 18377.252184: schedule <-schedule_preempt_disabled
<...>-26630 [000] .... 18377.252185: schedule <-worker_thread
<idle>-0 [001] .N.. 18377.252186: schedule <-schedule_preempt_disabled
hp-systray-2469 [003] .... 18377.252220: schedule <-schedule_hrtimeout_range_clock
gnome-terminal--2485 [001] .... 18377.252246: schedule <-schedule_hrtimeout_range_clock
<idle>-0 [003] .N.. 18377.253933: schedule <-schedule_preempt_disabled
rcu_sched-7 [003] .... 18377.253938: schedule <-rcu_gp_kthread
<idle>-0 [002] .N.. 18377.255098: schedule <-schedule_preempt_disabled](https://image.slidesharecdn.com/understanding-linux-ftrace-kernel-recipes-2017-171007150617/85/Kernel-Recipes-2017-Understanding-the-Linux-kernel-via-ftrace-Steven-Rostedt-20-320.jpg)
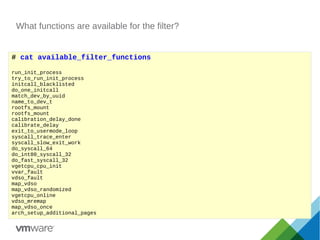
![set_ftrace_pid
# echo 0 > tracing_on
# echo function > current_tracer
# sh -c 'echo $$ > set_ftrace_pid; echo 1 > tracing_on;
> exec echo hello'
# cat trace
# tracer: function
#
# entries-in-buffer/entries-written: 16309/16309 #P:4
#
# _-----=> irqs-off
# / _----=> need-resched
# | / _---=> hardirq/softirq
# || / _--=> preempt-depth
# ||| / delay
# TASK-PID CPU# |||| TIMESTAMP FUNCTION
# | | | |||| | |
echo-26916 [000] .... 18924.157145: mutex_unlock <-rb_simple_write
echo-26916 [000] .... 18924.157147: __fsnotify_parent <-vfs_write
echo-26916 [000] .... 18924.157148: fsnotify <-vfs_write
echo-26916 [000] .... 18924.157148: __sb_end_write <-vfs_write
echo-26916 [000] .... 18924.157153: SyS_dup2 <-system_call_fast_compare_end
echo-26916 [000] .... 18924.157154: _raw_spin_lock <-SyS_dup2
echo-26916 [000] .... 18924.157154: expand_files <-SyS_dup2
echo-26916 [000] .... 18924.157155: do_dup2 <-SyS_dup2
echo-26916 [000] .... 18924.157155: filp_close <-do_dup2
echo-26916 [000] .... 18924.157156: dnotify_flush <-filp_close
echo-26916 [000] .... 18924.157156: locks_remove_posix <-filp_close
echo-26916 [000] .... 18924.157156: fput <-filp_close
echo-26916 [000] .... 18924.157157: task_work_add <-fput
echo-26916 [000] .... 18924.157157: kick_process <-task_work_add](https://image.slidesharecdn.com/understanding-linux-ftrace-kernel-recipes-2017-171007150617/85/Kernel-Recipes-2017-Understanding-the-Linux-kernel-via-ftrace-Steven-Rostedt-22-320.jpg)
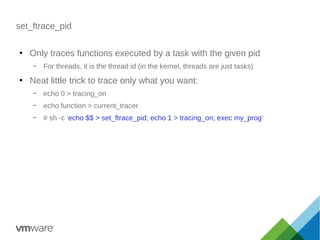
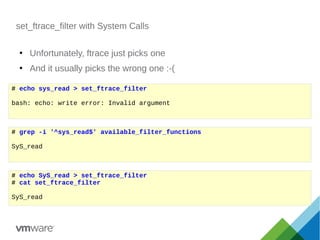
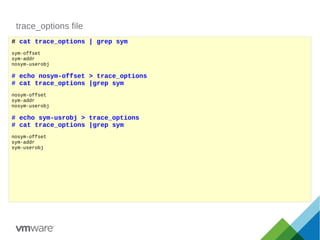
![System Call Functions (hack mode)
●
System calls like read(), write() and open()
●
The kernel has special wrappers for them
– SYSCALL_DEFINE[0-6]
– For sign extension of system call arguments
●
Appends “sys_”, sys_read(), sys_write() and sys_open()
●
But also uses an alias SyS_read(), SyS_write() and SyS_open()
SYSCALL_DEFINE3(read, unsigned int, fd, char __user *, buf, size_t, count)
# grep -i ' sys_read$' /proc/kallsyms
ffffffffbd4032a0 T SyS_read
ffffffffbd4032a0 T sys_read](https://image.slidesharecdn.com/understanding-linux-ftrace-kernel-recipes-2017-171007150617/85/Kernel-Recipes-2017-Understanding-the-Linux-kernel-via-ftrace-Steven-Rostedt-23-320.jpg)


![set_graph_function
# echo SyS_read > set_graph_function
# echo function_graph > current_tracer
# cat trace
# tracer: function_graph
#
# CPU DURATION FUNCTION CALLS
# | | | | | | |
2) + 12.716 us | } /* vfs_read */
2) + 14.387 us | } /* SyS_read */
2) | SyS_read() {
2) | __fdget_pos() {
2) 0.043 us | __fget_light();
2) 0.439 us | }
2) | vfs_read() {
2) | rw_verify_area() {
2) | security_file_permission() {
2) 0.037 us | __fsnotify_parent();
2) 0.064 us | fsnotify();
2) 0.724 us | }
2) 1.023 us | }
2) | __vfs_read() {
2) | new_sync_read() {
2) | xfs_file_read_iter [xfs]() {
2) | xfs_file_buffered_aio_read [xfs]() {
2) | xfs_ilock [xfs]() {
2) | down_read() {
2) 0.042 us | _cond_resched();
2) 0.509 us | }](https://image.slidesharecdn.com/understanding-linux-ftrace-kernel-recipes-2017-171007150617/85/Kernel-Recipes-2017-Understanding-the-Linux-kernel-via-ftrace-Steven-Rostedt-33-320.jpg)
![set_graph_function
# echo SyS_read > set_graph_function
# echo function_graph > current_tracer
# cat trace
# tracer: function_graph
#
# CPU DURATION FUNCTION CALLS
# | | | | | | |
2) + 12.716 us | } /* vfs_read */
2) + 14.387 us | } /* SyS_read */
2) | SyS_read() {
2) | __fdget_pos() {
2) 0.043 us | __fget_light();
2) 0.439 us | }
2) | vfs_read() {
2) | rw_verify_area() {
2) | security_file_permission() {
2) 0.037 us | __fsnotify_parent();
2) 0.064 us | fsnotify();
2) 0.724 us | }
2) 1.023 us | }
2) | __vfs_read() {
2) | new_sync_read() {
2) | xfs_file_read_iter [xfs]() {
2) | xfs_file_buffered_aio_read [xfs]() {
2) | xfs_ilock [xfs]() {
2) | down_read() {
2) 0.042 us | _cond_resched();
2) 0.509 us | }](https://image.slidesharecdn.com/understanding-linux-ftrace-kernel-recipes-2017-171007150617/85/Kernel-Recipes-2017-Understanding-the-Linux-kernel-via-ftrace-Steven-Rostedt-34-320.jpg)

![set_graph_function
# echo SyS_read > set_graph_function
# echo function_graph > current_tracer
# cat trace
# tracer: function_graph
#
# CPU DURATION FUNCTION CALLS
# | | | | | | |
2) + 12.716 us | } /* vfs_read */
2) + 14.387 us | } /* SyS_read */
2) | SyS_read() {
2) | __fdget_pos() {
2) 0.043 us | __fget_light();
2) 0.439 us | }
2) | vfs_read() {
2) | rw_verify_area() {
2) | security_file_permission() {
2) 0.037 us | __fsnotify_parent();
2) 0.064 us | fsnotify();
2) 0.724 us | }
2) 1.023 us | }
2) | __vfs_read() {
2) | new_sync_read() {
2) | xfs_file_read_iter [xfs]() {
2) | xfs_file_buffered_aio_read [xfs]() {
2) | xfs_ilock [xfs]() {
2) | down_read() {
2) 0.042 us | _cond_resched();
2) 0.509 us | }](https://image.slidesharecdn.com/understanding-linux-ftrace-kernel-recipes-2017-171007150617/85/Kernel-Recipes-2017-Understanding-the-Linux-kernel-via-ftrace-Steven-Rostedt-38-320.jpg)
![set_graph_function - filtering
2) | xfs_vn_update_time [xfs]() {
2) | xfs_trans_alloc [xfs]() {
2) | __sb_start_write() {
2) 0.075 us | _cond_resched();
2) 0.837 us | }
2) | kmem_zone_alloc [xfs]() {
2) | kmem_cache_alloc() {
2) 0.080 us | _cond_resched();
2) 0.080 us | _cond_resched();
2) 0.073 us | memcg_kmem_put_cache();
2) 2.906 us | }
2) 3.770 us | }
2) | xfs_trans_reserve [xfs]() {
2) | xfs_log_reserve [xfs]() {
2) | xlog_ticket_alloc [xfs]() {
2) | kmem_zone_alloc [xfs]() {
2) | kmem_cache_alloc() {
2) 0.069 us | _cond_resched();
2) 0.078 us | _cond_resched();
2) 0.154 us | memcg_kmem_put_cache();
2) 2.746 us | }](https://image.slidesharecdn.com/understanding-linux-ftrace-kernel-recipes-2017-171007150617/85/Kernel-Recipes-2017-Understanding-the-Linux-kernel-via-ftrace-Steven-Rostedt-39-320.jpg)
![set_graph_function - filtering
# echo _cond_resched > set_ftrace_notrace
# cat trace
# tracer: function_graph
#
# CPU DURATION FUNCTION CALLS
# | | | | | | |
[..]
1) | xfs_vn_update_time [xfs]() {
1) | xfs_trans_alloc [xfs]() {
1) 0.044 us | __sb_start_write();
1) | kmem_zone_alloc [xfs]() {
1) | kmem_cache_alloc() {
1) 0.029 us | memcg_kmem_put_cache();
1) 0.375 us | }
1) 0.630 us | }
1) | xfs_trans_reserve [xfs]() {
1) | xfs_log_reserve [xfs]() {
1) | xlog_ticket_alloc [xfs]() {
1) | kmem_zone_alloc [xfs]() {
1) | kmem_cache_alloc() {
1) 0.029 us | memcg_kmem_put_cache();
1) 0.330 us | }
1) 0.573 us | }
1) 0.037 us | xfs_log_calc_unit_res [xfs]();
1) 1.068 us | }
1) | xlog_grant_push_ail [xfs]() {
1) 0.030 us | xlog_space_left [xfs]();
1) 0.269 us | }
1) | xlog_grant_head_check [xfs]() {
1) 0.030 us | xlog_space_left [xfs]();](https://image.slidesharecdn.com/understanding-linux-ftrace-kernel-recipes-2017-171007150617/85/Kernel-Recipes-2017-Understanding-the-Linux-kernel-via-ftrace-Steven-Rostedt-40-320.jpg)
![set_graph_function - filtering
# echo _cond_resched > set_ftrace_notrace
# cat trace
# tracer: function_graph
#
# CPU DURATION FUNCTION CALLS
# | | | | | | |
[..]
1) | xfs_vn_update_time [xfs]() {
1) | xfs_trans_alloc [xfs]() {
1) 0.044 us | __sb_start_write();
1) | kmem_zone_alloc [xfs]() {
1) | kmem_cache_alloc() {
1) 0.029 us | memcg_kmem_put_cache();
1) 0.375 us | }
1) 0.630 us | }
1) | xfs_trans_reserve [xfs]() {
1) | xfs_log_reserve [xfs]() {
1) | xlog_ticket_alloc [xfs]() {
1) | kmem_zone_alloc [xfs]() {
1) | kmem_cache_alloc() {
1) 0.029 us | memcg_kmem_put_cache();
1) 0.330 us | }
1) 0.573 us | }
1) 0.037 us | xfs_log_calc_unit_res [xfs]();
1) 1.068 us | }
1) | xlog_grant_push_ail [xfs]() {
1) 0.030 us | xlog_space_left [xfs]();
1) 0.269 us | }
1) | xlog_grant_head_check [xfs]() {
1) 0.030 us | xlog_space_left [xfs]();](https://image.slidesharecdn.com/understanding-linux-ftrace-kernel-recipes-2017-171007150617/85/Kernel-Recipes-2017-Understanding-the-Linux-kernel-via-ftrace-Steven-Rostedt-41-320.jpg)
![set_graph_function - filtering
# echo xfs_trans_alloc >> set_ftrace_notrace
# cat trace
# tracer: function_graph
#
# CPU DURATION FUNCTION CALLS
# | | | | | | |
[..]
1) | xfs_vn_update_time [xfs]() {
1) 0.196 us | __sb_start_write();
1) | kmem_zone_alloc [xfs]() {
1) | kmem_cache_alloc() {
1) 0.077 us | memcg_kmem_put_cache();
1) 0.859 us | }
1) 1.493 us | }
1) | xfs_trans_reserve [xfs]() {
1) | xfs_log_reserve [xfs]() {
1) | xlog_ticket_alloc [xfs]() {
1) | kmem_zone_alloc [xfs]() {
1) | kmem_cache_alloc() {
1) 0.070 us | memcg_kmem_put_cache();
1) 0.809 us | }
1) 1.450 us | }
1) 0.167 us | xfs_log_calc_unit_res [xfs]();
1) 2.786 us | }
1) | xlog_grant_push_ail [xfs]() {
1) | xlog_space_left [xfs]() {
1) ==========> |
1) | smp_apic_timer_interrupt() {
1) | irq_enter() {
1) 0.184 us | rcu_irq_enter();](https://image.slidesharecdn.com/understanding-linux-ftrace-kernel-recipes-2017-171007150617/85/Kernel-Recipes-2017-Understanding-the-Linux-kernel-via-ftrace-Steven-Rostedt-42-320.jpg)
![Interrupt! - I'll come back to this
# echo xfs_trans_alloc >> set_ftrace_notrace
# cat trace
# tracer: function_graph
#
# CPU DURATION FUNCTION CALLS
# | | | | | | |
[..]
1) | xfs_vn_update_time [xfs]() {
1) 0.196 us | __sb_start_write();
1) | kmem_zone_alloc [xfs]() {
1) | kmem_cache_alloc() {
1) 0.077 us | memcg_kmem_put_cache();
1) 0.859 us | }
1) 1.493 us | }
1) | xfs_trans_reserve [xfs]() {
1) | xfs_log_reserve [xfs]() {
1) | xlog_ticket_alloc [xfs]() {
1) | kmem_zone_alloc [xfs]() {
1) | kmem_cache_alloc() {
1) 0.070 us | memcg_kmem_put_cache();
1) 0.809 us | }
1) 1.450 us | }
1) 0.167 us | xfs_log_calc_unit_res [xfs]();
1) 2.786 us | }
1) | xlog_grant_push_ail [xfs]() {
1) | xlog_space_left [xfs]() {
1) ==========> |
1) | smp_apic_timer_interrupt() {
1) | irq_enter() {
1) 0.184 us | rcu_irq_enter();](https://image.slidesharecdn.com/understanding-linux-ftrace-kernel-recipes-2017-171007150617/85/Kernel-Recipes-2017-Understanding-the-Linux-kernel-via-ftrace-Steven-Rostedt-43-320.jpg)
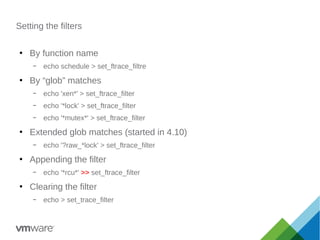
![Removing individual filters
●
Remember to use '>>' and not '>'
# cat set_ftrace_notrace
_cond_resched
xfs_trans_alloc [xfs]
# echo '!xfs_trans_alloc' >> set_ftrace_notrace
# cat set_ftrace_notrace
_cond_resched](https://image.slidesharecdn.com/understanding-linux-ftrace-kernel-recipes-2017-171007150617/85/Kernel-Recipes-2017-Understanding-the-Linux-kernel-via-ftrace-Steven-Rostedt-44-320.jpg)
![set_graph_notrace - filtering
# echo xfs_trans_alloc > set_graph_notrace
# cat trace
# tracer: function_graph
#
# CPU DURATION FUNCTION CALLS
# | | | | | | |
[..]
0) | xfs_vn_update_time [xfs]() {
0) | xfs_ilock [xfs]() {
0) 0.170 us | down_write();
0) 0.892 us | }
0) | xfs_trans_ijoin [xfs]() {
0) | xfs_trans_add_item [xfs]() {
0) | kmem_zone_alloc [xfs]() {
0) | kmem_cache_alloc() {
0) 0.137 us | memcg_kmem_put_cache();
0) 1.247 us | }
0) 1.945 us | }
0) 2.619 us | }
0) 3.340 us | }
0) 0.128 us | xfs_trans_log_inode [xfs]();
0) | xfs_trans_commit [xfs]() {
0) | __xfs_trans_commit [xfs]() {
0) 0.190 us | xfs_trans_apply_dquot_deltas [xfs]();
0) | xfs_log_commit_cil [xfs]() {
0) | xfs_inode_item_size [xfs]() {](https://image.slidesharecdn.com/understanding-linux-ftrace-kernel-recipes-2017-171007150617/85/Kernel-Recipes-2017-Understanding-the-Linux-kernel-via-ftrace-Steven-Rostedt-45-320.jpg)
![func_stack_trace option
# echo nop > current_tracer
# echo schedule > set_ftrace_filter
# cat set_ftrace_filter
schedule
# echo 1 > options/func_stack_trace
# echo function > current_tracer
# sleep 1
# echo 0 > tracing_on
# echo 0 > options/func_stack_trace
# cat trace
# tracer: function
#
# entries-in-buffer/entries-written: 88757/126558 #P:4
#
# _-----=> irqs-off
# / _----=> need-resched
# | / _---=> hardirq/softirq
# || / _--=> preempt-depth
# ||| / delay
# TASK-PID CPU# |||| TIMESTAMP FUNCTION
# | | | |||| | |
chrome-3191 [001] .... 93245.162294: schedule <-futex_wait_queue_me
chrome-3191 [001] .... 93245.162302: <stack trace>
=> futex_wait
=> hrtimer_wakeup
=> do_futex
=> __seccomp_filter
=> SyS_futex
=> do_syscall_64
=> return_from_SYSCALL_64](https://image.slidesharecdn.com/understanding-linux-ftrace-kernel-recipes-2017-171007150617/85/Kernel-Recipes-2017-Understanding-the-Linux-kernel-via-ftrace-Steven-Rostedt-48-320.jpg)
![sym-offset option
# echo 1 > options/sym-offset
# cat trace
# tracer: function
#
# entries-in-buffer/entries-written: 88757/126558 #P:4
#
# _-----=> irqs-off
# / _----=> need-resched
# | / _---=> hardirq/softirq
# || / _--=> preempt-depth
# ||| / delay
# TASK-PID CPU# |||| TIMESTAMP FUNCTION
# | | | |||| | |
chrome-3191 [001] .... 93245.162294: schedule+0x0/0x80 <-futex_wait_queue_me+0xc1/0x120
chrome-3191 [001] .... 93245.162302: <stack trace>
=> futex_wait+0xf6/0x250
=> hrtimer_wakeup+0x0/0x30
=> do_futex+0x2ea/0xb00
=> __seccomp_filter+0x6e/0x270
=> SyS_futex+0x7f/0x160
=> do_syscall_64+0x7c/0xf0
=> return_from_SYSCALL_64+0x0/0x6a
<idle>-0 [001] .N.. 93245.177978: schedule+0x0/0x80 <-schedule_preempt_disabled+0xa/0x10
<idle>-0 [001] .N.. 93245.177985: <stack trace>
=> schedule+0x5/0x80
=> schedule_preempt_disabled+0xa/0x10
=> cpu_startup_entry+0x1b1/0x240
=> start_secondary+0x14d/0x190
chrome-3191 [001] .... 93245.178029: schedule+0x0/0x80 <-futex_wait_queue_me+0xc1/0x120](https://image.slidesharecdn.com/understanding-linux-ftrace-kernel-recipes-2017-171007150617/85/Kernel-Recipes-2017-Understanding-the-Linux-kernel-via-ftrace-Steven-Rostedt-49-320.jpg)
![sym-addr option
# echo 1 > options/sym-addr
# cat trace
# tracer: function
#
# entries-in-buffer/entries-written: 88757/126558 #P:4
#
# _-----=> irqs-off
# / _----=> need-resched
# | / _---=> hardirq/softirq
# || / _--=> preempt-depth
# ||| / delay
# TASK-PID CPU# |||| TIMESTAMP FUNCTION
# | | | |||| | |
chrome-3191 [001] .... 93245.162294: schedule+0x0/0x80 <ffffffffbd801a70> <-futex_wait_queu
chrome-3191 [001] .... 93245.162302: <stack trace>
=> futex_wait+0xf6/0x250 <ffffffffbd2f6536>
=> hrtimer_wakeup+0x0/0x30 <ffffffffbd2e5c50>
=> do_futex+0x2ea/0xb00 <ffffffffbd2f833a>
=> __seccomp_filter+0x6e/0x270 <ffffffffbd32661e>
=> SyS_futex+0x7f/0x160 <ffffffffbd2f8bcf>
=> do_syscall_64+0x7c/0xf0 <ffffffffbd203b1c>
=> return_from_SYSCALL_64+0x0/0x6a <ffffffffbd80632f>
<idle>-0 [001] .N.. 93245.177978: schedule+0x0/0x80 <ffffffffbd801a70> <-schedule_preemp
<idle>-0 [001] .N.. 93245.177985: <stack trace>
=> schedule+0x5/0x80 <ffffffffbd801a75>
=> schedule_preempt_disabled+0xa/0x10 <ffffffffbd801d3a>
=> cpu_startup_entry+0x1b1/0x240 <ffffffffbd2b9551>
=> start_secondary+0x14d/0x190 <ffffffffbd24801d>
chrome-3191 [001] .... 93245.178029: schedule+0x0/0x80 <ffffffffbd801a70> <-futex_wait_queu](https://image.slidesharecdn.com/understanding-linux-ftrace-kernel-recipes-2017-171007150617/85/Kernel-Recipes-2017-Understanding-the-Linux-kernel-via-ftrace-Steven-Rostedt-50-320.jpg)
![Filter specific modules
# lsmod | grep iwldvm
iwldvm 139264 0
mac80211 671744 1 iwldvm
iwlwifi 147456 1 iwldvm
cfg80211 589824 3 iwlwifi,mac80211,iwldvm
# echo :mod:mac80211 > set_ftrace_filter
# cat set_ftrace_filter
ieee80211_restart_hw [mac80211]
ieee80211_alloc_hw_nm [mac80211]
ieee80211_tasklet_handler [mac80211]
ieee80211_restart_work [mac80211]
ieee80211_unregister_hw [mac80211]
ieee80211_free_hw [mac80211]
ieee80211_free_ack_frame [mac80211]
ieee80211_ifa6_changed [mac80211]
ieee80211_register_hw [mac80211]
ieee80211_ifa_changed [mac80211]
ieee80211_configure_filter [mac80211]
ieee80211_reconfig_filter [mac80211]
ieee80211_hw_config [mac80211]
ieee80211_bss_info_change_notify [mac80211]
ieee80211_reset_erp_info [mac80211]
ieee80211_report_low_ack [mac80211]
ieee80211_report_used_skb [mac80211]
ieee80211_free_txskb [mac80211]
ieee80211_tx_status_irqsafe [mac80211]
ieee80211_lost_packet [mac80211]
ieee80211_tx_status_noskb [mac80211]
[..]](https://image.slidesharecdn.com/understanding-linux-ftrace-kernel-recipes-2017-171007150617/85/Kernel-Recipes-2017-Understanding-the-Linux-kernel-via-ftrace-Steven-Rostedt-52-320.jpg)
![Filter specific modules
# echo function_graph > current_tracer
# cat trace
# tracer: function_graph
#
# CPU DURATION FUNCTION CALLS
# | | | | | | |
3) | ieee80211_rx_napi [mac80211]() {
3) 0.160 us | remove_monitor_info [mac80211]();
3) 0.321 us | ieee80211_scan_rx [mac80211]();
3) 0.993 us | sta_info_get_bss [mac80211]();
3) | ieee80211_prepare_and_rx_handle [mac80211]() {
3) 0.132 us | ieee80211_get_bssid [mac80211]();
3) | ieee80211_rx_handlers [mac80211]() {
3) 0.126 us | ieee80211_sta_rx_notify [mac80211]();
3) 0.173 us | ieee80211_get_mmie_keyidx [mac80211]();
3) 0.133 us | ieee80211_rx_h_michael_mic_verify [mac80211]();
3) 1.533 us | ieee80211_queue_work [mac80211]();
3) 0.117 us | ieee80211_rx_handlers_result [mac80211]();
3) 9.483 us | }
3) + 12.299 us | }
3) + 20.847 us | }
2) | ieee80211_iface_work [mac80211]() {
2) | ieee80211_sta_rx_queued_mgmt [mac80211]() {
2) | ieee80211_rx_mgmt_beacon [mac80211]() {
2) 0.601 us | ieee80211_sta_reset_beacon_monitor [mac80211]();
2) + 17.092 us | ieee802_11_parse_elems_crc [mac80211]();
2) + 21.018 us | }
2) + 22.399 us | }
2) 0.514 us | ieee80211_sta_work [mac80211]();
2) + 27.349 us | }](https://image.slidesharecdn.com/understanding-linux-ftrace-kernel-recipes-2017-171007150617/85/Kernel-Recipes-2017-Understanding-the-Linux-kernel-via-ftrace-Steven-Rostedt-53-320.jpg)
![Filter specific modules
# echo function_graph > current_tracer
# cat trace
# tracer: function_graph
#
# CPU DURATION FUNCTION CALLS
# | | | | | | |
3) | ieee80211_rx_napi [mac80211]() {
3) 0.160 us | remove_monitor_info [mac80211]();
3) 0.321 us | ieee80211_scan_rx [mac80211]();
3) 0.993 us | sta_info_get_bss [mac80211]();
3) | ieee80211_prepare_and_rx_handle [mac80211]() {
3) 0.132 us | ieee80211_get_bssid [mac80211]();
3) | ieee80211_rx_handlers [mac80211]() {
3) 0.126 us | ieee80211_sta_rx_notify [mac80211]();
3) 0.173 us | ieee80211_get_mmie_keyidx [mac80211]();
3) 0.133 us | ieee80211_rx_h_michael_mic_verify [mac80211]();
3) 1.533 us | ieee80211_queue_work [mac80211]();
3) 0.117 us | ieee80211_rx_handlers_result [mac80211]();
3) 9.483 us | }
3) + 12.299 us | }
3) + 20.847 us | }
2) | ieee80211_iface_work [mac80211]() {
2) | ieee80211_sta_rx_queued_mgmt [mac80211]() {
2) | ieee80211_rx_mgmt_beacon [mac80211]() {
2) 0.601 us | ieee80211_sta_reset_beacon_monitor [mac80211]();
2) + 17.092 us | ieee802_11_parse_elems_crc [mac80211]();
2) + 21.018 us | }
2) + 22.399 us | }
2) 0.514 us | ieee80211_sta_work [mac80211]();
2) + 27.349 us | }](https://image.slidesharecdn.com/understanding-linux-ftrace-kernel-recipes-2017-171007150617/85/Kernel-Recipes-2017-Understanding-the-Linux-kernel-via-ftrace-Steven-Rostedt-55-320.jpg)
![Filter specific modules
# echo function_graph > current_tracer
# cat trace
# tracer: function_graph
#
# CPU DURATION FUNCTION CALLS
# | | | | | | |
3) | ieee80211_rx_napi [mac80211]() {
3) 0.160 us | remove_monitor_info [mac80211]();
3) 0.321 us | ieee80211_scan_rx [mac80211]();
3) 0.993 us | sta_info_get_bss [mac80211]();
3) | ieee80211_prepare_and_rx_handle [mac80211]() {
3) 0.132 us | ieee80211_get_bssid [mac80211]();
3) | ieee80211_rx_handlers [mac80211]() {
3) 0.126 us | ieee80211_sta_rx_notify [mac80211]();
3) 0.173 us | ieee80211_get_mmie_keyidx [mac80211]();
3) 0.133 us | ieee80211_rx_h_michael_mic_verify [mac80211]();
3) 1.533 us | ieee80211_queue_work [mac80211]();
3) 0.117 us | ieee80211_rx_handlers_result [mac80211]();
3) 9.483 us | }
3) + 12.299 us | }
3) + 20.847 us | }
2) | ieee80211_iface_work [mac80211]() {
2) | ieee80211_sta_rx_queued_mgmt [mac80211]() {
2) | ieee80211_rx_mgmt_beacon [mac80211]() {
2) 0.601 us | ieee80211_sta_reset_beacon_monitor [mac80211]();
2) + 17.092 us | ieee802_11_parse_elems_crc [mac80211]();
2) + 21.018 us | }
2) + 22.399 us | }
2) 0.514 us | ieee80211_sta_work [mac80211]();
2) + 27.349 us | }](https://image.slidesharecdn.com/understanding-linux-ftrace-kernel-recipes-2017-171007150617/85/Kernel-Recipes-2017-Understanding-the-Linux-kernel-via-ftrace-Steven-Rostedt-56-320.jpg)
![Filter specific modules
# echo ieee80211_rx_napi:stacktrace >> set_ftrace_filter
# tail set_ftrace_filter
minstrel_ht_rate_init [mac80211]
minstrel_ht_alloc_sta [mac80211]
minstrel_ht_get_tp_avg [mac80211]
rc80211_minstrel_ht_exit [mac80211]
ibss_setup_channels [mac80211]
ieee80211_sta_join_ibss [mac80211]
ieee80211_csa_finalize.part.16 [mac80211]
ieee80211_amsdu_realloc_pad.isra.39 [mac80211]
ieee80211_assoc_success [mac80211]
ieee80211_rx_napi [mac80211]:stacktrace:unlimited](https://image.slidesharecdn.com/understanding-linux-ftrace-kernel-recipes-2017-171007150617/85/Kernel-Recipes-2017-Understanding-the-Linux-kernel-via-ftrace-Steven-Rostedt-57-320.jpg)
![Filter specific modules
# echo function_graph > current_tracer
# cat trace
# tracer: function_graph
#
# CPU DURATION FUNCTION CALLS
# | | | | | | |
irq/30-iwlwifi-399 [003] ..s. 95809.984832: <stack trace>
=> ieee80211_rx_napi+0x5/0x9c0 [mac80211]
=> ieee80211_rx_napi+0x5/0x9c0 [mac80211]
=> iwl_pcie_rx_handle+0x2b1/0x810 [iwlwifi]
=> iwl_pcie_irq_handler+0x181/0x730 [iwlwifi]
=> irq_thread_fn+0x0/0x50
=> irq_thread_fn+0x1b/0x50
=> irq_thread+0x132/0x1d0
=> __schedule+0x23b/0x6d0
=> __wake_up_common+0x49/0x80
=> irq_thread_dtor+0x0/0xc0
=> irq_thread+0x0/0x1d0
=> kthread+0xd7/0xf0
=> kthread+0x0/0xf0
=> ret_from_fork+0x25/0x30
3) | ieee80211_rx_napi [mac80211]() {
3) 0.144 us | remove_monitor_info [mac80211]();
3) 0.495 us | sta_info_hash_lookup [mac80211]();
3) | ieee80211_prepare_and_rx_handle [mac80211]() {
3) 0.171 us | ieee80211_get_bssid [mac80211]();
3) | ieee80211_rx_handlers [mac80211]() {
3) 0.117 us | ieee80211_sta_rx_notify [mac80211]();
3) 0.184 us | ieee80211_get_mmie_keyidx [mac80211]();](https://image.slidesharecdn.com/understanding-linux-ftrace-kernel-recipes-2017-171007150617/85/Kernel-Recipes-2017-Understanding-the-Linux-kernel-via-ftrace-Steven-Rostedt-58-320.jpg)
![Removing triggers
# echo ieee80211_rx_napi:stacktrace >> set_ftrace_filter
# tail -5 set_ftrace_filter
ieee80211_sta_join_ibss [mac80211]
ieee80211_csa_finalize.part.16 [mac80211]
ieee80211_amsdu_realloc_pad.isra.39 [mac80211]
ieee80211_assoc_success [mac80211]
ieee80211_rx_napi [mac80211]:stacktrace:unlimited
# echo '!ieee80211_rx_napi:stacktrace' >> set_ftrace_filter
# tail -5 set_ftrace_filter
ibss_setup_channels [mac80211]
ieee80211_sta_join_ibss [mac80211]
ieee80211_csa_finalize.part.16 [mac80211]
ieee80211_amsdu_realloc_pad.isra.39 [mac80211]
ieee80211_assoc_success [mac80211]
#
●
Writing to set_ftrace_filter does not remove triggers
●
Must echo '!' and the trigger name. Don't forget to use '>>'](https://image.slidesharecdn.com/understanding-linux-ftrace-kernel-recipes-2017-171007150617/85/Kernel-Recipes-2017-Understanding-the-Linux-kernel-via-ftrace-Steven-Rostedt-59-320.jpg)
![Interrupt! - I'm back
# echo xfs_trans_alloc >> set_ftrace_notrace
# cat trace
# tracer: function_graph
#
# CPU DURATION FUNCTION CALLS
# | | | | | | |
[..]
1) | xfs_vn_update_time [xfs]() {
1) 0.196 us | __sb_start_write();
1) | kmem_zone_alloc [xfs]() {
1) | kmem_cache_alloc() {
1) 0.077 us | memcg_kmem_put_cache();
1) 0.859 us | }
1) 1.493 us | }
1) | xfs_trans_reserve [xfs]() {
1) | xfs_log_reserve [xfs]() {
1) | xlog_ticket_alloc [xfs]() {
1) | kmem_zone_alloc [xfs]() {
1) | kmem_cache_alloc() {
1) 0.070 us | memcg_kmem_put_cache();
1) 0.809 us | }
1) 1.450 us | }
1) 0.167 us | xfs_log_calc_unit_res [xfs]();
1) 2.786 us | }
1) | xlog_grant_push_ail [xfs]() {
1) | xlog_space_left [xfs]() {
1) ==========> |
1) | smp_apic_timer_interrupt() {
1) | irq_enter() {
1) 0.184 us | rcu_irq_enter();](https://image.slidesharecdn.com/understanding-linux-ftrace-kernel-recipes-2017-171007150617/85/Kernel-Recipes-2017-Understanding-the-Linux-kernel-via-ftrace-Steven-Rostedt-60-320.jpg)


![Events
# echo nop > current_tracer
# echo 1 > events/sched/enable
# echo 1 > events/irq/enable
# echo 1 > events/timer/enable
# cat trace
# tracer: nop
#
# entries-in-buffer/entries-written: 150216/509830 #P:4
#
# _-----=> irqs-off
# / _----=> need-resched
# | / _---=> hardirq/softirq
# || / _--=> preempt-depth
# ||| / delay
# TASK-PID CPU# |||| TIMESTAMP FUNCTION
# | | | |||| | |
<idle>-0 [001] ..s. 327484.418266: timer_expire_entry: timer=ffffaaa2c1913e10 function=process_timeout
now=4376764065
<idle>-0 [001] d.s. 327484.418267: sched_waking: comm=rcu_sched pid=8 prio=120 target_cpu=001
<idle>-0 [001] dNs. 327484.418271: sched_wakeup: comm=rcu_sched pid=8 prio=120 target_cpu=001
<idle>-0 [001] .Ns. 327484.418271: timer_expire_exit: timer=ffffaaa2c1913e10
<idle>-0 [001] .Ns. 327484.418273: softirq_exit: vec=1 [action=TIMER]
<idle>-0 [001] .Ns. 327484.418273: softirq_entry: vec=7 [action=SCHED]
<idle>-0 [001] .Ns. 327484.418294: softirq_exit: vec=7 [action=SCHED]
<idle>-0 [001] d... 327484.418299: sched_switch: prev_comm=swapper/1 prev_pid=0 prev_prio=120 prev_state=R
==> next_comm=rcu_sched next_pid=8 next_prio=120
rcu_sched-8 [001] .... 327484.418307: timer_init: timer=ffffaaa2c1913e10
rcu_sched-8 [001] d... 327484.418307: timer_start: timer=ffffaaa2c1913e10 function=process_timeout
expires=4376764066 [timeout=1] cpu=1 idx=0 flags=
rcu_sched-8 [001] d... 327484.418309: sched_stat_runtime: comm=rcu_sched pid=8 runtime=34723 [ns]
vruntime=242925268368660 [ns]
rcu_sched-8 [001] d... 327484.418330: sched_switch: prev_comm=rcu_sched prev_pid=8 prev_prio=120 prev_state=S
==> next_comm=swapper/1 next_pid=0 next_prio=120
<idle>-0 [001] d... 327484.418334: tick_stop: success=1 dependency=NONE
<idle>-0 [001] d... 327484.418335: hrtimer_cancel: hrtimer=ffff9d768dc94800](https://image.slidesharecdn.com/understanding-linux-ftrace-kernel-recipes-2017-171007150617/85/Kernel-Recipes-2017-Understanding-the-Linux-kernel-via-ftrace-Steven-Rostedt-71-320.jpg)
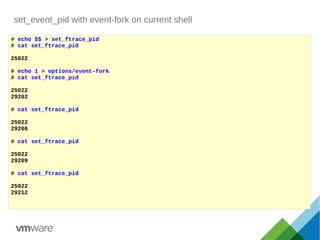
![set_event_pid
# echo 0 > tracing_on
# echo 1 > events/syscalls/enable
# echo 1 > events/exceptions/enable
# sh -c 'echo $$ > set_event_pid; echo 1 > tracing_on; exec echo hello'
# cat trace
# tracer: nop
#
# entries-in-buffer/entries-written: 128/128 #P:4
#
# _-----=> irqs-off
# / _----=> need-resched
# | / _---=> hardirq/softirq
# || / _--=> preempt-depth
# ||| / delay
# TASK-PID CPU# |||| TIMESTAMP FUNCTION
# | | | |||| | |
echo-25556 [001] .... 328256.501048: sys_write -> 0x2
echo-25556 [001] .... 328256.501050: sys_dup2(oldfd: a, newfd: 1)
echo-25556 [001] .... 328256.501051: sys_dup2 -> 0x1
echo-25556 [001] .... 328256.501053: sys_close(fd: a)
echo-25556 [001] .... 328256.501053: sys_close -> 0x0
echo-25556 [001] d... 328256.501226: page_fault_kernel: address=0x55b416b60220 ip=__clear_user error_code=0x2
echo-25556 [001] d... 328256.501242: page_fault_kernel: address=0x7f3f615b7fc0 ip=__clear_user error_code=0x2
echo-25556 [001] d... 328256.501253: page_fault_kernel: address=0x7fffd199a1c9 ip=copy_user_enhanced_fast_string error_code
echo-25556 [001] d... 328256.501258: page_fault_kernel: address=0x7fffd1999ef0 ip=load_elf_binary error_code=0x2
echo-25556 [001] d... 328256.501273: page_fault_user: address=0x7f3f61393c20 ip=0x7f3f61393c20 error_code=0x14
echo-25556 [001] d... 328256.501279: page_fault_user: address=0x7f3f615b6e70 ip=0x7f3f6139487f error_code=0x4
echo-25556 [001] d... 328256.501281: page_fault_user: address=0x7f3f615b6c60 ip=0x7f3f61394886 error_code=0x7
echo-25556 [001] d... 328256.501285: page_fault_user: address=0x7f3f613af340 ip=0x7f3f61394c60 error_code=0x4
echo-25556 [001] d... 328256.501290: page_fault_user: address=0x7f3f615b8100 ip=0x7f3f613aa743 error_code=0x6
echo-25556 [001] .... 328256.501294: sys_brk(brk: 0)
echo-25556 [001] .... 328256.501295: sys_brk -> 0x55b417e5a000
echo-25556 [001] d... 328256.501297: page_fault_user: address=0x7fffd1998d20 ip=0x7f3f61394f77 error_code=0x6
echo-25556 [001] d... 328256.501300: page_fault_user: address=0x7f3f613b03b2 ip=0x7f3f613ae276 error_code=0x4
echo-25556 [001] d... 328256.501304: page_fault_user: address=0x55b416959040 ip=0x7f3f6139549e error_code=0x4
echo-25556 [001] d... 328256.501310: page_fault_user: address=0x55b416b5fdd8 ip=0x7f3f61395616 error_code=0x4
echo-25556 [001] d... 328256.501312: page_fault_user: address=0x55b416b5feb0 ip=0x7f3f613956bf error_code=0x7
echo-25556 [001] d... 328256.501316: page_fault_user: address=0x7fffd19ae038 ip=0x7f3f61395827 error_code=0x4
echo-25556 [001] .... 328256.501320: sys_access(filename: 7f3f613b086a, mode: 0)
[...]](https://image.slidesharecdn.com/understanding-linux-ftrace-kernel-recipes-2017-171007150617/85/Kernel-Recipes-2017-Understanding-the-Linux-kernel-via-ftrace-Steven-Rostedt-73-320.jpg)


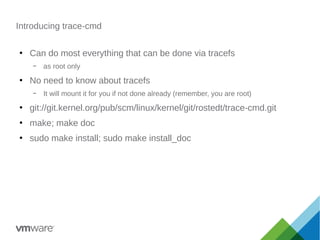
![set_event_pid
# echo 0 > tracing_on
# echo 1 > events/syscalls/enable
# echo 1 > events/exceptions/enable
# echo 1 > options/event-fork
# echo $$ > set_event_pid
# echo 1 > tracing_on; /bin/echo hello; echo 0 > tracing_on
# cat trace
# tracer: nop
#
# entries-in-buffer/entries-written: 310/310 #P:4
#
# _-----=> irqs-off
# / _----=> need-resched
# | / _---=> hardirq/softirq
# || / _--=> preempt-depth
# ||| / delay
# TASK-PID CPU# |||| TIMESTAMP FUNCTION
# | | | |||| | |
bash-25022 [002] .... 340241.280549: sys_write -> 0x2
bash-25022 [002] .... 340241.280557: sys_dup2(oldfd: a, newfd: 1)
bash-25022 [002] .... 340241.280559: sys_dup2 -> 0x1
bash-25022 [002] .... 340241.280565: sys_fcntl(fd: a, cmd: 1, arg: 0)
bash-25022 [002] .... 340241.280565: sys_fcntl -> 0x1
bash-25022 [002] .... 340241.280568: sys_close(fd: a)
bash-25022 [002] .... 340241.280569: sys_close -> 0x0
bash-25022 [002] .... 340241.280610: sys_rt_sigprocmask(how: 0, nset: 7ffe3c06bb70, oset: 7ffe3c06bbf0, sigsetsize: 8)
bash-25022 [002] .... 340241.280613: sys_rt_sigprocmask -> 0x0
bash-25022 [002] .... 340241.280615: sys_pipe(fildes: 703e18)
bash-25022 [002] .... 340241.280641: sys_pipe -> 0x0
bash-25022 [002] d... 340241.281171: page_fault_user: address=0x70e98c ip=0x44d5dc error_code=0x7
bash-25022 [002] d... 340241.281190: page_fault_user: address=0x70d540 ip=0x44d450 error_code=0x7
echo-29091 [001] d... 340241.281192: page_fault_kernel: address=0x7f8ea6fb8e10 ip=__put_user_4 error_code=0x3
bash-25022 [002] d... 340241.281199: page_fault_user: address=0x7ffe3c06bb48 ip=0x44d45d error_code=0x7
bash-25022 [002] .... 340241.281209: sys_setpgid(pid: 71a3, pgid: 71a3)
bash-25022 [002] .... 340241.281213: sys_setpgid -> 0x0
bash-25022 [002] d... 340241.281217: page_fault_user: address=0x710713 ip=0x4c8f65 error_code=0x7
echo-29091 [001] d... 340241.281220: page_fault_user: address=0x7f8ea66a334b ip=0x7f8ea66a334b error_code=0x14
bash-25022 [002] d... 340241.281225: page_fault_user: address=0x1549580 ip=0x4c8fcd error_code=0x7
bash-25022 [002] d... 340241.281236: page_fault_user: address=0x703e10 ip=0x44d53e error_code=0x7
bash-25022 [002] .... 340241.281245: sys_rt_sigprocmask(how: 2, nset: 7ffe3c06bbf0, oset: 0, sigsetsize: 8)
echo-29091 [001] d... 340241.281246: page_fault_user: address=0x7f8ea6fb9160 ip=0x7f8ea66a337d error_code=0x7
[...]](https://image.slidesharecdn.com/understanding-linux-ftrace-kernel-recipes-2017-171007150617/85/Kernel-Recipes-2017-Understanding-the-Linux-kernel-via-ftrace-Steven-Rostedt-77-320.jpg)
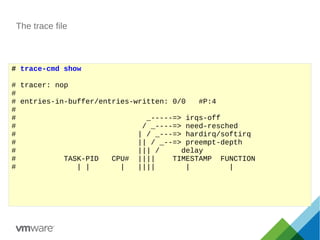
![set_event_pid
[...]
echo-29091 [001] .... 340241.281320: sys_getpid()
echo-29091 [001] .... 340241.281323: sys_getpid -> 0x71a3
echo-29091 [001] d... 340241.281326: page_fault_user: address=0x422cd0 ip=0x422cd0 error_code=0x14
bash-25022 [002] d... 340241.281333: page_fault_user: address=0x1531208 ip=0x465de7 error_code=0x7
echo-29091 [001] d... 340241.281337: page_fault_user: address=0x70e994 ip=0x44d33e error_code=0x7
bash-25022 [002] d... 340241.281341: page_fault_user: address=0x14e1288 ip=0x465e45 error_code=0x7
echo-29091 [001] d... 340241.281344: page_fault_user: address=0x7f8ea661e2a0 ip=0x7f8ea661e2a0 error_code=0x14
bash-25022 [002] d... 340241.281350: page_fault_user: address=0x70bdb4 ip=0x43a505 error_code=0x7
echo-29091 [001] .... 340241.281355: sys_rt_sigprocmask(how: 2, nset: 715380, oset: 0, sigsetsize: 8)
bash-25022 [002] .... 340241.281360: sys_rt_sigprocmask(how: 0, nset: 7ffe3c06bb10, oset: 7ffe3c06bb90, sigsetsize: 8)
echo-29091 [001] .... 340241.281360: sys_rt_sigprocmask -> 0x0
bash-25022 [002] .... 340241.281363: sys_rt_sigprocmask -> 0x0
echo-29091 [001] d... 340241.281364: page_fault_user: address=0x70d540 ip=0x44d367 error_code=0x7
bash-25022 [002] .... 340241.281366: sys_close(fd: 3)
bash-25022 [002] .... 340241.281368: sys_close -> 0x0
echo-29091 [001] d... 340241.281369: page_fault_user: address=0x464da0 ip=0x464da0 error_code=0x14
bash-25022 [002] .... 340241.281370: sys_close(fd: 4)
bash-25022 [002] .... 340241.281371: sys_close -> 0x0
bash-25022 [002] d... 340241.281378: page_fault_user: address=0x14caf64 ip=0x4626f2 error_code=0x7
echo-29091 [001] .... 340241.281381: sys_rt_sigaction(sig: 14, act: 7ffe3c06b890, oact: 7ffe3c06b930, sigsetsize: 8)
echo-29091 [001] .... 340241.281384: sys_rt_sigaction -> 0x0
echo-29091 [001] .... 340241.281385: sys_rt_sigaction(sig: 15, act: 7ffe3c06b890, oact: 7ffe3c06b930, sigsetsize: 8)
echo-29091 [001] .... 340241.281387: sys_rt_sigaction -> 0x0
bash-25022 [002] d... 340241.281388: page_fault_user: address=0x1547000 ip=0x4c8fcd error_code=0x7
echo-29091 [001] .... 340241.281388: sys_rt_sigaction(sig: 16, act: 7ffe3c06b8a0, oact: 7ffe3c06b940, sigsetsize: 8)
echo-29091 [001] .... 340241.281389: sys_rt_sigaction -> 0x0
echo-29091 [001] .... 340241.281392: sys_setpgid(pid: 71a3, pgid: 71a3)
echo-29091 [001] .... 340241.281395: sys_setpgid -> 0x0
bash-25022 [002] .... 340241.281398: sys_ioctl(fd: ff, cmd: 540f, arg: 7ffe3c06bacc)
echo-29091 [001] .... 340241.281399: sys_rt_sigprocmask(how: 0, nset: 7ffe3c06ba20, oset: 7ffe3c06baa0, sigsetsize: 8)
echo-29091 [001] .... 340241.281401: sys_rt_sigprocmask -> 0x0
bash-25022 [002] .... 340241.281403: sys_ioctl -> 0x0
echo-29091 [001] d... 340241.281403: page_fault_user: address=0x7f8ea66cb650 ip=0x7f8ea66cb650 error_code=0x14
bash-25022 [002] .... 340241.281405: sys_rt_sigprocmask(how: 0, nset: 7ffe3c06b9b0, oset: 7ffe3c06ba30, sigsetsize: 8)
bash-25022 [002] .... 340241.281407: sys_rt_sigprocmask -> 0x0
bash-25022 [002] .... 340241.281408: sys_ioctl(fd: ff, cmd: 5410, arg: 7ffe3c06b99c)
bash-25022 [002] .... 340241.281410: sys_ioctl -> 0x0
bash-25022 [002] .... 340241.281411: sys_rt_sigprocmask(how: 2, nset: 7ffe3c06ba30, oset: 0, sigsetsize: 8)
bash-25022 [002] .... 340241.281413: sys_rt_sigprocmask -> 0x0
echo-29091 [001] .... 340241.281413: sys_ioctl(fd: ff, cmd: 5410, arg: 7ffe3c06ba0c)
bash-25022 [002] .... 340241.281414: sys_rt_sigprocmask(how: 2, nset: 7ffe3c06bb90, oset: 0, sigsetsize: 8)
bash-25022 [002] .... 340241.281415: sys_rt_sigprocmask -> 0x0
[...]](https://image.slidesharecdn.com/understanding-linux-ftrace-kernel-recipes-2017-171007150617/85/Kernel-Recipes-2017-Understanding-the-Linux-kernel-via-ftrace-Steven-Rostedt-78-320.jpg)

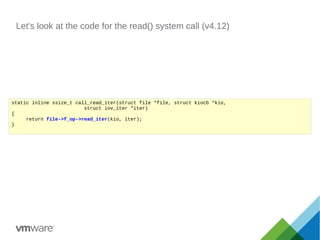
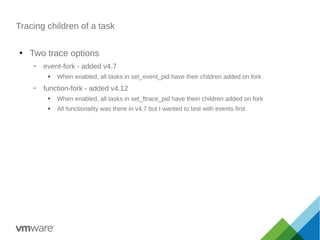
![The Function Tracer
# echo function > current_tracer
# cat trace
# tracer: function
#
# entries-in-buffer/entries-written: 205061/4300296 #P:4
#
# _-----=> irqs-off
# / _----=> need-resched
# | / _---=> hardirq/softirq
# || / _--=> preempt-depth
# ||| / delay
# TASK-PID CPU# |||| TIMESTAMP FUNCTION
# | | | |||| | |
Timer-11765 [002] d... 1193197.836818: irq_enter <-smp_apic_timer_interrupt
Timer-11765 [002] d... 1193197.836818: rcu_irq_enter <-irq_enter
Timer-11765 [002] d.h. 1193197.836818: local_apic_timer_interrupt <-smp_apic_timer_interrup
Timer-11765 [002] d.h. 1193197.836819: hrtimer_interrupt <-smp_apic_timer_interrupt
Timer-11765 [002] d.h. 1193197.836819: _raw_spin_lock <-hrtimer_interrupt
Timer-11765 [002] d.h. 1193197.836819: ktime_get_update_offsets_now <-hrtimer_interrupt
Timer-11765 [002] d.h. 1193197.836819: __hrtimer_run_queues <-hrtimer_interrupt
Timer-11765 [002] d.h. 1193197.836820: __remove_hrtimer <-__hrtimer_run_queues
Timer-11765 [002] d.h. 1193197.836820: tick_sched_timer <-__hrtimer_run_queues
Timer-11765 [002] d.h. 1193197.836820: ktime_get <-tick_sched_timer
Timer-11765 [002] d.h. 1193197.836820: tick_sched_do_timer <-tick_sched_timer
Timer-11765 [002] d.h. 1193197.836821: tick_do_update_jiffies64.part.12 <-tick_sched_timer
Timer-11765 [002] d.h. 1193197.836821: _raw_spin_lock <-tick_do_update_jiffies64.part.12
Timer-11765 [002] d.h. 1193197.836821: do_timer <-tick_do_update_jiffies64.part.12`](https://image.slidesharecdn.com/understanding-linux-ftrace-kernel-recipes-2017-171007150617/85/Kernel-Recipes-2017-Understanding-the-Linux-kernel-via-ftrace-Steven-Rostedt-85-320.jpg)
![The Function Tracer
# trace-cmd start -p function
# trace-cmd show
# tracer: function
#
# entries-in-buffer/entries-written: 205061/4300296 #P:4
#
# _-----=> irqs-off
# / _----=> need-resched
# | / _---=> hardirq/softirq
# || / _--=> preempt-depth
# ||| / delay
# TASK-PID CPU# |||| TIMESTAMP FUNCTION
# | | | |||| | |
Timer-11765 [002] d... 1193197.836818: irq_enter <-smp_apic_timer_interrupt
Timer-11765 [002] d... 1193197.836818: rcu_irq_enter <-irq_enter
Timer-11765 [002] d.h. 1193197.836818: local_apic_timer_interrupt <-smp_apic_timer_interrup
Timer-11765 [002] d.h. 1193197.836819: hrtimer_interrupt <-smp_apic_timer_interrupt
Timer-11765 [002] d.h. 1193197.836819: _raw_spin_lock <-hrtimer_interrupt
Timer-11765 [002] d.h. 1193197.836819: ktime_get_update_offsets_now <-hrtimer_interrupt
Timer-11765 [002] d.h. 1193197.836819: __hrtimer_run_queues <-hrtimer_interrupt
Timer-11765 [002] d.h. 1193197.836820: __remove_hrtimer <-__hrtimer_run_queues
Timer-11765 [002] d.h. 1193197.836820: tick_sched_timer <-__hrtimer_run_queues
Timer-11765 [002] d.h. 1193197.836820: ktime_get <-tick_sched_timer
Timer-11765 [002] d.h. 1193197.836820: tick_sched_do_timer <-tick_sched_timer
Timer-11765 [002] d.h. 1193197.836821: tick_do_update_jiffies64.part.12 <-tick_sched_timer
Timer-11765 [002] d.h. 1193197.836821: _raw_spin_lock <-tick_do_update_jiffies64.part.12
Timer-11765 [002] d.h. 1193197.836821: do_timer <-tick_do_update_jiffies64.part.12`](https://image.slidesharecdn.com/understanding-linux-ftrace-kernel-recipes-2017-171007150617/85/Kernel-Recipes-2017-Understanding-the-Linux-kernel-via-ftrace-Steven-Rostedt-86-320.jpg)

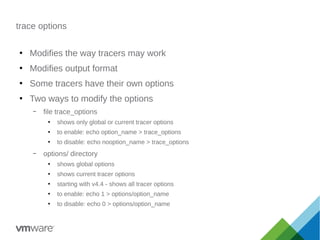
![set_ftrace_filter
# echo schedule > set_ftrace_filter
# echo function > current_tracer
# cat trace
# tracer: function
#
# entries-in-buffer/entries-written: 43340/43340 #P:4
#
# _-----=> irqs-off
# / _----=> need-resched
# | / _---=> hardirq/softirq
# || / _--=> preempt-depth
# ||| / delay
# TASK-PID CPU# |||| TIMESTAMP FUNCTION
# | | | |||| | |
<idle>-0 [001] .N.. 18377.251971: schedule <-schedule_preempt_disabled
irq/30-iwlwifi-399 [001] .... 18377.251996: schedule <-irq_thread
<idle>-0 [003] .N.. 18377.251997: schedule <-schedule_preempt_disabled
http-26069 [003] .... 18377.252079: schedule <-schedule_hrtimeout_range_clock
<idle>-0 [000] .N.. 18377.252175: schedule <-schedule_preempt_disabled
bash-2605 [002] .... 18377.252178: schedule <-schedule_hrtimeout_range_clock
<idle>-0 [003] .N.. 18377.252184: schedule <-schedule_preempt_disabled
<...>-26630 [000] .... 18377.252185: schedule <-worker_thread
<idle>-0 [001] .N.. 18377.252186: schedule <-schedule_preempt_disabled
hp-systray-2469 [003] .... 18377.252220: schedule <-schedule_hrtimeout_range_clock
gnome-terminal--2485 [001] .... 18377.252246: schedule <-schedule_hrtimeout_range_clock
<idle>-0 [003] .N.. 18377.253933: schedule <-schedule_preempt_disabled
rcu_sched-7 [003] .... 18377.253938: schedule <-rcu_gp_kthread
<idle>-0 [002] .N.. 18377.255098: schedule <-schedule_preempt_disabled](https://image.slidesharecdn.com/understanding-linux-ftrace-kernel-recipes-2017-171007150617/85/Kernel-Recipes-2017-Understanding-the-Linux-kernel-via-ftrace-Steven-Rostedt-91-320.jpg)
![set_ftrace_filter
# trace-cmd start -p function -l schedule
# trace-cmd show
# tracer: function
#
# entries-in-buffer/entries-written: 43340/43340 #P:4
#
# _-----=> irqs-off
# / _----=> need-resched
# | / _---=> hardirq/softirq
# || / _--=> preempt-depth
# ||| / delay
# TASK-PID CPU# |||| TIMESTAMP FUNCTION
# | | | |||| | |
<idle>-0 [001] .N.. 18377.251971: schedule <-schedule_preempt_disabled
irq/30-iwlwifi-399 [001] .... 18377.251996: schedule <-irq_thread
<idle>-0 [003] .N.. 18377.251997: schedule <-schedule_preempt_disabled
http-26069 [003] .... 18377.252079: schedule <-schedule_hrtimeout_range_clock
<idle>-0 [000] .N.. 18377.252175: schedule <-schedule_preempt_disabled
bash-2605 [002] .... 18377.252178: schedule <-schedule_hrtimeout_range_clock
<idle>-0 [003] .N.. 18377.252184: schedule <-schedule_preempt_disabled
<...>-26630 [000] .... 18377.252185: schedule <-worker_thread
<idle>-0 [001] .N.. 18377.252186: schedule <-schedule_preempt_disabled
hp-systray-2469 [003] .... 18377.252220: schedule <-schedule_hrtimeout_range_clock
gnome-terminal--2485 [001] .... 18377.252246: schedule <-schedule_hrtimeout_range_clock
<idle>-0 [003] .N.. 18377.253933: schedule <-schedule_preempt_disabled
rcu_sched-7 [003] .... 18377.253938: schedule <-rcu_gp_kthread
<idle>-0 [002] .N.. 18377.255098: schedule <-schedule_preempt_disabled](https://image.slidesharecdn.com/understanding-linux-ftrace-kernel-recipes-2017-171007150617/85/Kernel-Recipes-2017-Understanding-the-Linux-kernel-via-ftrace-Steven-Rostedt-92-320.jpg)
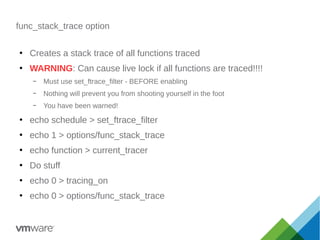
![set_ftrace_pid
# echo 0 > tracing_on
# echo function > current_tracer
# sh -c 'echo $$ > set_ftrace_pid; echo 1 > tracing_on;
> exec echo hello'
# cat trace
# tracer: function
#
# entries-in-buffer/entries-written: 16309/16309 #P:4
#
# _-----=> irqs-off
# / _----=> need-resched
# | / _---=> hardirq/softirq
# || / _--=> preempt-depth
# ||| / delay
# TASK-PID CPU# |||| TIMESTAMP FUNCTION
# | | | |||| | |
echo-26916 [000] .... 18924.157145: mutex_unlock <-rb_simple_write
echo-26916 [000] .... 18924.157147: __fsnotify_parent <-vfs_write
echo-26916 [000] .... 18924.157148: fsnotify <-vfs_write
echo-26916 [000] .... 18924.157148: __sb_end_write <-vfs_write
echo-26916 [000] .... 18924.157153: SyS_dup2 <-system_call_fast_compare_end
echo-26916 [000] .... 18924.157154: _raw_spin_lock <-SyS_dup2
echo-26916 [000] .... 18924.157154: expand_files <-SyS_dup2
echo-26916 [000] .... 18924.157155: do_dup2 <-SyS_dup2
echo-26916 [000] .... 18924.157155: filp_close <-do_dup2
echo-26916 [000] .... 18924.157156: dnotify_flush <-filp_close
echo-26916 [000] .... 18924.157156: locks_remove_posix <-filp_close
echo-26916 [000] .... 18924.157156: fput <-filp_close
echo-26916 [000] .... 18924.157157: task_work_add <-fput
echo-26916 [000] .... 18924.157157: kick_process <-task_work_add](https://image.slidesharecdn.com/understanding-linux-ftrace-kernel-recipes-2017-171007150617/85/Kernel-Recipes-2017-Understanding-the-Linux-kernel-via-ftrace-Steven-Rostedt-93-320.jpg)
![set_ftrace_pid
# cd ~ # can not run in tracefs
# trace-cmd record -p function -F echo hello
# trace-cmd report
CPU 1 is empty
CPU 3 is empty
cpus=4
echo-10812 [002] 423977.320588: function: mutex_unlock <-- rb_simple_write
echo-10812 [002] 423977.320590: function: __wake_up <-- rb_wake_up_waiters
echo-10812 [002] 423977.320590: function: _raw_spin_lock_irqsave <-- __wake_up
echo-10812 [002] 423977.320590: function: __wake_up_common <-- __wake_up
echo-10812 [002] 423977.320590: function: _raw_spin_unlock_irqrestore <-- rb_wake_up_waiters
echo-10812 [002] 423977.320591: function: __wake_up <-- irq_work_run_list
echo-10812 [002] 423977.320591: function: _raw_spin_lock_irqsave <-- __wake_up
echo-10812 [002] 423977.320591: function: __wake_up_common <-- __wake_up
echo-10812 [002] 423977.320591: function: autoremove_wake_function <-- __wake_up_common
echo-10812 [002] 423977.320591: function: default_wake_function <-- autoremove_wake_function
echo-10812 [002] 423977.320591: function: try_to_wake_up <-- autoremove_wake_function
echo-10812 [002] 423977.320591: function: _raw_spin_lock_irqsave <-- try_to_wake_up
echo-10812 [002] 423977.320592: function: select_task_rq_fair <-- try_to_wake_up
echo-10812 [002] 423977.320592: function: effective_load.isra.43 <-- select_task_rq_fair
echo-10812 [002] 423977.320592: function: effective_load.isra.43 <-- select_task_rq_fair
echo-10812 [002] 423977.320593: function: select_idle_sibling <-- try_to_wake_up
echo-10812 [002] 423977.320593: function: idle_cpu <-- select_idle_sibling
echo-10812 [002] 423977.320593: function: _raw_spin_lock <-- try_to_wake_up
echo-10812 [002] 423977.320593: function: ttwu_do_activate <-- try_to_wake_up
echo-10812 [002] 423977.320593: function: activate_task <-- ttwu_do_activate
echo-10812 [002] 423977.320593: function: update_rq_clock <-- activate_task
echo-10812 [002] 423977.320593: function: enqueue_task_fair <-- ttwu_do_activate
echo-10812 [002] 423977.320593: function: enqueue_entity <-- enqueue_task_fair
echo-10812 [002] 423977.320593: function: update_curr <-- enqueue_entity
echo-10812 [002] 423977.320594: function: __compute_runnable_contrib <-- update_load_avg
echo-10812 [002] 423977.320594: function: __compute_runnable_contrib <-- update_load_avg
echo-10812 [002] 423977.320594: function: update_cfs_shares <-- enqueue_entity
echo-10812 [002] 423977.320594: function: account_entity_enqueue <-- enqueue_entity
echo-10812 [002] 423977.320594: function: place_entity <-- enqueue_entity
echo-10812 [002] 423977.320594: function: __enqueue_entity <-- enqueue_entity
echo-10812 [002] 423977.320594: function: enqueue_entity <-- enqueue_task_fair
echo-10812 [002] 423977.320594: function: update_curr <-- enqueue_entity
echo-10812 [002] 423977.320595: function: __compute_runnable_contrib <-- update_load_avg
echo-10812 [002] 423977.320595: function: __compute_runnable_contrib <-- update_load_avg
echo-10812 [002] 423977.320595: function: update_cfs_shares <-- enqueue_entity](https://image.slidesharecdn.com/understanding-linux-ftrace-kernel-recipes-2017-171007150617/85/Kernel-Recipes-2017-Understanding-the-Linux-kernel-via-ftrace-Steven-Rostedt-94-320.jpg)
![set_graph_function
# echo SyS_read > set_graph_function
# echo function_graph > current_tracer
# cat trace
# tracer: function_graph
#
# CPU DURATION FUNCTION CALLS
# | | | | | | |
2) + 12.716 us | } /* vfs_read */
2) + 14.387 us | } /* SyS_read */
2) | SyS_read() {
2) | __fdget_pos() {
2) 0.043 us | __fget_light();
2) 0.439 us | }
2) | vfs_read() {
2) | rw_verify_area() {
2) | security_file_permission() {
2) 0.037 us | __fsnotify_parent();
2) 0.064 us | fsnotify();
2) 0.724 us | }
2) 1.023 us | }
2) | __vfs_read() {
2) | new_sync_read() {
2) | xfs_file_read_iter [xfs]() {
2) | xfs_file_buffered_aio_read [xfs]() {
2) | xfs_ilock [xfs]() {
2) | down_read() {
2) 0.042 us | _cond_resched();
2) 0.509 us | }](https://image.slidesharecdn.com/understanding-linux-ftrace-kernel-recipes-2017-171007150617/85/Kernel-Recipes-2017-Understanding-the-Linux-kernel-via-ftrace-Steven-Rostedt-95-320.jpg)
![set_graph_function
# trace-cmd -p function_graph -g SyS_read
# trace-cmd show
# tracer: function_graph
#
# CPU DURATION FUNCTION CALLS
# | | | | | | |
2) + 12.716 us | } /* vfs_read */
2) + 14.387 us | } /* SyS_read */
2) | SyS_read() {
2) | __fdget_pos() {
2) 0.043 us | __fget_light();
2) 0.439 us | }
2) | vfs_read() {
2) | rw_verify_area() {
2) | security_file_permission() {
2) 0.037 us | __fsnotify_parent();
2) 0.064 us | fsnotify();
2) 0.724 us | }
2) 1.023 us | }
2) | __vfs_read() {
2) | new_sync_read() {
2) | xfs_file_read_iter [xfs]() {
2) | xfs_file_buffered_aio_read [xfs]() {
2) | xfs_ilock [xfs]() {
2) | down_read() {
2) 0.042 us | _cond_resched();
2) 0.509 us | }](https://image.slidesharecdn.com/understanding-linux-ftrace-kernel-recipes-2017-171007150617/85/Kernel-Recipes-2017-Understanding-the-Linux-kernel-via-ftrace-Steven-Rostedt-96-320.jpg)
![set_graph_function - filtering
# echo _cond_resched > set_ftrace_notrace
# cat trace
# tracer: function_graph
#
# CPU DURATION FUNCTION CALLS
# | | | | | | |
[..]
1) | xfs_vn_update_time [xfs]() {
1) | xfs_trans_alloc [xfs]() {
1) 0.044 us | __sb_start_write();
1) | kmem_zone_alloc [xfs]() {
1) | kmem_cache_alloc() {
1) 0.029 us | memcg_kmem_put_cache();
1) 0.375 us | }
1) 0.630 us | }
1) | xfs_trans_reserve [xfs]() {
1) | xfs_log_reserve [xfs]() {
1) | xlog_ticket_alloc [xfs]() {
1) | kmem_zone_alloc [xfs]() {
1) | kmem_cache_alloc() {
1) 0.029 us | memcg_kmem_put_cache();
1) 0.330 us | }
1) 0.573 us | }
1) 0.037 us | xfs_log_calc_unit_res [xfs]();
1) 1.068 us | }
1) | xlog_grant_push_ail [xfs]() {
1) 0.030 us | xlog_space_left [xfs]();
1) 0.269 us | }
1) | xlog_grant_head_check [xfs]() {
1) 0.030 us | xlog_space_left [xfs]();](https://image.slidesharecdn.com/understanding-linux-ftrace-kernel-recipes-2017-171007150617/85/Kernel-Recipes-2017-Understanding-the-Linux-kernel-via-ftrace-Steven-Rostedt-97-320.jpg)
![set_graph_function - filtering
# trace-cmd start -p nop -n _cond_resched
# trace-cmd start -p function_graph -g SyS_read
# trace-cmd show
# tracer: function_graph
#
# CPU DURATION FUNCTION CALLS
# | | | | | | |
[..]
1) | xfs_vn_update_time [xfs]() {
1) | xfs_trans_alloc [xfs]() {
1) 0.044 us | __sb_start_write();
1) | kmem_zone_alloc [xfs]() {
1) | kmem_cache_alloc() {
1) 0.029 us | memcg_kmem_put_cache();
1) 0.375 us | }
1) 0.630 us | }
1) | xfs_trans_reserve [xfs]() {
1) | xfs_log_reserve [xfs]() {
1) | xlog_ticket_alloc [xfs]() {
1) | kmem_zone_alloc [xfs]() {
1) | kmem_cache_alloc() {
1) 0.029 us | memcg_kmem_put_cache();
1) 0.330 us | }
1) 0.573 us | }
1) 0.037 us | xfs_log_calc_unit_res [xfs]();
1) 1.068 us | }
1) | xlog_grant_push_ail [xfs]() {
1) 0.030 us | xlog_space_left [xfs]();
1) 0.269 us | }
1) | xlog_grant_head_check [xfs]() {
1) 0.030 us | xlog_space_left [xfs]();](https://image.slidesharecdn.com/understanding-linux-ftrace-kernel-recipes-2017-171007150617/85/Kernel-Recipes-2017-Understanding-the-Linux-kernel-via-ftrace-Steven-Rostedt-98-320.jpg)
![set_graph_notrace - filtering
# echo xfs_trans_alloc > set_graph_notrace
# cat trace
# tracer: function_graph
#
# CPU DURATION FUNCTION CALLS
# | | | | | | |
[..]
0) | xfs_vn_update_time [xfs]() {
0) | xfs_ilock [xfs]() {
0) 0.170 us | down_write();
0) 0.892 us | }
0) | xfs_trans_ijoin [xfs]() {
0) | xfs_trans_add_item [xfs]() {
0) | kmem_zone_alloc [xfs]() {
0) | kmem_cache_alloc() {
0) 0.137 us | memcg_kmem_put_cache();
0) 1.247 us | }
0) 1.945 us | }
0) 2.619 us | }
0) 3.340 us | }
0) 0.128 us | xfs_trans_log_inode [xfs]();
0) | xfs_trans_commit [xfs]() {
0) | __xfs_trans_commit [xfs]() {
0) 0.190 us | xfs_trans_apply_dquot_deltas [xfs]();
0) | xfs_log_commit_cil [xfs]() {
0) | xfs_inode_item_size [xfs]() {](https://image.slidesharecdn.com/understanding-linux-ftrace-kernel-recipes-2017-171007150617/85/Kernel-Recipes-2017-Understanding-the-Linux-kernel-via-ftrace-Steven-Rostedt-99-320.jpg)
![set_graph_notrace - filtering
# trace-cmd start -p function_graph -n xfs_trans_alloc
# trace-cmd show
# tracer: function_graph
#
# CPU DURATION FUNCTION CALLS
# | | | | | | |
[..]
0) | xfs_vn_update_time [xfs]() {
0) | xfs_ilock [xfs]() {
0) 0.170 us | down_write();
0) 0.892 us | }
0) | xfs_trans_ijoin [xfs]() {
0) | xfs_trans_add_item [xfs]() {
0) | kmem_zone_alloc [xfs]() {
0) | kmem_cache_alloc() {
0) 0.137 us | memcg_kmem_put_cache();
0) 1.247 us | }
0) 1.945 us | }
0) 2.619 us | }
0) 3.340 us | }
0) 0.128 us | xfs_trans_log_inode [xfs]();
0) | xfs_trans_commit [xfs]() {
0) | __xfs_trans_commit [xfs]() {
0) 0.190 us | xfs_trans_apply_dquot_deltas [xfs]();
0) | xfs_log_commit_cil [xfs]() {
0) | xfs_inode_item_size [xfs]() {](https://image.slidesharecdn.com/understanding-linux-ftrace-kernel-recipes-2017-171007150617/85/Kernel-Recipes-2017-Understanding-the-Linux-kernel-via-ftrace-Steven-Rostedt-100-320.jpg)
![func_stack_trace option
# echo nop > current_tracer
# echo schedule > set_ftrace_filter
# cat set_ftrace_filter
schedule
# echo 1 > options/func_stack_trace
# echo function > current_tracer
# sleep 1
# echo 0 > tracing_on
# echo 0 > options/func_stack_trace
# cat trace
# tracer: function
#
# entries-in-buffer/entries-written: 88757/126558 #P:4
#
# _-----=> irqs-off
# / _----=> need-resched
# | / _---=> hardirq/softirq
# || / _--=> preempt-depth
# ||| / delay
# TASK-PID CPU# |||| TIMESTAMP FUNCTION
# | | | |||| | |
chrome-3191 [001] .... 93245.162294: schedule <-futex_wait_queue_me
chrome-3191 [001] .... 93245.162302: <stack trace>
=> futex_wait
=> hrtimer_wakeup
=> do_futex
=> __seccomp_filter
=> SyS_futex
=> do_syscall_64
=> return_from_SYSCALL_64](https://image.slidesharecdn.com/understanding-linux-ftrace-kernel-recipes-2017-171007150617/85/Kernel-Recipes-2017-Understanding-the-Linux-kernel-via-ftrace-Steven-Rostedt-101-320.jpg)
![func_stack_trace option
# trace-cmd start -p function -l schedule --func-stack
# trace-cmd show
# tracer: function
#
# entries-in-buffer/entries-written: 88757/126558 #P:4
#
# _-----=> irqs-off
# / _----=> need-resched
# | / _---=> hardirq/softirq
# || / _--=> preempt-depth
# ||| / delay
# TASK-PID CPU# |||| TIMESTAMP FUNCTION
# | | | |||| | |
chrome-3191 [001] .... 93245.162294: schedule <-futex_wait_queue_me
chrome-3191 [001] .... 93245.162302: <stack trace>
=> futex_wait
=> hrtimer_wakeup
=> do_futex
=> __seccomp_filter
=> SyS_futex
=> do_syscall_64
=> return_from_SYSCALL_64
[..]
# trace-cmd start -p nop
# cat /sys/kernel/debug/tracing/options/func_stack_trace
0](https://image.slidesharecdn.com/understanding-linux-ftrace-kernel-recipes-2017-171007150617/85/Kernel-Recipes-2017-Understanding-the-Linux-kernel-via-ftrace-Steven-Rostedt-102-320.jpg)
![sym-offset option
# echo 1 > options/sym-offset
# cat trace
# tracer: function
#
# entries-in-buffer/entries-written: 88757/126558 #P:4
#
# _-----=> irqs-off
# / _----=> need-resched
# | / _---=> hardirq/softirq
# || / _--=> preempt-depth
# ||| / delay
# TASK-PID CPU# |||| TIMESTAMP FUNCTION
# | | | |||| | |
chrome-3191 [001] .... 93245.162294: schedule+0x0/0x80 <-futex_wait_queue_me+0xc1/0x120
chrome-3191 [001] .... 93245.162302: <stack trace>
=> futex_wait+0xf6/0x250
=> hrtimer_wakeup+0x0/0x30
=> do_futex+0x2ea/0xb00
=> __seccomp_filter+0x6e/0x270
=> SyS_futex+0x7f/0x160
=> do_syscall_64+0x7c/0xf0
=> return_from_SYSCALL_64+0x0/0x6a
<idle>-0 [001] .N.. 93245.177978: schedule+0x0/0x80 <-schedule_preempt_disabled+0xa/0x10
<idle>-0 [001] .N.. 93245.177985: <stack trace>
=> schedule+0x5/0x80
=> schedule_preempt_disabled+0xa/0x10
=> cpu_startup_entry+0x1b1/0x240
=> start_secondary+0x14d/0x190
chrome-3191 [001] .... 93245.178029: schedule+0x0/0x80 <-futex_wait_queue_me+0xc1/0x120](https://image.slidesharecdn.com/understanding-linux-ftrace-kernel-recipes-2017-171007150617/85/Kernel-Recipes-2017-Understanding-the-Linux-kernel-via-ftrace-Steven-Rostedt-103-320.jpg)
![sym-offset option
# trace-cmd start -p function -l schedule --func-stack -O sym-offset
# trace-cmd show
# tracer: function
#
# entries-in-buffer/entries-written: 88757/126558 #P:4
#
# _-----=> irqs-off
# / _----=> need-resched
# | / _---=> hardirq/softirq
# || / _--=> preempt-depth
# ||| / delay
# TASK-PID CPU# |||| TIMESTAMP FUNCTION
# | | | |||| | |
chrome-3191 [001] .... 93245.162294: schedule+0x0/0x80 <-futex_wait_queue_me+0xc1/0x120
chrome-3191 [001] .... 93245.162302: <stack trace>
=> futex_wait+0xf6/0x250
=> hrtimer_wakeup+0x0/0x30
=> do_futex+0x2ea/0xb00
=> __seccomp_filter+0x6e/0x270
=> SyS_futex+0x7f/0x160
=> do_syscall_64+0x7c/0xf0
=> return_from_SYSCALL_64+0x0/0x6a
<idle>-0 [001] .N.. 93245.177978: schedule+0x0/0x80 <-schedule_preempt_disabled+0xa/0x10
<idle>-0 [001] .N.. 93245.177985: <stack trace>
=> schedule+0x5/0x80
=> schedule_preempt_disabled+0xa/0x10
=> cpu_startup_entry+0x1b1/0x240
=> start_secondary+0x14d/0x190
chrome-3191 [001] .... 93245.178029: schedule+0x0/0x80 <-futex_wait_queue_me+0xc1/0x120](https://image.slidesharecdn.com/understanding-linux-ftrace-kernel-recipes-2017-171007150617/85/Kernel-Recipes-2017-Understanding-the-Linux-kernel-via-ftrace-Steven-Rostedt-104-320.jpg)
![sym-addr option
# echo 1 > options/sym-addr
# cat trace
# tracer: function
#
# entries-in-buffer/entries-written: 88757/126558 #P:4
#
# _-----=> irqs-off
# / _----=> need-resched
# | / _---=> hardirq/softirq
# || / _--=> preempt-depth
# ||| / delay
# TASK-PID CPU# |||| TIMESTAMP FUNCTION
# | | | |||| | |
chrome-3191 [001] .... 93245.162294: schedule+0x0/0x80 <ffffffffbd801a70> <-futex_wait_queu
chrome-3191 [001] .... 93245.162302: <stack trace>
=> futex_wait+0xf6/0x250 <ffffffffbd2f6536>
=> hrtimer_wakeup+0x0/0x30 <ffffffffbd2e5c50>
=> do_futex+0x2ea/0xb00 <ffffffffbd2f833a>
=> __seccomp_filter+0x6e/0x270 <ffffffffbd32661e>
=> SyS_futex+0x7f/0x160 <ffffffffbd2f8bcf>
=> do_syscall_64+0x7c/0xf0 <ffffffffbd203b1c>
=> return_from_SYSCALL_64+0x0/0x6a <ffffffffbd80632f>
<idle>-0 [001] .N.. 93245.177978: schedule+0x0/0x80 <ffffffffbd801a70> <-schedule_preemp
<idle>-0 [001] .N.. 93245.177985: <stack trace>
=> schedule+0x5/0x80 <ffffffffbd801a75>
=> schedule_preempt_disabled+0xa/0x10 <ffffffffbd801d3a>
=> cpu_startup_entry+0x1b1/0x240 <ffffffffbd2b9551>
=> start_secondary+0x14d/0x190 <ffffffffbd24801d>
chrome-3191 [001] .... 93245.178029: schedule+0x0/0x80 <ffffffffbd801a70> <-futex_wait_queu](https://image.slidesharecdn.com/understanding-linux-ftrace-kernel-recipes-2017-171007150617/85/Kernel-Recipes-2017-Understanding-the-Linux-kernel-via-ftrace-Steven-Rostedt-105-320.jpg)
![sym-addr option
# trace-cmd start -p function -l schedule --func-stack -O sym-offset
-O sym-addr
# trace-cmd show
# tracer: function
#
# entries-in-buffer/entries-written: 88757/126558 #P:4
#
# _-----=> irqs-off
# / _----=> need-resched
# | / _---=> hardirq/softirq
# || / _--=> preempt-depth
# ||| / delay
# TASK-PID CPU# |||| TIMESTAMP FUNCTION
# | | | |||| | |
chrome-3191 [001] .... 93245.162294: schedule+0x0/0x80 <ffffffffbd801a70> <-futex_wait_queu
chrome-3191 [001] .... 93245.162302: <stack trace>
=> futex_wait+0xf6/0x250 <ffffffffbd2f6536>
=> hrtimer_wakeup+0x0/0x30 <ffffffffbd2e5c50>
=> do_futex+0x2ea/0xb00 <ffffffffbd2f833a>
=> __seccomp_filter+0x6e/0x270 <ffffffffbd32661e>
=> SyS_futex+0x7f/0x160 <ffffffffbd2f8bcf>
=> do_syscall_64+0x7c/0xf0 <ffffffffbd203b1c>
=> return_from_SYSCALL_64+0x0/0x6a <ffffffffbd80632f>
<idle>-0 [001] .N.. 93245.177978: schedule+0x0/0x80 <ffffffffbd801a70> <-schedule_preemp
<idle>-0 [001] .N.. 93245.177985: <stack trace>
=> schedule+0x5/0x80 <ffffffffbd801a75>
=> schedule_preempt_disabled+0xa/0x10 <ffffffffbd801d3a>
=> cpu_startup_entry+0x1b1/0x240 <ffffffffbd2b9551>
=> start_secondary+0x14d/0x190 <ffffffffbd24801d>
chrome-3191 [001] .... 93245.178029: schedule+0x0/0x80 <ffffffffbd801a70> <-futex_wait_queu](https://image.slidesharecdn.com/understanding-linux-ftrace-kernel-recipes-2017-171007150617/85/Kernel-Recipes-2017-Understanding-the-Linux-kernel-via-ftrace-Steven-Rostedt-106-320.jpg)

![Filter specific modules
# lsmod | grep iwldvm
iwldvm 139264 0
mac80211 671744 1 iwldvm
iwlwifi 147456 1 iwldvm
cfg80211 589824 3 iwlwifi,mac80211,iwldvm
# echo :mod:mac80211 > set_ftrace_filter
# cat set_ftrace_filter
ieee80211_restart_hw [mac80211]
ieee80211_alloc_hw_nm [mac80211]
ieee80211_tasklet_handler [mac80211]
ieee80211_restart_work [mac80211]
ieee80211_unregister_hw [mac80211]
ieee80211_free_hw [mac80211]
ieee80211_free_ack_frame [mac80211]
ieee80211_ifa6_changed [mac80211]
ieee80211_register_hw [mac80211]
ieee80211_ifa_changed [mac80211]
ieee80211_configure_filter [mac80211]
ieee80211_reconfig_filter [mac80211]
ieee80211_hw_config [mac80211]
ieee80211_bss_info_change_notify [mac80211]
ieee80211_reset_erp_info [mac80211]
ieee80211_report_low_ack [mac80211]
ieee80211_report_used_skb [mac80211]
ieee80211_free_txskb [mac80211]
ieee80211_tx_status_irqsafe [mac80211]
ieee80211_lost_packet [mac80211]
ieee80211_tx_status_noskb [mac80211]
[..]](https://image.slidesharecdn.com/understanding-linux-ftrace-kernel-recipes-2017-171007150617/85/Kernel-Recipes-2017-Understanding-the-Linux-kernel-via-ftrace-Steven-Rostedt-109-320.jpg)
![Filter specific modules
# lsmod | grep iwldvm
iwldvm 139264 0
mac80211 671744 1 iwldvm
iwlwifi 147456 1 iwldvm
cfg80211 589824 3 iwlwifi,mac80211,iwldvm
# trace-cmd start -p nop -l ‘:mod:mac80211’
# trace-cmd show --ftrace_filter
ieee80211_restart_hw [mac80211]
ieee80211_alloc_hw_nm [mac80211]
ieee80211_tasklet_handler [mac80211]
ieee80211_restart_work [mac80211]
ieee80211_unregister_hw [mac80211]
ieee80211_free_hw [mac80211]
ieee80211_free_ack_frame [mac80211]
ieee80211_ifa6_changed [mac80211]
ieee80211_register_hw [mac80211]
ieee80211_ifa_changed [mac80211]
ieee80211_configure_filter [mac80211]
ieee80211_reconfig_filter [mac80211]
ieee80211_hw_config [mac80211]
ieee80211_bss_info_change_notify [mac80211]
ieee80211_reset_erp_info [mac80211]
ieee80211_report_low_ack [mac80211]
ieee80211_report_used_skb [mac80211]
ieee80211_free_txskb [mac80211]
ieee80211_tx_status_irqsafe [mac80211]
ieee80211_lost_packet [mac80211]
ieee80211_tx_status_noskb [mac80211]
[..]](https://image.slidesharecdn.com/understanding-linux-ftrace-kernel-recipes-2017-171007150617/85/Kernel-Recipes-2017-Understanding-the-Linux-kernel-via-ftrace-Steven-Rostedt-110-320.jpg)
![Filter specific modules
# echo ieee80211_rx_napi:stacktrace >> set_ftrace_filter
# tail set_ftrace_filter
minstrel_ht_rate_init [mac80211]
minstrel_ht_alloc_sta [mac80211]
minstrel_ht_get_tp_avg [mac80211]
rc80211_minstrel_ht_exit [mac80211]
ibss_setup_channels [mac80211]
ieee80211_sta_join_ibss [mac80211]
ieee80211_csa_finalize.part.16 [mac80211]
ieee80211_amsdu_realloc_pad.isra.39 [mac80211]
ieee80211_assoc_success [mac80211]
ieee80211_rx_napi [mac80211]:stacktrace:unlimited](https://image.slidesharecdn.com/understanding-linux-ftrace-kernel-recipes-2017-171007150617/85/Kernel-Recipes-2017-Understanding-the-Linux-kernel-via-ftrace-Steven-Rostedt-111-320.jpg)
![Filter specific modules
# trace-cmd start -p nop -l ‘ieee80211_rx_napi:stacktrace’ -l ‘:mod:mac80211’
# trace-cmd show --ftrace_filter | tail
minstrel_ht_rate_init [mac80211]
minstrel_ht_alloc_sta [mac80211]
minstrel_ht_get_tp_avg [mac80211]
rc80211_minstrel_ht_exit [mac80211]
ibss_setup_channels [mac80211]
ieee80211_sta_join_ibss [mac80211]
ieee80211_csa_finalize.part.16 [mac80211]
ieee80211_amsdu_realloc_pad.isra.39 [mac80211]
ieee80211_assoc_success [mac80211]
ieee80211_rx_napi [mac80211]:stacktrace:unlimited](https://image.slidesharecdn.com/understanding-linux-ftrace-kernel-recipes-2017-171007150617/85/Kernel-Recipes-2017-Understanding-the-Linux-kernel-via-ftrace-Steven-Rostedt-112-320.jpg)

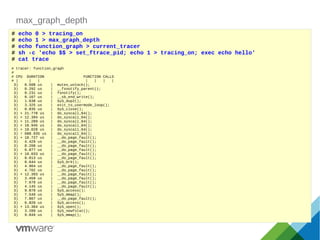
![max_graph_depth
# cd ~
# trace-cmd record -p function_graph --max-graph-depth 1 echo hello
# trace-cmd report
cpus=4
trace-cmd-11650 [000] 426375.818285: funcgraph_entry: | from_kgid() {
trace-cmd-11649 [003] 426375.818285: funcgraph_entry: | seq_puts() {
echo-11651 [001] 426375.818285: funcgraph_entry: | mutex_unlock() {
trace-cmd-11649 [003] 426375.818286: funcgraph_exit: 0.107 us | }
trace-cmd-11649 [003] 426375.818287: funcgraph_entry: 0.075 us | seq_puts();
echo-11651 [001] 426375.818287: funcgraph_entry: | smp_irq_work_interrupt() {
trace-cmd-11649 [003] 426375.818287: funcgraph_entry: | kernfs_sop_show_options() {
trace-cmd-11650 [000] 426375.818287: funcgraph_entry: | smp_irq_work_interrupt() {
trace-cmd-11649 [003] 426375.818288: funcgraph_exit: 0.579 us | }
trace-cmd-11649 [003] 426375.818288: funcgraph_entry: 0.072 us | seq_puts();
trace-cmd-11649 [003] 426375.818288: funcgraph_entry: 0.070 us | m_next();
trace-cmd-11649 [003] 426375.818289: funcgraph_entry: 1.917 us | m_show();
echo-11651 [001] 426375.818291: funcgraph_exit: 3.710 us | }
trace-cmd-11649 [003] 426375.818291: funcgraph_entry: 0.074 us | m_next();
echo-11651 [001] 426375.818291: funcgraph_exit: 0.086 us | }
trace-cmd-11649 [003] 426375.818291: funcgraph_entry: | m_show() {
<idle>-0 [002] 426375.818291: funcgraph_entry: | sched_idle_set_state() {
echo-11651 [001] 426375.818292: funcgraph_entry: 0.053 us | __fsnotify_parent();
echo-11651 [001] 426375.818292: funcgraph_entry: 0.114 us | fsnotify();
<idle>-0 [002] 426375.818292: funcgraph_exit: 0.194 us | }
echo-11651 [001] 426375.818292: funcgraph_entry: 0.045 us | __sb_end_write();
trace-cmd-11650 [000] 426375.818293: funcgraph_exit: 5.377 us | }
<idle>-0 [002] 426375.818293: funcgraph_entry: | cpuidle_reflect() {
echo-11651 [001] 426375.818293: funcgraph_entry: 0.066 us | __f_unlock_pos();
trace-cmd-11650 [000] 426375.818293: funcgraph_exit: 0.115 us | }
<idle>-0 [002] 426375.818293: funcgraph_exit: 0.152 us | }
trace-cmd-11650 [000] 426375.818293: funcgraph_entry: | inode_permission() {
<idle>-0 [002] 426375.818293: funcgraph_entry: | rcu_idle_exit() {
trace-cmd-11649 [003] 426375.818293: funcgraph_exit: 1.891 us | }
trace-cmd-11649 [003] 426375.818294: funcgraph_entry: | m_next() {
<idle>-0 [002] 426375.818294: funcgraph_exit: 0.087 us | }
trace-cmd-11650 [000] 426375.818294: funcgraph_exit: 0.196 us | }
trace-cmd-11649 [003] 426375.818294: funcgraph_exit: 0.049 us | }
<idle>-0 [002] 426375.818294: funcgraph_entry: | arch_cpu_idle_exit() {
trace-cmd-11649 [003] 426375.818294: funcgraph_entry: | m_show() {
trace-cmd-11650 [000] 426375.818294: funcgraph_entry: | security_inode_create() {
<idle>-0 [002] 426375.818294: funcgraph_exit: 0.044 us | }
trace-cmd-11650 [000] 426375.818294: funcgraph_exit: 0.077 us | }
<idle>-0 [002] 426375.818294: funcgraph_entry: | tick_nohz_idle_exit() {](https://image.slidesharecdn.com/understanding-linux-ftrace-kernel-recipes-2017-171007150617/85/Kernel-Recipes-2017-Understanding-the-Linux-kernel-via-ftrace-Steven-Rostedt-114-320.jpg)
![Events
# trace-cmd list -e
kvmmmu:kvm_mmu_pagetable_walk
kvmmmu:kvm_mmu_paging_element
kvmmmu:kvm_mmu_set_accessed_bit
kvmmmu:kvm_mmu_set_dirty_bit
kvmmmu:kvm_mmu_walker_error
kvmmmu:kvm_mmu_get_page
kvmmmu:kvm_mmu_sync_page
kvmmmu:kvm_mmu_unsync_page
kvmmmu:kvm_mmu_prepare_zap_page
kvmmmu:mark_mmio_spte
kvmmmu:handle_mmio_page_fault
kvmmmu:fast_page_fault
kvmmmu:kvm_mmu_invalidate_zap_all_pages
kvmmmu:check_mmio_spte
kvm:kvm_entry
kvm:kvm_hypercall
kvm:kvm_hv_hypercall
kvm:kvm_pio
[..]
# trace-cmd list -e irq:
irq:softirq_raise
irq:softirq_exit
irq:softirq_entry
irq:irq_handler_exit
irq:irq_handler_entry
# trace-cmd list -e irq_hander_entry
irq:irq_handler_entry](https://image.slidesharecdn.com/understanding-linux-ftrace-kernel-recipes-2017-171007150617/85/Kernel-Recipes-2017-Understanding-the-Linux-kernel-via-ftrace-Steven-Rostedt-116-320.jpg)
![Events
# echo nop > current_tracer
# echo 1 > events/sched/enable
# echo 1 > events/irq/enable
# echo 1 > events/timer/enable
# cat trace
# tracer: nop
#
# entries-in-buffer/entries-written: 150216/509830 #P:4
#
# _-----=> irqs-off
# / _----=> need-resched
# | / _---=> hardirq/softirq
# || / _--=> preempt-depth
# ||| / delay
# TASK-PID CPU# |||| TIMESTAMP FUNCTION
# | | | |||| | |
<idle>-0 [001] ..s. 327484.418266: timer_expire_entry: timer=ffffaaa2c1913e10 function=process_timeout
now=4376764065
<idle>-0 [001] d.s. 327484.418267: sched_waking: comm=rcu_sched pid=8 prio=120 target_cpu=001
<idle>-0 [001] dNs. 327484.418271: sched_wakeup: comm=rcu_sched pid=8 prio=120 target_cpu=001
<idle>-0 [001] .Ns. 327484.418271: timer_expire_exit: timer=ffffaaa2c1913e10
<idle>-0 [001] .Ns. 327484.418273: softirq_exit: vec=1 [action=TIMER]
<idle>-0 [001] .Ns. 327484.418273: softirq_entry: vec=7 [action=SCHED]
<idle>-0 [001] .Ns. 327484.418294: softirq_exit: vec=7 [action=SCHED]
<idle>-0 [001] d... 327484.418299: sched_switch: prev_comm=swapper/1 prev_pid=0 prev_prio=120 prev_state=R
==> next_comm=rcu_sched next_pid=8 next_prio=120
rcu_sched-8 [001] .... 327484.418307: timer_init: timer=ffffaaa2c1913e10
rcu_sched-8 [001] d... 327484.418307: timer_start: timer=ffffaaa2c1913e10 function=process_timeout
expires=4376764066 [timeout=1] cpu=1 idx=0 flags=
rcu_sched-8 [001] d... 327484.418309: sched_stat_runtime: comm=rcu_sched pid=8 runtime=34723 [ns]
vruntime=242925268368660 [ns]
rcu_sched-8 [001] d... 327484.418330: sched_switch: prev_comm=rcu_sched prev_pid=8 prev_prio=120 prev_state=S
==> next_comm=swapper/1 next_pid=0 next_prio=120
<idle>-0 [001] d... 327484.418334: tick_stop: success=1 dependency=NONE
<idle>-0 [001] d... 327484.418335: hrtimer_cancel: hrtimer=ffff9d768dc94800](https://image.slidesharecdn.com/understanding-linux-ftrace-kernel-recipes-2017-171007150617/85/Kernel-Recipes-2017-Understanding-the-Linux-kernel-via-ftrace-Steven-Rostedt-117-320.jpg)
![Events
# trace-cmd start -p nop -e sched -e irq -e timer
# trace-cmd show
# tracer: nop
#
# entries-in-buffer/entries-written: 150216/509830 #P:4
#
# _-----=> irqs-off
# / _----=> need-resched
# | / _---=> hardirq/softirq
# || / _--=> preempt-depth
# ||| / delay
# TASK-PID CPU# |||| TIMESTAMP FUNCTION
# | | | |||| | |
<idle>-0 [001] ..s. 327484.418266: timer_expire_entry: timer=ffffaaa2c1913e10 function=process_timeout
now=4376764065
<idle>-0 [001] d.s. 327484.418267: sched_waking: comm=rcu_sched pid=8 prio=120 target_cpu=001
<idle>-0 [001] dNs. 327484.418271: sched_wakeup: comm=rcu_sched pid=8 prio=120 target_cpu=001
<idle>-0 [001] .Ns. 327484.418271: timer_expire_exit: timer=ffffaaa2c1913e10
<idle>-0 [001] .Ns. 327484.418273: softirq_exit: vec=1 [action=TIMER]
<idle>-0 [001] .Ns. 327484.418273: softirq_entry: vec=7 [action=SCHED]
<idle>-0 [001] .Ns. 327484.418294: softirq_exit: vec=7 [action=SCHED]
<idle>-0 [001] d... 327484.418299: sched_switch: prev_comm=swapper/1 prev_pid=0 prev_prio=120 prev_state=R
==> next_comm=rcu_sched next_pid=8 next_prio=120
rcu_sched-8 [001] .... 327484.418307: timer_init: timer=ffffaaa2c1913e10
rcu_sched-8 [001] d... 327484.418307: timer_start: timer=ffffaaa2c1913e10 function=process_timeout
expires=4376764066 [timeout=1] cpu=1 idx=0 flags=
rcu_sched-8 [001] d... 327484.418309: sched_stat_runtime: comm=rcu_sched pid=8 runtime=34723 [ns]
vruntime=242925268368660 [ns]
rcu_sched-8 [001] d... 327484.418330: sched_switch: prev_comm=rcu_sched prev_pid=8 prev_prio=120 prev_state=S
==> next_comm=swapper/1 next_pid=0 next_prio=120
<idle>-0 [001] d... 327484.418334: tick_stop: success=1 dependency=NONE
<idle>-0 [001] d... 327484.418335: hrtimer_cancel: hrtimer=ffff9d768dc94800](https://image.slidesharecdn.com/understanding-linux-ftrace-kernel-recipes-2017-171007150617/85/Kernel-Recipes-2017-Understanding-the-Linux-kernel-via-ftrace-Steven-Rostedt-118-320.jpg)
![set_event_pid
# echo 0 > tracing_on
# echo 1 > events/syscalls/enable
# echo 1 > events/exceptions/enable
# sh -c 'echo $$ > set_event_pid; echo 1 > tracing_on; exec echo hello'
# cat trace
# tracer: nop
#
# entries-in-buffer/entries-written: 128/128 #P:4
#
# _-----=> irqs-off
# / _----=> need-resched
# | / _---=> hardirq/softirq
# || / _--=> preempt-depth
# ||| / delay
# TASK-PID CPU# |||| TIMESTAMP FUNCTION
# | | | |||| | |
echo-25556 [001] .... 328256.501048: sys_write -> 0x2
echo-25556 [001] .... 328256.501050: sys_dup2(oldfd: a, newfd: 1)
echo-25556 [001] .... 328256.501051: sys_dup2 -> 0x1
echo-25556 [001] .... 328256.501053: sys_close(fd: a)
echo-25556 [001] .... 328256.501053: sys_close -> 0x0
echo-25556 [001] d... 328256.501226: page_fault_kernel: address=0x55b416b60220 ip=__clear_user error_code=0x2
echo-25556 [001] d... 328256.501242: page_fault_kernel: address=0x7f3f615b7fc0 ip=__clear_user error_code=0x2
echo-25556 [001] d... 328256.501253: page_fault_kernel: address=0x7fffd199a1c9 ip=copy_user_enhanced_fast_string error_code
echo-25556 [001] d... 328256.501258: page_fault_kernel: address=0x7fffd1999ef0 ip=load_elf_binary error_code=0x2
echo-25556 [001] d... 328256.501273: page_fault_user: address=0x7f3f61393c20 ip=0x7f3f61393c20 error_code=0x14
echo-25556 [001] d... 328256.501279: page_fault_user: address=0x7f3f615b6e70 ip=0x7f3f6139487f error_code=0x4
echo-25556 [001] d... 328256.501281: page_fault_user: address=0x7f3f615b6c60 ip=0x7f3f61394886 error_code=0x7
echo-25556 [001] d... 328256.501285: page_fault_user: address=0x7f3f613af340 ip=0x7f3f61394c60 error_code=0x4
echo-25556 [001] d... 328256.501290: page_fault_user: address=0x7f3f615b8100 ip=0x7f3f613aa743 error_code=0x6
echo-25556 [001] .... 328256.501294: sys_brk(brk: 0)
echo-25556 [001] .... 328256.501295: sys_brk -> 0x55b417e5a000
echo-25556 [001] d... 328256.501297: page_fault_user: address=0x7fffd1998d20 ip=0x7f3f61394f77 error_code=0x6
echo-25556 [001] d... 328256.501300: page_fault_user: address=0x7f3f613b03b2 ip=0x7f3f613ae276 error_code=0x4
echo-25556 [001] d... 328256.501304: page_fault_user: address=0x55b416959040 ip=0x7f3f6139549e error_code=0x4
echo-25556 [001] d... 328256.501310: page_fault_user: address=0x55b416b5fdd8 ip=0x7f3f61395616 error_code=0x4
echo-25556 [001] d... 328256.501312: page_fault_user: address=0x55b416b5feb0 ip=0x7f3f613956bf error_code=0x7
echo-25556 [001] d... 328256.501316: page_fault_user: address=0x7fffd19ae038 ip=0x7f3f61395827 error_code=0x4
echo-25556 [001] .... 328256.501320: sys_access(filename: 7f3f613b086a, mode: 0)
[...]](https://image.slidesharecdn.com/understanding-linux-ftrace-kernel-recipes-2017-171007150617/85/Kernel-Recipes-2017-Understanding-the-Linux-kernel-via-ftrace-Steven-Rostedt-119-320.jpg)
![set_event_pid
# cd ~
# trace-cmd record -e syscalls -e exceptions -F echo hello
# trace-cmd report
CPU 2 is empty
CPU 3 is empty
cpus=4
echo-11894 [001] 426948.703111: sys_exit_write: 0x1
echo-11894 [001] 426948.703147: page_fault_user: address=0x7fb9671d05a4f ip=0x7fb9677652d2f error_code=0x4
echo-11894 [001] 426948.703173: page_fault_user: address=0x7fb9671ee060f ip=0x7fb9671ee060f error_code=0x14
echo-11894 [001] 426948.703185: page_fault_user: address=0x7fb9672adc20f ip=0x7fb9672adc20f error_code=0x14
echo-11894 [000] 426948.703668: page_fault_kernel: address=0x5599408bf220f ip=__clear_user error_code=0x2
echo-11894 [000] 426948.703743: page_fault_kernel: address=0x7f48659fefc0f ip=__clear_user error_code=0x2
echo-11894 [000] 426948.703769: page_fault_kernel: address=0x7ffc031d37c9f ip=copy_user_enhanced_fast_string error_code=0
echo-11894 [000] 426948.703812: page_fault_user: address=0x7f48657dac20f ip=0x7f48657dac20f error_code=0x14
echo-11894 [000] 426948.703827: page_fault_user: address=0x7f48659fde70f ip=0x7f48657db87ff error_code=0x4
echo-11894 [000] 426948.703833: page_fault_user: address=0x7f48659fdc60f ip=0x7f48657db886f error_code=0x7
echo-11894 [000] 426948.703843: page_fault_user: address=0x7f48657f6340f ip=0x7f48657dbc60f error_code=0x4
echo-11894 [000] 426948.703852: page_fault_user: address=0x7f48659ff100f ip=0x7f48657f1743f error_code=0x6
echo-11894 [000] 426948.703861: sys_enter_brk: brk: 0x00000000
echo-11894 [000] 426948.703864: sys_exit_brk: 0x55994164d000
echo-11894 [000] 426948.703869: page_fault_user: address=0x7ffc031d2320f ip=0x7f48657dbf77f error_code=0x6
echo-11894 [000] 426948.703877: page_fault_user: address=0x5599406b8040f ip=0x7f48657dc49ef error_code=0x4
echo-11894 [000] 426948.703889: page_fault_user: address=0x5599408bedd8f ip=0x7f48657dc616f error_code=0x4
echo-11894 [000] 426948.703895: page_fault_user: address=0x5599408beeb0f ip=0x7f48657dc6bff error_code=0x7
echo-11894 [000] 426948.703903: page_fault_user: address=0x7ffc031da038f ip=0x7f48657dc827f error_code=0x4
echo-11894 [000] 426948.703918: sys_enter_access: filename: 0x7f48657f786a, mode: 0x00000000
echo-11894 [000] 426948.703937: sys_exit_access: 0xfffffffffffffffe
echo-11894 [000] 426948.703941: sys_enter_mmap: addr: 0x00000000, len: 0x00003000, prot: 0x00000003, flags: 0x00000022
echo-11894 [000] 426948.703947: sys_exit_mmap: 0x7f48659fa000
echo-11894 [000] 426948.703949: page_fault_user: address=0x7f48659fa018f ip=0x7f48657e2227f error_code=0x6
echo-11894 [000] 426948.703956: page_fault_user: address=0x7f48657ea060f ip=0x7f48657ea060f error_code=0x14
echo-11894 [000] 426948.703965: sys_enter_access: filename: 0x7f48657f9fe0, mode: 0x00000004
echo-11894 [000] 426948.703969: sys_exit_access: 0xfffffffffffffffe
echo-11894 [000] 426948.703972: page_fault_user: address=0x7ffc031d1ff8f ip=0x7f48657e2612f error_code=0x6
echo-11894 [000] 426948.703981: sys_enter_open: filename: 0x7f48657f7d02, flags: 0x00080000, mode: 0x00000001
echo-11894 [000] 426948.703991: sys_exit_open: 0x3
echo-11894 [000] 426948.703992: sys_enter_newfstat: fd: 0x00000003, statbuf: 0x7ffc031d1ae0
echo-11894 [000] 426948.703997: sys_exit_newfstat: 0x0
echo-11894 [000] 426948.703998: sys_enter_mmap: addr: 0x00000000, len: 0x0001df78, prot: 0x00000001, flags: 0x00000002
echo-11894 [000] 426948.704004: sys_exit_mmap: 0x7f48659dc000
echo-11894 [000] 426948.704005: sys_enter_close: fd: 0x00000003
echo-11894 [000] 426948.704006: sys_exit_close: 0x0
echo-11894 [000] 426948.704009: page_fault_user: address=0x7f48659dc000f ip=0x7f48657f598cf error_code=0x4
[...]](https://image.slidesharecdn.com/understanding-linux-ftrace-kernel-recipes-2017-171007150617/85/Kernel-Recipes-2017-Understanding-the-Linux-kernel-via-ftrace-Steven-Rostedt-120-320.jpg)
![set_event_pid
# echo 0 > tracing_on
# echo 1 > events/syscalls/enable
# echo 1 > events/exceptions/enable
# echo 1 > options/event-fork
# echo $$ > set_event_pid
# echo 1 > tracing_on; /bin/echo hello; echo 0 > tracing_on
# cat trace
# tracer: nop
#
# entries-in-buffer/entries-written: 310/310 #P:4
#
# _-----=> irqs-off
# / _----=> need-resched
# | / _---=> hardirq/softirq
# || / _--=> preempt-depth
# ||| / delay
# TASK-PID CPU# |||| TIMESTAMP FUNCTION
# | | | |||| | |
bash-25022 [002] .... 340241.280549: sys_write -> 0x2
bash-25022 [002] .... 340241.280557: sys_dup2(oldfd: a, newfd: 1)
bash-25022 [002] .... 340241.280559: sys_dup2 -> 0x1
bash-25022 [002] .... 340241.280565: sys_fcntl(fd: a, cmd: 1, arg: 0)
bash-25022 [002] .... 340241.280565: sys_fcntl -> 0x1
bash-25022 [002] .... 340241.280568: sys_close(fd: a)
bash-25022 [002] .... 340241.280569: sys_close -> 0x0
bash-25022 [002] .... 340241.280610: sys_rt_sigprocmask(how: 0, nset: 7ffe3c06bb70, oset: 7ffe3c06bbf0, sigsetsize: 8)
bash-25022 [002] .... 340241.280613: sys_rt_sigprocmask -> 0x0
bash-25022 [002] .... 340241.280615: sys_pipe(fildes: 703e18)
bash-25022 [002] .... 340241.280641: sys_pipe -> 0x0
bash-25022 [002] d... 340241.281171: page_fault_user: address=0x70e98c ip=0x44d5dc error_code=0x7
bash-25022 [002] d... 340241.281190: page_fault_user: address=0x70d540 ip=0x44d450 error_code=0x7
echo-29091 [001] d... 340241.281192: page_fault_kernel: address=0x7f8ea6fb8e10 ip=__put_user_4 error_code=0x3
bash-25022 [002] d... 340241.281199: page_fault_user: address=0x7ffe3c06bb48 ip=0x44d45d error_code=0x7
bash-25022 [002] .... 340241.281209: sys_setpgid(pid: 71a3, pgid: 71a3)
bash-25022 [002] .... 340241.281213: sys_setpgid -> 0x0
bash-25022 [002] d... 340241.281217: page_fault_user: address=0x710713 ip=0x4c8f65 error_code=0x7
echo-29091 [001] d... 340241.281220: page_fault_user: address=0x7f8ea66a334b ip=0x7f8ea66a334b error_code=0x14
bash-25022 [002] d... 340241.281225: page_fault_user: address=0x1549580 ip=0x4c8fcd error_code=0x7
bash-25022 [002] d... 340241.281236: page_fault_user: address=0x703e10 ip=0x44d53e error_code=0x7
bash-25022 [002] .... 340241.281245: sys_rt_sigprocmask(how: 2, nset: 7ffe3c06bbf0, oset: 0, sigsetsize: 8)
echo-29091 [001] d... 340241.281246: page_fault_user: address=0x7f8ea6fb9160 ip=0x7f8ea66a337d error_code=0x7
[...]](https://image.slidesharecdn.com/understanding-linux-ftrace-kernel-recipes-2017-171007150617/85/Kernel-Recipes-2017-Understanding-the-Linux-kernel-via-ftrace-Steven-Rostedt-121-320.jpg)
![set_event_pid
# cd ~
# trace-cmd record -e syscalls -e exceptions -F echo hello
# trace-cmd report
CPU 0 is empty
CPU 2 is empty
CPU 3 is empty
cpus=4
echo-11955 [001] 427105.922200: sys_exit_write: 0x1
echo-11955 [001] 427105.922248: page_fault_user: address=0x7f405f6eb060f ip=0x7f405f6eb060f error_code=0x14
echo-11955 [001] 427105.922275: page_fault_user: address=0x7f405f7aac20f ip=0x7f405f7aac20f error_code=0x14
echo-11955 [001] 427105.922750: page_fault_kernel: address=0x55aa7e2db220f ip=__clear_user error_code=0x2
echo-11955 [001] 427105.922794: page_fault_kernel: address=0x7fc23a862fc0f ip=__clear_user error_code=0x2
echo-11955 [001] 427105.922817: page_fault_kernel: address=0x7fff2e9473d9f ip=copy_user_enhanced_fast_string error_code=0
echo-11955 [001] 427105.922856: page_fault_user: address=0x7fc23a63ec20f ip=0x7fc23a63ec20f error_code=0x14
echo-11955 [001] 427105.922868: page_fault_user: address=0x7fc23a861e70f ip=0x7fc23a63f87ff error_code=0x4
echo-11955 [001] 427105.922874: page_fault_user: address=0x7fc23a861c60f ip=0x7fc23a63f886f error_code=0x7
echo-11955 [001] 427105.922884: page_fault_user: address=0x7fc23a65a340f ip=0x7fc23a63fc60f error_code=0x4
echo-11955 [001] 427105.922894: page_fault_user: address=0x7fc23a863100f ip=0x7fc23a655743f error_code=0x6
echo-11955 [001] 427105.922901: page_fault_user: address=0x7fff2e946ff8f ip=0x7fc23a6557ddf error_code=0x6
echo-11955 [001] 427105.922908: sys_enter_brk: brk: 0x00000000
echo-11955 [001] 427105.922910: sys_exit_brk: 0x55aa7e443000
echo-11955 [001] 427105.922916: page_fault_user: address=0x7fff2e945f30f ip=0x7fc23a63ff77f error_code=0x6
echo-11955 [001] 427105.922924: page_fault_user: address=0x55aa7e0d4040f ip=0x7fc23a64049ef error_code=0x4
echo-11955 [001] 427105.922937: page_fault_user: address=0x55aa7e2dadd8f ip=0x7fc23a640616f error_code=0x4
echo-11955 [001] 427105.922943: page_fault_user: address=0x55aa7e2daeb0f ip=0x7fc23a6406bff error_code=0x7
echo-11955 [001] 427105.922951: page_fault_user: address=0x7fff2e961038f ip=0x7fc23a640827f error_code=0x4
echo-11955 [001] 427105.922960: sys_enter_access: filename: 0x7fc23a65b86a, mode: 0x00000000
echo-11955 [001] 427105.922969: sys_exit_access: 0xfffffffffffffffe
echo-11955 [001] 427105.922971: sys_enter_mmap: addr: 0x00000000, len: 0x00003000, prot: 0x00000003, flags: 0x00000022
echo-11955 [001] 427105.922977: sys_exit_mmap: 0x7fc23a85e000
echo-11955 [001] 427105.922979: page_fault_user: address=0x7fc23a85e018f ip=0x7fc23a646227f error_code=0x6
echo-11955 [001] 427105.922987: page_fault_user: address=0x7fc23a64e060f ip=0x7fc23a64e060f error_code=0x14
echo-11955 [001] 427105.922995: sys_enter_access: filename: 0x7fc23a65dfe0, mode: 0x00000004
echo-11955 [001] 427105.922999: sys_exit_access: 0xfffffffffffffffe
echo-11955 [001] 427105.923006: sys_enter_open: filename: 0x7fc23a65bd02, flags: 0x00080000, mode: 0x00000001
echo-11955 [001] 427105.923015: sys_exit_open: 0x3
echo-11955 [001] 427105.923015: sys_enter_newfstat: fd: 0x00000003, statbuf: 0x7fff2e9456f0
echo-11955 [001] 427105.923020: sys_exit_newfstat: 0x0
echo-11955 [001] 427105.923021: sys_enter_mmap: addr: 0x00000000, len: 0x0001df78, prot: 0x00000001, flags: 0x00000002
echo-11955 [001] 427105.923027: sys_exit_mmap: 0x7fc23a840000
echo-11955 [001] 427105.923028: sys_enter_close: fd: 0x00000003
echo-11955 [001] 427105.923029: sys_exit_close: 0x0
echo-11955 [001] 427105.923032: page_fault_user: address=0x7fc23a840000f ip=0x7fc23a65998cf error_code=0x4
[...]](https://image.slidesharecdn.com/understanding-linux-ftrace-kernel-recipes-2017-171007150617/85/Kernel-Recipes-2017-Understanding-the-Linux-kernel-via-ftrace-Steven-Rostedt-122-320.jpg)


The document is a presentation about the Linux kernel's ftrace, which is the official tracer added in version 2.6.31. It covers various aspects of ftrace, including tracing functions, using different tracers, and setting filters to analyze system call functions. The speaker provides a detailed guide on how to enable, disable, and customize tracing features within the Linux kernel for performance analysis.