Downloaded 1,376 times
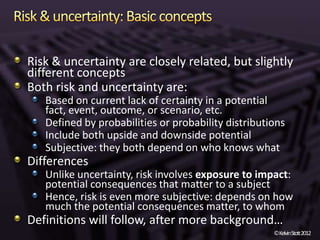

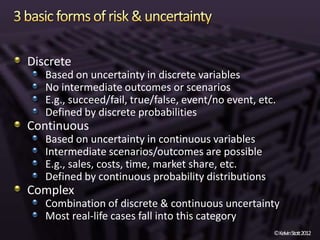
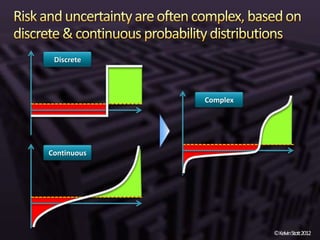
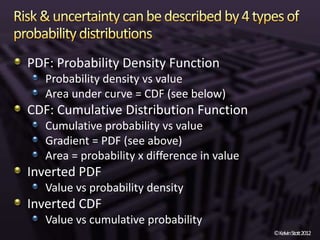
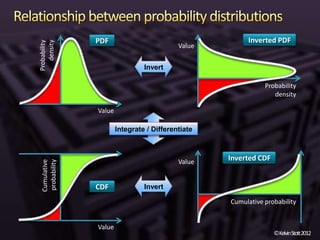
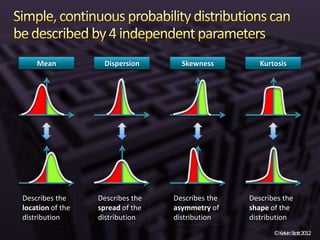
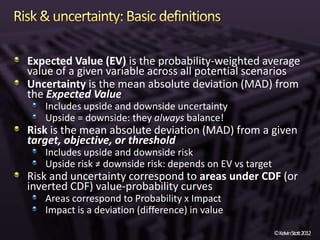
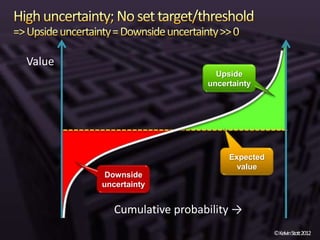
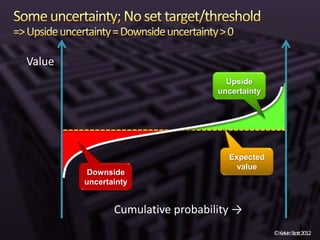
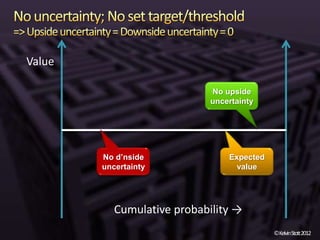
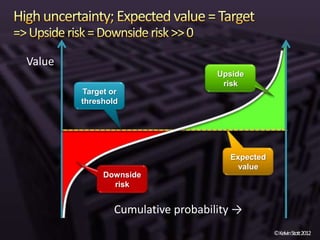
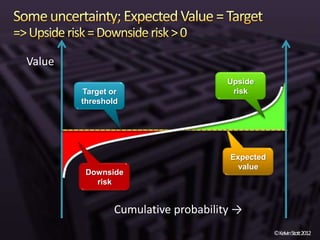
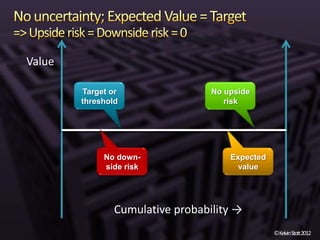
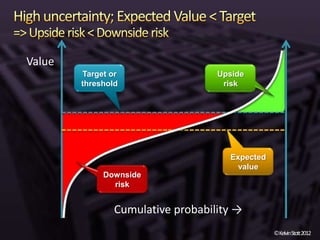
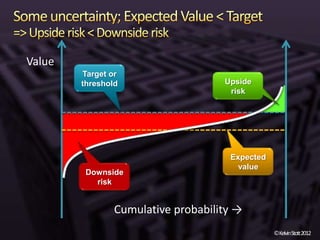
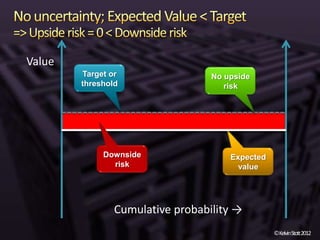
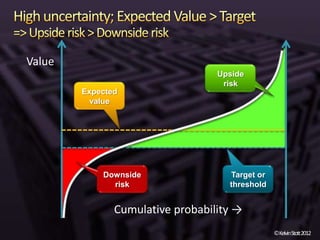
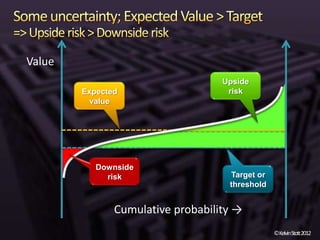
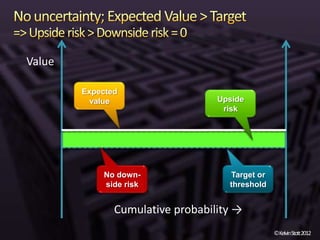
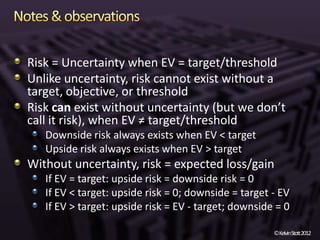
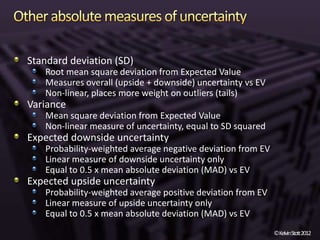
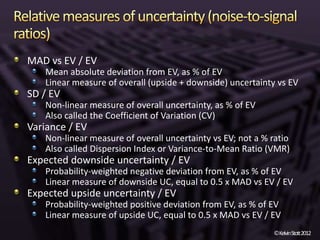
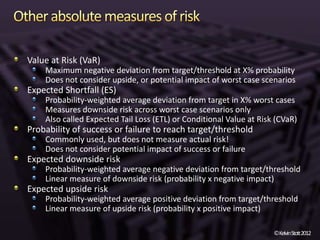
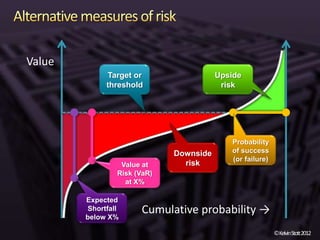
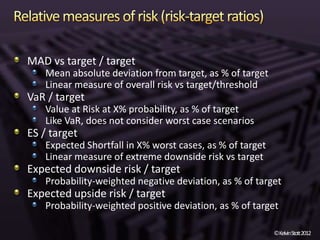
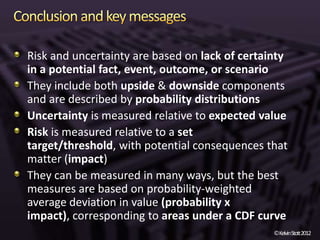


The document discusses the concepts of risk and uncertainty, emphasizing their subjective nature and the difference between them, with risk being associated with potential consequences and uncertainty linked to lack of knowledge. It outlines various types of known and unknown variables, explaining how to measure uncertainty and risk through probability distributions and expected values. Additionally, it describes key metrics such as expected downside/upside risk, value at risk, and expected shortfall, highlighting their importance in assessing potential impacts on targets or thresholds.


