The document discusses properties that an ideal risk measure should possess. It outlines 7 key properties: [1] Asymmetry, [2] Relative to benchmarks, [3] Investor-specific, [4] Multidimensional, [5] Completeness, [6] Numerically positive, and [7] Non-linearity. It examines some common risk measures and finds they fail to fully capture these ideal properties. For example, value at risk and standard deviation are not coherent risk measures as they violate properties like subadditivity and sensitivity to order. The document advocates first defining the ideal risk measure properties before selecting the best approach.
This document provides a summary of a lecture on financial risk management and modern portfolio theory. The key topics covered include measuring risk using various risk measures like value at risk, expected shortfall, and modified value at risk. It also discusses portfolio risk concepts and how to break down overall portfolio risk into individual position risks. Finally, it outlines modern portfolio theory, including Markowitz portfolios, the efficient frontier, and empirical considerations for building mean-variance efficient portfolios.
These Lecture series are relating the use R language software, its interface and functions required to evaluate financial risk models. Furthermore, R software applications relating financial market data, measuring risk, modern portfolio theory, risk modeling relating returns generalized hyperbolic and lambda distributions, Value at Risk (VaR) modelling, extreme value methods and models, the class of ARCH models, GARCH risk models and portfolio optimization approaches.
The document discusses various concepts related to risk and rates of return on investments. It defines different types of risk like stand-alone risk and portfolio risk. It also introduces the Capital Asset Pricing Model (CAPM) which relates a security's expected return to its risk compared to the overall market. The CAPM graphs expected returns against risks using the Security Market Line and shows how diversification reduces risk for a portfolio.
This document provides an overview of key topics in risk analysis, including definitions of risk and uncertainty, general categories of risk, methods of measuring risk such as probability distributions and expected value, and approaches to decision-making under risk and uncertainty. It discusses concepts like risk attitudes, utility theory, certainty equivalents, and decision rules from game theory like maximin and minimax regret. The goal is to help decision makers understand risk and make effective investment decisions.
Traditional Risk Assessments use "heat maps", or risk matrices, to develop rankings, leading to decision making on projects, operations. Risks are ranked from larger to lower, sometimes splitting them into three or more classes of criticality.
Those approaches may be complaint with ISO31000, ONR49000, COSO, but they are not the best you can do!
As we will show in this paper, they actually lack in focus and transparency. Ingenious methods allow to reuse those data, however, and make far better decisions based on rational and sustainable rankings.
Risk Measurement From Theory to Practice: Is Your Risk Metric Coherent and Em...amadei77
I present desirable features for a risk metric, incorporating the coherent risk framework and empirical features of markets. I argue that a desirable risk metric is one that is coherent and focused on measuring tail losses, which significantly affect investment performance. I evaluate 5 risk metrics: volatility, semi-standard deviation, downside deviation, Value at Risk (VaR) and Conditional Value at Risk (CVaR). I demonstrate that CVaR is the only coherent risk metric explicitly focused on measuring tail losses, which are an important, empirical feature of markets. CVaR is the most practically useful risk metric for an investor interested in minimizing declines in the value of a portfolio at stress points while maximizing returns. Through several examples, I demonstrate that the choice of a risk metric may lead to very different portfolios and investment performance due to differences in investment selection, portfolio construction and risk management. I also demonstrate that the focus on tail losses as opposed to volatility results in superior performance - much smaller declines in value at stress points with improvements in average and cumulative returns; similar results can be achieved with other risk metrics, which are not designed to measure tail losses like CVaR Based on empirical data, practical recommendations for investment analysis, portfolio construction and risk management are included throughout the article.
The document discusses probability-based approaches for calculating expected returns and variance under uncertainty. It provides an example using return data for a stock to calculate the expected return of 9.25% and variance of 0.02%. It also discusses how portfolio return and variance depends on asset weights, the individual asset expected returns and variances, and the correlation between the assets. Assuming the two example assets are perfectly negatively correlated, it calculates the asset weights needed for a zero risk portfolio and the expected return of that portfolio as 25.36%. Finally, it discusses limits to diversification in practice, such as the inability to hold all securities and that only unsystematic risk can be reduced through diversification.
1. The document discusses risk management trends for pension plans, including evolving techniques like liability-driven investing and dynamic asset allocation.
2. It explains how negative returns can impact long-term returns more than their arithmetic average suggests, due to the geometric nature of compound returns. Diversification across asset classes is important to manage this risk.
3. The article advocates establishing investment goals and benchmarks, then using tools like asset-liability modeling to evaluate portfolio alternatives and their risk exposures in order to implement solutions that improve the risk profile over time through dynamic asset allocation.
Bba 2204 fin mgt week 8 risk and returnStephen Ong
This document discusses risk and return in financial management. It provides learning goals related to understanding risk, return, and risk preferences. It defines risk as the uncertainty of returns from an investment and return as the total gain from an investment. It discusses measuring the risk of single assets using scenarios, probabilities, standard deviation, and the coefficient of variation. It also introduces the concept of measuring the risk and return of a portfolio by considering the correlation between assets.
A portfolio is made up of multiple securities that serves to hedge against risk. The return on a portfolio is calculated as the weighted average of the returns of the individual securities based on their proportion in the portfolio. Calculating the risk of a portfolio considers both the weighted risks of the securities and the correlation between their movements. The efficient frontier graphs the risk-reward tradeoff of different portfolios.
A Quantitative Risk Optimization Of Markowitz ModelAmir Kheirollah
This thesis investigates assumptions of the Markowitz model and evaluates alternative measures for risk-adjusted return. It analyzes Swedish large cap stock returns and finds evidence against the normal distribution assumption. The Sharpe ratio is found to be unreliable due to extreme events. Modified Sharpe ratios that incorporate higher moments like skewness and kurtosis provide more stable measures of portfolio performance over time. Monthly returns best replicate future portfolio performance when considering risk and return, as they experience less variation than daily or weekly returns. Incorporating skewness into the model slightly improves performance estimation for future periods relative to the traditional Markowitz approach.
The document discusses risk and return in investing. It explains that equity investments like stocks historically have higher average returns of over 10% compared to debt investments like bonds that return 3-4%, but stocks are also more volatile. It defines risk as the variability of returns, and introduces the concepts of systematic risk that affects all stocks equally and unsystematic risk that is specific to individual stocks. Diversification can reduce unsystematic risk but not systematic risk. It also discusses measuring market risk through a stock's beta value, which represents its volatility relative to the overall market.
1. The document discusses risk and return, defining concepts like expected return, risk, standard deviation, beta, and models like the Capital Asset Pricing Model (CAPM).
2. It provides examples of how to calculate expected return, standard deviation, and beta for both discrete and continuous probability distributions.
3. The CAPM model relates a security's expected return to market risk (beta) and the risk-free rate, stating that expected return equals the risk-free rate plus a risk premium based on beta.
Expected value return & standard deviationJahanzeb Memon
This document defines key concepts related to expected value, expected return, and standard deviation. It explains that expected value is the weighted average of all possible values of a random variable. Expected return is calculated by multiplying the probability and return of each possible scenario and summing the results. The document provides an example of calculating expected return using four scenarios. It also defines standard deviation as a measure of how spread out data is from the mean.
This chapter discusses portfolio risk and return. It introduces the concept that investors should care about systematic risk rather than total risk, as total risk can be reduced through diversification while systematic risk cannot. It outlines how modern portfolio theory uses beta to measure the sensitivity of an asset to market movements, representing systematic risk. The chapter also discusses how diversification reduces nonsystematic or idiosyncratic risk but not market risk, and how portfolio risk decreases as the number of assets in the portfolio increases, up to a certain point.
The document discusses key statistical terms used in analyzing portfolio performance including mean, standard deviation, variance, correlation coefficient, and normal distribution. It explains how mean measures average returns, variance and standard deviation measure risk/volatility, and correlation measures the relationship between two investments. The document also covers portfolio theory, the efficient frontier, and risk/return analysis tools like the Sharpe Ratio and Value at Risk (VAR) that are used to evaluate portfolio performance based on expected return and risk.
The Markowitz Model assists investors in selecting efficient portfolios by analyzing possible combinations of securities. It helps reduce risk through diversification by choosing securities whose price movements are not perfectly correlated. The model determines the efficient set of portfolios and allows investors to select the optimal portfolio based on their preferred risk-return tradeoff. Markowitz introduced diversification and showed holding multiple lower-risk securities can reduce overall portfolio risk compared to a single higher-risk security. The model calculates expected returns, variances, and correlations between securities to determine the minimum risk portfolio for a given level of return.
False discoveries in mutual fund performance presentation by mechinbast
This document summarizes a working paper that analyzes the impact of luck on mutual fund performance. The paper uses a new approach to control for "false discoveries" when evaluating the performance of over 2,000 mutual funds between 1975-2006. The key findings are:
1) Around 75% of funds exhibited zero alpha, consistent with prior research. Most of the remaining funds were "unskilled" rather than truly skilled.
2) Controlling for false discoveries substantially improves the ability to identify funds with persistent performance. The proportion of skilled funds is very small (<1%) and concentrated in the extreme right tail of estimated alpha distributions.
3) The approach uses statistical tests and Monte Carlo simulations to more accurately
Investing in a single asset carries unique risks based on the variability and standard deviation of that asset's historical returns. Diversifying among multiple unrelated assets reduces overall portfolio risk, as poor performance of some assets may be offset by positive returns from others. While any single asset could fail, it is less likely that all assets in a portfolio would fail at the same time by experiencing losses. Therefore, diversification helps stabilize returns and lower risk compared to investing in only a single asset.
FellowBuddy.com is an innovative platform that brings students together to share notes, exam papers, study guides, project reports and presentation for upcoming exams.
We connect Students who have an understanding of course material with Students who need help.
Benefits:-
# Students can catch up on notes they missed because of an absence.
# Underachievers can find peer developed notes that break down lecture and study material in a way that they can understand
# Students can earn better grades, save time and study effectively
Our Vision & Mission – Simplifying Students Life
Our Belief – “The great breakthrough in your life comes when you realize it, that you can learn anything you need to learn; to accomplish any goal that you have set for yourself. This means there are no limits on what you can be, have or do.”
Like Us - https://www.facebook.com/FellowBuddycom
financial management chapter 4 Risk and Returnsufyanraza1
This document provides an overview of key concepts related to risk and return in investments. It defines investment returns as the financial results of an investment expressed in dollar or percentage terms. Investment risk is the probability that the actual return will be lower than expected. Standard deviation measures the stand-alone risk of an investment, while beta measures the risk relative to the overall market. Diversifying investments across multiple uncorrelated assets reduces risk. The Security Market Line shows the relationship between risk and required return based on the Capital Asset Pricing Model.
Managerial Finance. "Risk and Return". Types of risk. Required return. Correlation. Diversification. Beta coefficient. Risk of a portfolio. Capital Asset Pricing Model. Security Market Line.
These Lecture series are relating the use R language software, its interface and functions required to evaluate financial risk models. Furthermore, R software applications relating financial market data, measuring risk, modern portfolio theory, risk modeling relating returns generalized hyperbolic and lambda distributions, Value at Risk (VaR) modelling, extreme value methods and models, the class of ARCH models, GARCH risk models and portfolio optimization approaches.
The document discusses the arbitrage pricing theory (APT), which relates a security's expected return to multiple common risk factors. It provides examples of how the APT can be used to model returns based on factors like inflation, GDP growth, and exchange rates. The APT assumes perfect capital markets, homogeneous investor expectations, and allows short selling and arbitrage opportunities. It implies a linear relationship between expected returns and factor sensitivities similar to the capital asset pricing model. Empirical tests provide some support for the APT but also have limitations.
This document discusses portfolio optimization using the tracking model method. It defines various types of investment risk that investors and financial institutions face, such as interest rate risk, business risk, credit risk, inflation risk, and reinvestment risk. It then examines various risk measures used in portfolio optimization models, including variance, mean absolute deviation, value at risk (VaR), and conditional value at risk (CVaR). The results section finds that using the tracking model and provided data, the portfolio is only feasible for a risk lover investor, as it invests entirely in the single best performing asset.
This document discusses how to design investment portfolios tailored to private investors' needs, goals, and aspirations based on their risk tolerance. It proposes using a liability-driven investment approach where liabilities (needs) are matched with lower-risk assets like bonds. Investor risk tolerance is assessed using a questionnaire measuring ability and willingness to take risk. Based on the assessment, investors are classified as conservative, moderate, or aggressive, and model portfolios with different asset allocations and expected risk/return profiles are provided for each classification.
- The document discusses various techniques for analyzing risk in capital budgeting decisions such as payback period, certainty equivalent, risk-adjusted discount rate, sensitivity analysis, scenario analysis, and simulation analysis.
- It also covers using decision trees for sequential investment decisions and incorporating utility theory to explicitly include a decision-maker's risk preferences in the capital budgeting analysis.
The document provides an analysis of expected returns in high yield bonds. It begins by outlining methods for accurately assessing risk, return, and the economic viability of investments in high yield corporate bonds. Key aspects include adjusting yield for expected default rates, calculating break-even default rates, and comparing risk-adjusted returns. The document then applies these methods to current high yield bond indices, finding that CCC bonds have negative expected returns, making them uneconomic, while BB bonds appear economically justified based on their expected returns relative to risk-free benchmarks. Caveats to the analysis are also noted.
The chapter discusses modern portfolio theory and management. It covers calculating portfolio returns and risk by taking weighted averages of constituent securities. Risk is reduced through diversification of uncorrelated assets. The Markowitz model selects optimal portfolios through analyzing the risk-return tradeoff. Introducing risk-free assets creates the Capital Market Line and market portfolio. The Capital Asset Pricing Model uses beta to predict expected returns based on the market risk premium and risk-free rate. It distinguishes systematic and non-systematic risk. Factor models extend this by considering additional economic factors beyond just the market.
The document discusses mean-variance analysis and the efficient frontier for portfolio optimization. It introduces the assumptions and concepts of mean-variance analysis, including indifference curves, efficiency criteria, and computing the mean and variance of portfolios. It then explains how to find the efficient frontier by solving a quadratic programming problem and examines the return and risk of individual securities and portfolios consisting of different asset allocations.
- Portfolio management involves determining the optimal mix of assets to achieve an investor's objectives while balancing risk and return. The key objectives include capital growth, security, liquidity, consistent returns, and tax planning.
- Modern portfolio theory, developed by Harry Markowitz, introduced the concept of efficient portfolios which maximize return for a given level of risk. The theory uses statistical measures like variance and standard deviation to quantify risk.
- Variance and standard deviation are commonly used to measure the risk of individual assets and portfolios. The variance of a portfolio is calculated using the covariance between asset returns to determine the portfolio's total risk.
This document discusses portfolio analysis and security analysis. It defines portfolio analysis as determining the future risk and return of holding various combinations of individual securities. Portfolio analysis involves diversifying investments across different assets, industries, and companies to reduce non-systematic risk. The document contrasts traditional portfolio analysis, which focuses on lowest risk securities, with modern portfolio theory, which emphasizes combining high and low risk securities to maximize returns at a given level of risk. Key aspects of portfolio analysis include calculating expected returns, variance, and the standard deviation and beta of a portfolio to measure risk. Diversification is presented as an important tool to reduce unsystematic risk.
Page 1 of 9 This material is only for the use of stud.docxkarlhennesey
Page 1 of 9
This material is only for the use of students enrolled in FIN 740 for purposes associated with the course and may not be
retained or further disseminated. All information in this material is proprietary to Dr. Sung Ik Kim. Scanning, copying,
posting to a website or reproducing and sharing in any form is strictly prohibited.
Chapter 10. Quantitative Risk Management in R
In this chapter, I explore how we can describe the risk of a single security or a portfolio (a set of assets).
Especially, I introduce the concept of value at risk (VaR) and expected shortfall (ES) here.
1. What is value at risk (VaR)?
Value at risk is one of the most widely used risk measure in finance. VaR was popularized by J.P. Morgan
in the 1990s. The executive at J.P. Morgan wanted their risk managers to generate one statistic that
summarized the risk of the firm’s entire portfolio at the end of each day. What they came up with was VaR,
which is now widely used by corporate treasurers and fund managers as well as by financial institutions.
VaR is a one-tailed confidence interval. If the 5-day 95% VaR of a portfolio is $1,000, then we expect the
portfolio will lose $1,000 or less in 95% of the scenarios and lose more than $1,000 in 5% of the scenarios
in 5 days. For example, we are interested in making a statement of the following form when using the VaR:
“We are 95 percent certain that we will not lose more than $1,000 in 5 days.”
It is a function of two parameters: the time horizon (e.g. 5-day in the example above) and the confidence
level (e.g. 95% in the example above). We can define VaR for any confidence level, but 95% has become an
extremely popular choice at many financial firms. The time horizon also needs to be specified for VaR. On
trading desks with liquid portfolios, it is common to measure the one-day 95% VaR.
The following figure provides a graphical representation of VaR at the 95% confidence level. The figure
shows the probability density function for the returns of a portfolio. Because VaR is measured at the 95%
confidence level, 5% of the distribution is to the left of the VaR level, and 95% is to the right.
Page 2 of 9
This material is only for the use of students enrolled in FIN 740 for purposes associated with the course and may not be
retained or further disseminated. All information in this material is proprietary to Dr. Sung Ik Kim. Scanning, copying,
posting to a website or reproducing and sharing in any form is strictly prohibited.
We now formally define VaR. Let L be a random variable, which represents the loss to our portfolio. L is
simply the opposite of the return to our portfolio. For example, if the return of our portfolio is -$1,000, the
loss, L, is +$1,000. For given confidence level α, VaR is defined as
P(L ≥ VaR𝛼) = 1 − 𝛼
We can also define VaR directly in terms of returns. If we multiply both sides of the inequality above by -1,
and replace .
The document provides guidance on investment analysis and project selection. It discusses measuring risk and return, using hurdle rates that account for risk, and choosing projects that provide returns above the hurdle rate. The capital asset pricing model is introduced as a method to estimate expected returns based on beta and the risk premium. Diversification and the market portfolio concept are also covered.
Wealth Management and risk adjusted calculations .pptxAyushSharma155581
The document discusses risk-adjusted return, which refines an investment's return by measuring the amount of risk involved in producing that return. Risk-adjusted returns are expressed as numbers or ratings and can be applied to individual securities, funds, and portfolios to compare high-risk/high-return investments to low-risk/lower-return investments. Risk-adjusted return is a better indicator of future performance than historical average return alone and can reveal whether returns were due to smart investment decisions or excess risk. There are several methods of calculating risk-adjusted return including the Sharpe ratio, Treynor ratio, and Jensen's measure.
This document defines risk and uncertainty and discusses various types of risks. It begins by defining risk as outcomes that can be assigned probabilities based on historical data, while uncertainty refers to outcomes that are too uncertain to assign probabilities. It then discusses different types of risks like market risk, credit risk, liquidity risk, and operational risk. It also discusses approaches to evaluate risk like using a risk-adjusted discount rate, certainty equivalent, and decision trees.
CT7Critical Thinking 7 AssignmentNAMEMantrako CrockettGRADE74QuestionsPoints PossiblePoints AttainedINSTRUCTOR COMMENTSSalvatore 14: Discussion Question 12What is the rationale behind the minimax regret rule? What are some less formal and precise methods of dealing with uncertainty? When are these useful?108what is regret? What is maximum regret?ANSWER:The rationale behind the minimax regret rule is to minimize the maximum regret or opportunity cost of making the wrong decisions. Some of the more informal methods for dealing with uncertainty are the acquisition of more information, which its reduces uncertainty when dealing with a particular strategy or event and issues arise from it. Acquiring more information can be costly, but in in the long-term it could potential be a good investment. Referral to authority is gaining the opinion of a professional service, which offers expert informative information to help reduce uncertainty. Although it is good to have more information it is hard to utilize referral to authority for long-term investments. Controlling the business environment is another way to deal with uncertainty, but it can be limited in the long run. Diversification is another method to deal with uncertainty, which allows companies to have more than one resource to rely on financial, especially when another product is not profitable. Diversification allows for financial flexibility among multiple things, vice financial reliance on one thing. The less formal methods are useful by business professionals or manager who understand the informal methods, and require alternate means to deal with uncertainty. Salvatore 14: Discussion Question 15How does the adverse selection problem arise in the credit- card market? How do credit- card companies reduce the adverse selection problem that they face? To what complaint does this give rise?54higher rates don't reduce risk, but cover the costs of higher default rates. However they drive away good risks…cc companies can reduce the problem by credit checks, etc.ANSWER:Adverse selection problem arrise by asymmetric information before the transaction between the buyer and seller. In the credit card market, it occurs when potential borrowers are liabilites because of certain issues (bad credit/high risk) are the ones who most actively seek out a loan. To reduce the adverse selection problem, credit card can raise interest rates to help reduce and mitigate the risk of defaulting on loans. However,higher interest rates will weakenthe economySalvatore 14: Spreadsheet Problem 1An individual has to choose between investment A and investment B. The individual estimates that the income and probability of the income from each investment are as given in the following table:
Investment A Investment B
Income Probability Income Probability
4000 0.2 4000 0.3
5000 0.3 6000 0.4
6000 0.3 8000 0.3
7000 0.2
.
Measuring Risk Exposure through Risk Range CertaintyAcumen
A white paper on how to overcome the challenges of project risk exposure reporting. Introducing a new, more meaningful risk metric, Risk Range Certainty (RRC).
The document discusses liquidity risk and risk matching in property and casualty (P&C) insurance. It notes that P&C insurance cash flows are highly volatile due to large claims, catastrophes, and adverse run-off. This creates liquidity risk from volatility rather than a mismatch in duration. The document also provides an example of how an insurer can assess and manage liquidity risk through reinsurance arrangements and investment strategies. Finally, it discusses how risk matching models can measure the diversification between underwriting and market risks to determine an optimal risk strategy and allocation of capital.
Risk analysis is the process of defining and analyzing potential threats and losses from natural or human-caused events. There are several statistical and conventional techniques used for risk analysis, including probability, variance, coefficient of variation, payback period, risk-adjusted discount rate, and certainty equivalent. Probability estimates the likelihood of an event occurring based on observations. Variance and standard deviation measure how returns deviate from expected losses. The coefficient of variation is a relative risk measure that accounts for standard deviation and expected value. [END SUMMARY]
The document discusses several assumptions of portfolio theory models including CAPM and APT. It assumes investors have homogeneous expectations, are risk averse utility maximizers, and operate in a environment of perfect competition with no transaction costs. The key aspects of CAPM discussed are the efficient frontier and relationship between risk and return. APT relaxes some CAPM assumptions and focuses on factor sensitivities driving returns rather than just beta. Arbitrage pricing looks for riskless profit opportunities by making small adjustments to portfolio weights.
This document proposes a Risk Adjusted Margin of Safety (RAMS) approach to quantifying the appropriate discount (margin of safety) to apply when valuing common stocks. RAMS is calculated using five risk factors: 1) market risk, 2) leverage risk, 3) accounting quality risk, 4) cash flow risk, and 5) growth sensitivity. Each risk factor is weighted equally and the sum is used to determine the RAMS discount from intrinsic value to calculate the purchase price. The RAMS approach aims to provide a quantitative and customized margin of safety for each stock based on its unique risk profile. An example application to a company is provided to illustrate how RAMS can inform buy/sell decisions.
The document discusses risk aversion and expected utility theory as an approach to decision making under risk or uncertainty. It defines key concepts like risk attitude, certainty equivalent, and utility functions. Specifically, it introduces the exponential utility function as a commonly used function for modeling risk aversion. It also provides a process for assessing a decision maker's risk tolerance parameter R, which influences their risk attitude as modeled by the utility function. Finally, it provides an example application to a decision facing a company called Xanadu Traders.
The document discusses various types of risks faced by financial institutions including market risk, liquidity risk, credit risk, and operational risk. It provides an overview of how to manage these risks through a generic risk management approach of identifying, prioritizing, classifying, quantifying, and mitigating risks. Dynamic hedging is discussed as a technique to manage risks from guarantees on investment products through regular adjustments of hedge positions.
Similar to Properties of an ideal risk measure (20)
In this presentation we look at Hedge Funds from a theoretical and empirical viewpoint and confirm their risk reducing characteristics in the South African context.
KnowRisk analysis of KiwiSaver Funds ( June 2015 )Peter Urbani
This presentation provides a brief overview and analysis of the range and dispersion of KiwiSaver Fund risks and returns for the 5 years to end June 2015.
Herewith an update of some research of mine on the relative performance of Emerging or Early Stage Hedge funds versus that of their older typically larger brethren. Given the recent announcement by CalPERS that they are withdrawing from hedge funds I thought it might be germane to show that notwithstanding CalPERS exit there remain some signs of life for hedge funds yet.
Why distributions matter ( 20 dec 2013 )Peter Urbani
Presentation on deficiencies of the Cornish Fisher modification to the Normal distribution and also on some Best Fit distributions including Gumbel, Johnson Family, Mixture of Normals, Skew-T, 3-Parameter Lognormal etc. Also includes bi-variate Best Fit Copula correlation with applications to Pairs Trading.
Alternative Intelligence Quotient - SFA Score articlePeter Urbani
The document compares the performance of portfolios built using different risk-adjusted performance measures (RAPMs) as objective functions, including the Sharpe Ratio, Sortino Ratio, Omega Ratio, and a new measure called the Single Fund Analysis (SFA) score. A study found that a portfolio built using the SFA score as its objective generated the highest annualized returns (15%) and best risk-adjusted return ratio, outperforming portfolios based on the other RAPMs. The superior performance of the SFA score portfolio is attributed to the SFA score being a relative and conditional measure calibrated to a reference dataset, improving its predictive power over different market conditions.
The Infiniti Analytics Suite (IAS) can be used to build long-only portfolios that perform up to two times better than traditional mean variance efficient portfolios, with greater upside potential and higher expected horizon wealth. Results were achieved using actual iShares ETFs based on their underlying benchmark index performance, overcoming short time series issues for some newer ETFs.
Four moment risk decomposition presentationPeter Urbani
The document discusses a method called the Cornish Fisher modification that can be used to more accurately calculate Value at Risk (VaR) for hedge fund portfolios by taking into account higher moments like skewness and excess kurtosis beyond the standard normal distribution. It provides an example showing how the modified VaR calculation can result in different values than the normal VaR calculation depending on the skewness and kurtosis of the portfolio. The document also describes how to decompose the sources of risk in a portfolio based on the normal and modified VaR and conditional VaR calculations.
Quantitative methods in Hedge Fund of Fund ( HFOF ) construction ( Dec 2009 )Peter Urbani
The document discusses weaknesses in quantitative models used to analyze hedge funds. It notes that existing models do not adequately account for asymmetric returns, autocorrelation, liquidity issues, and non-linear dependence among hedge funds. It also discusses how the Infiniti Capital Analytics Suite addresses some of these weaknesses through techniques like modified correlation analysis and Cornish-Fisher adjustments to better capture the unique risks of hedge funds.
Do emerging managers add value ( Dec 2008 )Peter Urbani
Emerging hedge fund managers, defined as those with less than 36 months of experience and less than $300 million in assets under management, tend to outperform more established managers and generate excess returns of up to 400 basis points annually. Investing in emerging managers funds can capture this excess alpha. Emerging managers have better risk and return characteristics than established managers, with compound average excess returns of 1.24% annually over 18 years.
A systematic fund of managed accounts ( Jun 2011 )Peter Urbani
The document discusses a proposed systematic fund of managed accounts that aims to meet increasing demands from investors for greater liquidity, transparency, and reasonable returns. The fund would utilize a proprietary scoring methodology called SFA to rank and select a diverse range of managed accounts on a monthly basis based on risk-adjusted performance, downside protection, and return persistence. Back-testing of the systematic selection process shows the potential to achieve a reasonable risk-adjusted return while offering weekly liquidity and daily transparency into holdings.
The document discusses emerging markets and why they are important drivers of global economic growth going forward. It notes that emerging market economies are expected to grow faster than developed markets in the coming decade, based on IMF forecasts. Emerging markets do not share the debt problems faced by developed markets. While emerging markets may see short-term weakness as the US dollar continues to rally in 2010, the longer-term outlook remains positive for emerging markets to continue growing faster than developed markets.
Discovering Delhi - India's Cultural Capital.pptxcosmo-soil
Delhi, the heartbeat of India, offers a rich blend of history, culture, and modernity. From iconic landmarks like the Red Fort to bustling commercial hubs and vibrant culinary scenes, Delhi's real estate landscape is dynamic and diverse. Discover the essence of India's capital, where tradition meets innovation.
South Dakota State University degree offer diploma Transcriptynfqplhm
办理美国SDSU毕业证书制作南达科他州立大学假文凭定制Q微168899991做SDSU留信网教留服认证海牙认证改SDSU成绩单GPA做SDSU假学位证假文凭高仿毕业证GRE代考如何申请南达科他州立大学South Dakota State University degree offer diploma Transcript
What Lessons Can New Investors Learn from Newman Leech’s Success?Newman Leech
Newman Leech's success in the real estate industry is based on key lessons and principles, offering practical advice for new investors and serving as a blueprint for building a successful career.
Every business, big or small, deals with outgoing payments. Whether it’s to suppliers for inventory, to employees for salaries, or to vendors for services rendered, keeping track of these expenses is crucial. This is where payment vouchers come in – the unsung heroes of the accounting world.
KYC Compliance: A Cornerstone of Global Crypto Regulatory FrameworksAny kyc Account
This presentation explores the pivotal role of KYC compliance in shaping and enforcing global regulations within the dynamic landscape of cryptocurrencies. Dive into the intricate connection between KYC practices and the evolving legal frameworks governing the crypto industry.
“Amidst Tempered Optimism” Main economic trends in May 2024 based on the results of the New Monthly Enterprises Survey, #NRES
On 12 June 2024 the Institute for Economic Research and Policy Consulting (IER) held an online event “Economic Trends from a Business Perspective (May 2024)”.
During the event, the results of the 25-th monthly survey of business executives “Ukrainian Business during the war”, which was conducted in May 2024, were presented.
The field stage of the 25-th wave lasted from May 20 to May 31, 2024. In May, 532 companies were surveyed.
The enterprise managers compared the work results in May 2024 with April, assessed the indicators at the time of the survey (May 2024), and gave forecasts for the next two, three, or six months, depending on the question. In certain issues (where indicated), the work results were compared with the pre-war period (before February 24, 2022).
✅ More survey results in the presentation.
✅ Video presentation: https://youtu.be/4ZvsSKd1MzE
In World Expo 2010 Shanghai – the most visited Expo in the World History
https://www.britannica.com/event/Expo-Shanghai-2010
China’s official organizer of the Expo, CCPIT (China Council for the Promotion of International Trade https://en.ccpit.org/) has chosen Dr. Alyce Su as the Cover Person with Cover Story, in the Expo’s official magazine distributed throughout the Expo, showcasing China’s New Generation of Leaders to the World.
Confirmation of Payee (CoP) is a vital security measure adopted by financial institutions and payment service providers. Its core purpose is to confirm that the recipient’s name matches the information provided by the sender during a banking transaction, ensuring that funds are transferred to the correct payment account.
Confirmation of Payee was built to tackle the increasing numbers of APP Fraud and in the landscape of UK banking, the spectre of APP fraud looms large. In 2022, over £1.2 billion was stolen by fraudsters through authorised and unauthorised fraud, equivalent to more than £2,300 every minute. This statistic emphasises the urgent need for robust security measures like CoP. While over £1.2 billion was stolen through fraud in 2022, there was an eight per cent reduction compared to 2021 which highlights the positive outcomes obtained from the implementation of Confirmation of Payee. The number of fraud cases across the UK also decreased by four per cent to nearly three million cases during the same period; latest statistics from UK Finance.
In essence, Confirmation of Payee plays a pivotal role in digital banking, guaranteeing the flawless execution of banking transactions. It stands as a guardian against fraud and misallocation, demonstrating the commitment of financial institutions to safeguard their clients’ assets. The next time you engage in a banking transaction, remember the invaluable role of CoP in ensuring the security of your financial interests.
For more details, you can visit https://technoxander.com.
Falcon stands out as a top-tier P2P Invoice Discounting platform in India, bridging esteemed blue-chip companies and eager investors. Our goal is to transform the investment landscape in India by establishing a comprehensive destination for borrowers and investors with diverse profiles and needs, all while minimizing risk. What sets Falcon apart is the elimination of intermediaries such as commercial banks and depository institutions, allowing investors to enjoy higher yields.
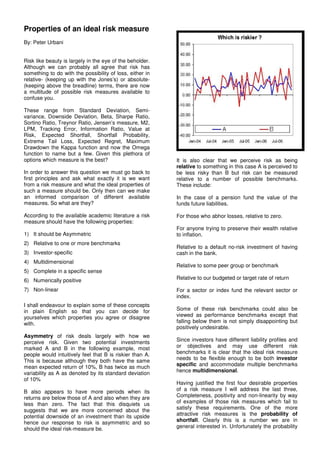
1. Properties of an ideal risk measure
By: Peter Urbani
Risk like beauty is largely in the eye of the beholder.
Although we can probably all agree that risk has
something to do with the possibility of loss, either in
relative- (keeping up with the Jones’s) or absolute-
(keeping above the breadline) terms, there are now
a multitude of possible risk measures available to
confuse you.
These range from Standard Deviation, Semi-
variance, Downside Deviation, Beta, Sharpe Ratio,
Sortino Ratio, Treynor Ratio, Jensen’s measure, M2,
LPM, Tracking Error, Information Ratio, Value at
Risk, Expected Shortfall, Shortfall Probability,
Extreme Tail Loss, Expected Regret, Maximum
Drawdown the Kappa function and now the Omega
function to name but a few. Given this plethora of
options which measure is the best? It is also clear that we perceive risk as being
relative to something in this case A is perceived to
In order to answer this question we must go back to be less risky than B but risk can be measured
first principles and ask what exactly it is we want relative to a number of possible benchmarks.
from a risk measure and what the ideal properties of These include:
such a measure should be. Only then can we make
an informed comparison of different available In the case of a pension fund the value of the
measures. So what are they? funds future liabilities.
According to the available academic literature a risk For those who abhor losses, relative to zero.
measure should have the following properties:
For anyone trying to preserve their wealth relative
1) It should be Asymmetric to inflation.
2) Relative to one or more benchmarks
Relative to a default no-risk investment of having
3) Investor-specific cash in the bank.
4) Multidimensional
Relative to some peer group or benchmark
5) Complete in a specific sense
6) Numerically positive Relative to our budgeted or target rate of return
7) Non-linear For a sector or index fund the relevant sector or
index.
I shall endeavour to explain some of these concepts
in plain English so that you can decide for Some of these risk benchmarks could also be
yourselves which properties you agree or disagree viewed as performance benchmarks except that
with. falling below them is not simply disappointing but
positively undesirable.
Asymmetry of risk deals largely with how we
perceive risk. Given two potential investments Since investors have different liability profiles and
marked A and B in the following example, most or objectives and may use different risk
people would intuitively feel that B is riskier than A. benchmarks it is clear that the ideal risk measure
This is because although they both have the same needs to be flexible enough to be both investor
mean expected return of 10%, B has twice as much specific and accommodate multiple benchmarks
variability as A as denoted by its standard deviation hence multidimensional.
of 10%
Having justified the first four desirable properties
B also appears to have more periods when its of a risk measure I will address the last three,
returns are below those of A and also when they are Completeness, positivity and non-linearity by way
less than zero. The fact that this disquiets us of examples of those risk measures which fail to
suggests that we are more concerned about the satisfy these requirements. One of the more
potential downside of an investment than its upside attractive risk measures is the probability of
hence our response to risk is asymmetric and so shortfall. Clearly this is a number we are in
should the ideal risk-measure be. general interested in. Unfortunately the probability
2. of shortfall measure is not ideal because it is not One of the most widely used measures of risk,
complete. Standard Deviation or Volatility is not really a
measure of risk at all but rather a measure of
If we consider the case of an investor, who is uncertainty. It is also particularly poorly suited for
concerned about losing capital relative to an use as the ideal risk measure for the following
important benchmark and is confronted with two reasons.
hypothetical investment possibilities, E and F. Both
have an expected return of zero relative to the If we consider investments A, C, and D in which both
benchmark and both have a probability of shortfall of C and D have the same standard deviation as one
50%, but are they equally risky? another (10%) whilst A has a standard deviation of
5%. Using standard deviation as your sole measure
If an investors only measure or risk is the shortfall of risk you would be indifferent between C and D.
probability then he/she will be indifferent between E But this is clearly wrong since D has an average
and F. However we can see that F has a greater expected return of -10% versus C’s +10%. Many
potential downside and that everywhere in the people object to standard deviation as a risk
shaded area also a greater probability of realising measure because it gives equal weight to deviations
that downside than E. Thus the shortfall probability above the mean and deviations below the mean,
measure, although interesting, does not address the whereas investors are likely to be more worried
issue of how severe an event may be. It is thus about “downside deviation” than “upside deviation.”
insufficient and incomplete.
Similarly if we now use maximum shortfall as the
only measure of risk using example F and G we can
see although both have the same probability of
shortfall of 50% and the same maximum shortfall of
-30% it is not clear which is riskier because the
maximum shortfall measure alone says nothing
about the size of the typical shortfall. Two
investments may have the same worst outcome but
one may have many large losses and the other only
a few. Information about the end point of the lower
tail of a distribution says little about the distribution
overall. Moreover, we typically have only a few data
points with which to work in the tail making the
maximum shortfall measure both numerically-ill-
conditioned and incomplete as a risk measure.
Another problem with using standard deviation as a
risk measure is that it is not sensitive to order. In the
below examples you can see that A and C have the
same standard deviation and mean.
3. However C is clearly riskier than A, having lost 38% bad as losing half of your money. I don’t think so,”
of its value from its peak to trough during the he says. “It’s at least 10 times as bad.”
hypothetical period shown. Markets that look, or feel, Why VaR is not a coherent measure of risk
volatile often feel that way because of a distinct
order of prices or returns: an order that involves
choppy movements with frequent reversals. This
1) Subadditivity
kind of “order dependent volatility” is not captured by For all random losses X and Y
the technical definition of standard deviation, since p(X)+p(Y) > p(X+Y)
standard deviation is not sensitive to order. This
point has direct application to hedge fund investing, Scenario p(X) p(Y) p(X+Y)
since many hedge fund managers employ trading
strategies whose success or failure will be related
1 0 0 0
not to the volatility of markets but to the path that 2 0 0 0
markets follow 3 0 0 0
4 0 0 0
5 0 0 0
Value at Risk has garnered widespread acceptance
6 0 0 0
in recent years as the new measure of risk. Despite
this widespread use it is also not complete in that it 7 0 0 0
is not mathematically coherent. In order to be 8 0 0 0
mathematically coherent a risk measure must satisfy 9 100 0 100
the conditions of: 10 0 100 100
1.) Subadditivity
2.) Monotonicity VaR @ 85% 0 0 100
3.) Positive Homogeneity and; 0 + 0 is not > 100
4.) Translation invariance.
2) Monotonicity
Without going into detail on these, suffice it to say If X < Y for each scenario then
that Value at Risk fails to satisfy both the
Subadditivity and Monotonicity conditions. This has p(X) < p(Y)
two consequences. The first is that the sum of the
parts may be less than that of the whole and Scenario X Y
secondly that the graphing of value at risk as a 1 1.00 5
function of returns, as in the mean / value at risk 2 2.00 5
frontier, may not result in a neat convex function.
This makes finding the optimal point difficult using 3 3.00 5
conventional methods. 4 4.00 5
5 5.00 5
Fortunately there is one measure of risk, closely 6 5.00 5
related to value at risk that is both mathematically 7 4.00 5
coherent and complete. That is the Expected
Shortfall measure aka. the conditional Value at Risk 8 3.00 5
or Extreme Tail Loss. 9 2.00 5
10 1.00 5
What the Expected Shortfall measure provides is a E( r ) 3.00 5.00
probability weighted average of the expected losses SD 1.41 0.00
in excess of the value at risk. Hence it is the average
of the tail losses conditional on the value at risk
VaR 5.83 5.00
being exceeded. As a risk measure, Expected E( r ) + 2 x SD 5.83 is not < 5
shortfall captures the whole of the downside portion
of the relative probability density function and is
complete. However, its one remaining failing is that 3) Positive Homegeniety
it, like value at risk, is a linear measure of risk.
The non-linearity of risk is closely related to investor For all L > 0 and random losses X
psychology and utility. More people insure their p(L X) = L p(X)
homes than their pets despite the fact that the
possibility of losing a pet is significantly higher than 4) Translation Invariance
losing a home. This reflects the non-linearity of how
we perceive risk. We perceive a low probability of
experiencing a large loss as being far worse than a For all random losses X and constant a
high probability of experiencing a small loss. Frank p(X+a ) = p(X)+a
Sortino says “VaR. It’s simply a linear measure of
risk. It says that losing all your money is twice as
4. Sortino strongly holds the view that it is downside References:
risk that is most important. According to this view,
the most relevant returns are returns below the A unified approach to upside and downside returns
mean, or below zero, or below some other “target” or
– Leslie A Balzar (2001)
“benchmark” return.
This has lead to a proliferation of measures of Expected Shortfall, a natural coherent alternative
“downside risk”: semi-variance, shortfall probability, to Value at Risk - Acerbi and Tasche (2001)
the Sortino ratio, etc. Ignoring the specific
advantages and disadvantages of each individual Coherent measures of risk - Artzner and Delbaen
candidate to represent “the true nature of risk,” we
(1999)
would offer two general observations:
Frequency vs. Amplitude. The idea of risk as
“expected pain” combines two elements: the Peter Urbani, is Head of KnowRisk Consulting. He
likelihood of pain, and the level of pain. The was previously Head of Investment Strategy for
measures described above (with the exception of Fairheads Asset Managers and prior to that Senior
Expected shortfall) focus on one or the other of Portfolio Manager for Commercial Union
these elements, but not both. Semi-variance (and its Investment Management.
descendant, the Sortino ratio) focuses on the size of
the negative surprises, but ignores the probability of He can be reached on (073) 234 -3274
those surprises. Shortfall probability focuses on the
likelihood of falling below a target return, but ignores
the potential size of the shortfall. If I were forced to
pick a single quantitative measure of risk, it would
offer the concept of “expected return below the
target,” defined as the sum of the probability-
weighted below-target returns. This measure is
essentially the area under the probability curve that
lies to the left of the target return level. (Note that
this definition is broad enough to cover both normal
and non-normal distributions.)
Other generalisations of this such as the LPMn
measure and the Omega function which captures
the full distribution are also available.
The final criteria is given as numerical positivity
although this is more a desirable than essential
requirement. Personally I prefer to show loss
percentages such as value at risk in negative terms
since this is more intuitive, but it is more common to
show them +ve because of the widespread use of
quadratic penalties in scientific optimisation.
Past performance does not guarantee anything
regarding future performance, and past risk does not
guarantee anything regarding future risk. This is true
even when the historical record is long enough to
satisfy normal criteria of statistical significance. The
problem is that, just as a performance record is
getting long enough to have statistical significance, it
may no longer have investment significance.
because the people and the organization may have
changed. Investors should thus use the full toolbox
of available risk measures but not loose sight of the
wood for the trees.
5. Useful Calculations in Excel
A B Normal distribution (Prob. density)
0.45
1 Mean 13.13 13.13
2 Std Dev 17.87 0.40
3 CL 0.95 0.35
4 HPR 1 0.30
5 MAR 5.00 0.25
6 0.20
-16.26
7 Normal VaR -16.26
0.15
8 Expected Shortfall -23.73 -23.73
9 Downside Deviation 13.52 0.10
10 Below MAR Deviation 8.53 0.05
11 Shortfall probability 32.46% 0.00
12 Upside Potential 42.52 -60 -40 -20 0 20 40 60 80
13 Average Shortfall -3.79 Normal Probability density Mean is 13.13
14 Upside Potential Ratio 131 Selected probability 5.0% VaR @ 95.0% CL is -16.26
15 Regret 2.24 ETL @ 95.0% CL is -23.73 ABS @ 32.5% CL is 5.00
Normal VaR
=-(-B1*B4-(NORMSINV(1-B3))*B2*SQRT(B4))
Expected Shortfall
=-(-B1*B4+(NORMDIST(NORMSINV(1-
B3),0,1,FALSE)/NORMDIST(NORMSINV(1-B3),0,1,TRUE))*B2*SQRT(B4))
Downside Deviation
=SQRT((((NORMDIST(0,B1,B2,TRUE))*(B2^2+B1^2))-
((B2^2*NORMDIST(0,B1,B2,FALSE))*B1))/NORMDIST(0,B1,B2,TRUE))
Below MAR Deviation
=SQRT(((B5-B1)^2+B2^2)*NORMDIST(B5,B1,B2,TRUE)+(B5-
B1)*NORMDIST(B5,B1,B2,FALSE)*B2*B2)
Shortfall probability
=NORMDIST(B5,B1,B2,TRUE)
Upside Potential
=-(-B1*B4-(NORMSINV(B3))*B2*SQRT(B4))
Average Shortfall
=-((B5-B1)*NORMDIST(B5,B1,B2,TRUE)+NORMDIST(B5,B1,B2,FALSE)*B2*B2)
Upside Potential Ratio
=B12/B11
Regret
=((NORMDIST(B5,B1,B2,TRUE)*(B2^2+B1^2-2*B5*B1+B5^2))-
((NORMDIST(B5,B1,B2,FALSE)*B2^2)*(B1-B5)))/NORMDIST(B5,B2,B3,TRUE)/100