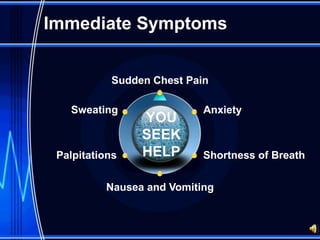
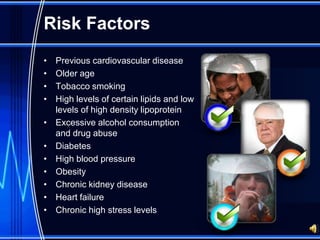
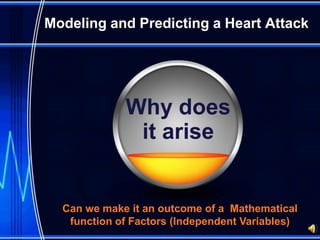
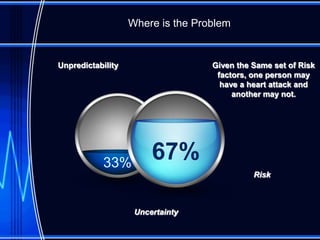
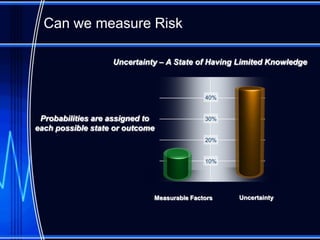
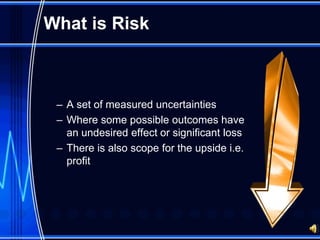
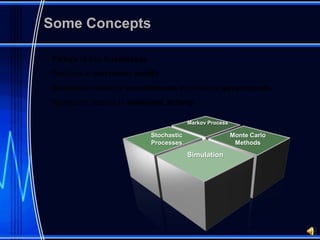
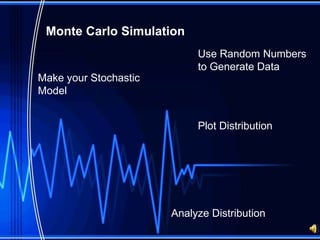
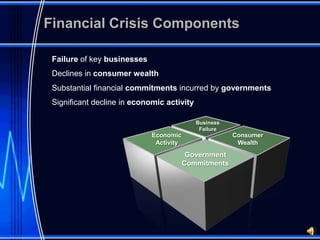
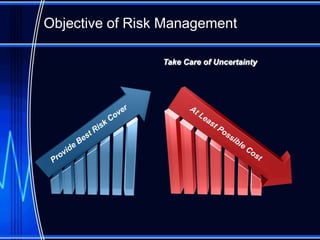
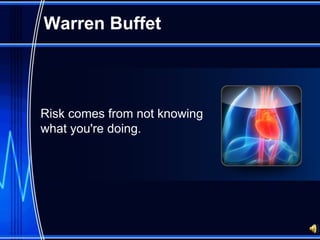
Introduction to Risk


              VIKRAM SINGH SANKHALA
What is Risk


CAN YOU
PREDICT A
HEART ATTACK
Immediate Symptoms


           Sudden Chest Pain

   Sweating                Anxiety
                YOU
                SEEK
 Palpitations   HELP       Shortness of Breath


          Nausea and Vomiting
Risk Factors
•   Previous cardiovascular disease
•   Older age
•   Tobacco smoking
•   High levels of certain lipids and low
    levels of high density lipoprotein
•   Excessive alcohol consumption
    and drug abuse
•   Diabetes
•   High blood pressure
•   Obesity
•   Chronic kidney disease
•   Heart failure
•   Chronic high stress levels
Modeling and Predicting a Heart Attack


             Why does
              it arise


  Can we make it an outcome of a Mathematical
   function of Factors (Independent Variables)
Where is the Problem


Unpredictability                   Given the Same set of Risk
                                    factors, one person may
                                     have a heart attack and
                                        another may not.


            33%
                        67%
                                             Risk


                    Uncertainty
Can we measure Risk

                   Uncertainty – A State of Having Limited Knowledge


                                            40%


 Probabilities are assigned to              30%
each possible state or outcome
                                            20%


                                            10%


                             Measurable Factors   Uncertainty
What is Risk


 – A set of measured uncertainties
 – Where some possible outcomes have
   an undesired effect or significant loss
 – There is also scope for the upside i.e.
   profit
What is Predictability


 Is it possible to predict the            Dependent Variable
state of the system S (t+k) at
           time= t+k
                                 Independent Variable x   1%


                            Independent Variable y    4%


                       Independent variable z
                                                15%
                 Independent Variable a
                                           80%
              Consider a system
              whose state at the
            initial state S(t) at time
                         t.
Financial Risk
Illustration


Can we predict the movement of Stock Markets
What is Randomness

Random Process
1. A random process is a repeating
process
2. whose outcomes follow no
describable deterministic pattern,
3. but follow a probability
distribution,
4. Such that the relative probability
of the occurrence of each outcome
can be approximated or calculated.
When do we call events random

                               Statistical Properties


- Is there a Correlation

- Are the Events Independent
How do we study Randomness

              Probability theory is the branch of mathematics concerned
                          with analysis of random phenomena


   RAIN                  MAYBE                       NO RAIN


2% Decrease

                      3% Increase


                 Statistics is used to infer the underlying probability
                distribution of a collection of empirical observations.
Random Walk Hypothesis - No


What is a Random Walk ?

     A random walk, sometimes denoted RW, is a
     mathematical formalization of a trajectory that
     consists of taking successive random steps.


 What does the Random Walk Hypothesis say ?

 The random walk hypothesis is a financial theory stating
 that stock market prices evolve according to a random
 walk and thus the prices


                         Random │ Walk │ Hypothesis
Against the Hypothesis - Yes


    Professors Andrew W. Lo and Archie Craig MacKinlay


                           Professors of Finance at the MIT Sloan School of
                           Management and the University of Pennsylvania


Volatility Besed Equation

•   Xt is the price of the stock at time t
•   μ is an arbitrary drift parameter
•   εt is a random disturbance term


                               Random │ Walk │ Hypothesis
Some Concepts

Failure of key businesses
Declines in consumer wealth
Substantial financial commitments incurred by governments
Significant decline in economic activity

                                         Markov Process

                            Stochastic                    Monte Carlo
                            Processes                      Methods
                                         Simulation
Stochastic Process

         Counterpart to a deterministic process


                                           Stock Markets
Even if the initial condition is
known, there are many possibilities
the process might go to, but some         Exchange Rate
paths are more probable and others         Fluctuations
less.
                                             Brownian
                                              Motion
Markov Process


Mathematical model for the random evolution of a
Memory-less system


       Process for which the likelihood of a given
      future state, at any given moment, depends
      only on its present state, and not on any
      past states


                  Andrei Markov │ Russian Mathematician │
Simulation

A model in science is a physical, mathematical, or logical
representation of a complex reality.


  A simulation brings a model to life and shows how a particular object
  or phenomenon will behave.
Some Methods of Simulation


      Historical                    Use of
                   Parametric
     Information                   Random
                   Distribution
                                   Numbers


     PAST DATA     ASSUMPTION     GENERATION


     Historical    Parametric     Monte Carlo
     Simulation    Simulation     Simulation
Monte Carlo Simulation
                            Use Random Numbers
                            to Generate Data
Make your Stochastic
Model


                            Plot Distribution


                       Analyze Distribution
Financial Crisis Components

 Failure of key businesses
 Declines in consumer wealth
 Substantial financial commitments incurred by governments
 Significant decline in economic activity

                                            Business
                                             Failure
                             Economic                  Consumer
                              Activity                  Wealth
                                          Government
                                         Commitments
US Mortgage Crisis

 Between 1997 and 2006, the price
 of the typical American house
 increased by 124%


        124%
        INCREASE


                                               Housing Prices:
                                          •peaked in early 2005
                                     •started to decline in 2006
                                    •Led to US Mortgage Crisis
Objective of Risk Management

                 Take Care of Uncertainty
Result


           BETTER PLANNING


             LESS LOSSES


         SECURE FUTURE
Warren Buffet


Risk comes from not knowing
what you're doing.

An Introduction to Risk - by Vikram Sankhala

  • 1.
    Introduction to Risk VIKRAM SINGH SANKHALA
  • 2.
    What is Risk CANYOU PREDICT A HEART ATTACK
  • 3.
    Immediate Symptoms Sudden Chest Pain Sweating Anxiety YOU SEEK Palpitations HELP Shortness of Breath Nausea and Vomiting
  • 4.
    Risk Factors • Previous cardiovascular disease • Older age • Tobacco smoking • High levels of certain lipids and low levels of high density lipoprotein • Excessive alcohol consumption and drug abuse • Diabetes • High blood pressure • Obesity • Chronic kidney disease • Heart failure • Chronic high stress levels
  • 5.
    Modeling and Predictinga Heart Attack Why does it arise Can we make it an outcome of a Mathematical function of Factors (Independent Variables)
  • 6.
    Where is theProblem Unpredictability Given the Same set of Risk factors, one person may have a heart attack and another may not. 33% 67% Risk Uncertainty
  • 7.
    Can we measureRisk Uncertainty – A State of Having Limited Knowledge 40% Probabilities are assigned to 30% each possible state or outcome 20% 10% Measurable Factors Uncertainty
  • 8.
    What is Risk – A set of measured uncertainties – Where some possible outcomes have an undesired effect or significant loss – There is also scope for the upside i.e. profit
  • 9.
    What is Predictability Is it possible to predict the Dependent Variable state of the system S (t+k) at time= t+k Independent Variable x 1% Independent Variable y 4% Independent variable z 15% Independent Variable a 80% Consider a system whose state at the initial state S(t) at time t.
  • 10.
  • 11.
    Illustration Can we predictthe movement of Stock Markets
  • 12.
    What is Randomness RandomProcess 1. A random process is a repeating process 2. whose outcomes follow no describable deterministic pattern, 3. but follow a probability distribution, 4. Such that the relative probability of the occurrence of each outcome can be approximated or calculated.
  • 13.
    When do wecall events random Statistical Properties - Is there a Correlation - Are the Events Independent
  • 14.
    How do westudy Randomness Probability theory is the branch of mathematics concerned with analysis of random phenomena RAIN MAYBE NO RAIN 2% Decrease 3% Increase Statistics is used to infer the underlying probability distribution of a collection of empirical observations.
  • 15.
    Random Walk Hypothesis- No What is a Random Walk ? A random walk, sometimes denoted RW, is a mathematical formalization of a trajectory that consists of taking successive random steps. What does the Random Walk Hypothesis say ? The random walk hypothesis is a financial theory stating that stock market prices evolve according to a random walk and thus the prices Random │ Walk │ Hypothesis
  • 16.
    Against the Hypothesis- Yes Professors Andrew W. Lo and Archie Craig MacKinlay Professors of Finance at the MIT Sloan School of Management and the University of Pennsylvania Volatility Besed Equation • Xt is the price of the stock at time t • μ is an arbitrary drift parameter • εt is a random disturbance term Random │ Walk │ Hypothesis
  • 17.
    Some Concepts Failure ofkey businesses Declines in consumer wealth Substantial financial commitments incurred by governments Significant decline in economic activity Markov Process Stochastic Monte Carlo Processes Methods Simulation
  • 18.
    Stochastic Process Counterpart to a deterministic process Stock Markets Even if the initial condition is known, there are many possibilities the process might go to, but some Exchange Rate paths are more probable and others Fluctuations less. Brownian Motion
  • 19.
    Markov Process Mathematical modelfor the random evolution of a Memory-less system Process for which the likelihood of a given future state, at any given moment, depends only on its present state, and not on any past states Andrei Markov │ Russian Mathematician │
  • 20.
    Simulation A model inscience is a physical, mathematical, or logical representation of a complex reality. A simulation brings a model to life and shows how a particular object or phenomenon will behave.
  • 21.
    Some Methods ofSimulation Historical Use of Parametric Information Random Distribution Numbers PAST DATA ASSUMPTION GENERATION Historical Parametric Monte Carlo Simulation Simulation Simulation
  • 22.
    Monte Carlo Simulation Use Random Numbers to Generate Data Make your Stochastic Model Plot Distribution Analyze Distribution
  • 23.
    Financial Crisis Components Failure of key businesses Declines in consumer wealth Substantial financial commitments incurred by governments Significant decline in economic activity Business Failure Economic Consumer Activity Wealth Government Commitments
  • 24.
    US Mortgage Crisis Between 1997 and 2006, the price of the typical American house increased by 124% 124% INCREASE Housing Prices: •peaked in early 2005 •started to decline in 2006 •Led to US Mortgage Crisis
  • 25.
    Objective of RiskManagement Take Care of Uncertainty
  • 26.
    Result BETTER PLANNING LESS LOSSES SECURE FUTURE
  • 27.
    Warren Buffet Risk comesfrom not knowing what you're doing.

Editor's Notes

  • #2 http://en.wikipedia.org/wiki/Heart_attackThis sample presentation will illustrate the Power of PowerDESIGNS. We start off by selecting a background template from the PowerTEMPLATES collection.
  • #3 This PowerICON is used to add imagery and impact.
  • #4 Here, PowerGraphics are used in conjunction with PowerICONS to create an interactive graphic
  • #5 PowerICONS are used to emotionally connect with the audience make slides memorable.
  • #6 Many creative diagrams like this sphere are included in the PowerGRAPHICS library.
  • #9 3D Arrows from the PowerGRAPHICS library are used to create this exiting animation effect.
  • #11 http://en.wikipedia.org/wiki/Heart_attackThis sample presentation will illustrate the Power of PowerDESIGNS. We start off by selecting a background template from the PowerTEMPLATES collection.
  • #12 3d PowerGRAPHICS are an exciting way to illustrate key concepts and keep your audience entertained
  • #18 Combining PowerPoint autoshapes with 3d PowerGRAPHICS such a this box cluster creates an attractive animated graphic.
  • #22 These PowerGRAPHIC arrows are designed to be used in conjunction with PowerPoint text boxes to create customized graphics.
  • #23 http://en.wikipedia.org/wiki/Heart_attackThis sample presentation will illustrate the Power of PowerDESIGNS. We start off by selecting a background template from the PowerTEMPLATES collection.
  • #24 Combining PowerPoint autoshapes with 3d PowerGRAPHICS such a this box cluster creates an attractive animated graphic.
  • #25 A 3d us map from the PowerGRAPHICs library and a real estate PowerICON illustrate this slide’s key concept
  • #27 The PowerGRAPHICS library includes thousands of 3D graphics such as this safe and money bag.
  • #28 This PowerICON is used to add imagery and impact.