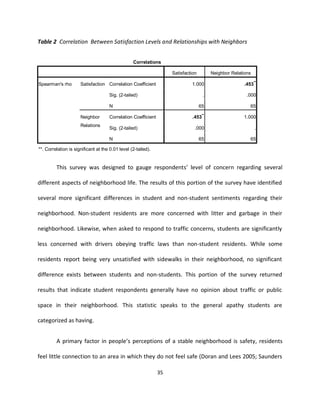
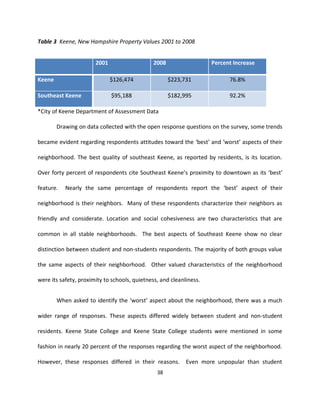
SlideShare a Scribd company logo
1 of 63
December
  2008


    New Kids on the Block:
           An Analysis of Student
             Housing Trends in
             Southeast Keene,
              New Hampshire


               JAMES CUNNIINGHAM
                AMES UNN NGHAM
               VANESSA CIIARLEGLIIO
                 ANESSA ARLEGL O
                LIINDSAY LAMBERT
                   NDSAY AMBERT
                HEATHER SOULARD
                  EATHER OULARD


                         Keene State College
                      Department of Geography
               Faculty Sponsor: Dr. Christopher Cusack
First, we would like to thank the entire Geography department; Dr. K. Alvarez, Dr. K Bayr,

Professor T. Miller, Dr. Jo Beth Mullens and Dr. Al Rydant who have helped shape our education

to this point. With a special thanks to Dr. Christopher Cusack who has spent countless hours

working with us on this project and many other projects preparing us for life after college. The

Department of Geography and its faculty represent an extraordinary element of Keene State

College which leaves a lasting impression on every student who passes through it. We would

like to thank Dan Curran and Dave Curran, for allowing us to attend meetings and giving us

insight on what was happening within the Southeast Keene neighborhood. We would like to

acknowledge and thank Will Schoefmann, of the Keene Planning Department, for supplying us

with the Keene parcel data from which we based most of our maps. Also, thank you to Medard

Kopczynski, Assistant City Manager/Health Director of Keene, New Hampshire, for providing the

group with the Code Enforcements for the City of Keene. Additional appreciation to Laura

Thibodeau, CNHA, City Assessor, for supplying assessed values for property parcels. Great

thanks to Dr. Andrew Robinson, Vice President of Student Affairs at Keene State College, for

taking the time to meet with us and providing information pertinent to the college’s growth

rate and student living. Thank you Cristi Carson, from the Office of Institutional Research at

Keene State College, for all of the factual information pertaining to the college and as well as

KSC college demographics retained from previous years from the Keene State College Fact

Books.   We greatly appreciate Sherry Huntley from KSC Registrars office for providing off-

campus student housing locations. Additional thanks to our Senior Seminar class, it has been a

pleasure meeting and working with all of you! To anyone we may have missed, your help with

making this project a success was not dismissed. Thank you.
                                               ii
TABLE OF CONTENTS

Acknowledgments                                        ii

List of Figures                                        v

List of Tables                                         vi

Abstract                                               1

Chapter 1

       Introduction                                    1

       Central Questions                               2

       Hypothesis                                      4

Chapter 2

       Neighborhood Contextualized                     6

       Neighborhood Change                             7

       College Towns                                   10

       Student Behavior                                11

       Physical Characteristics of Student Housing     14

Chapter 3

       Location of Keene, New Hampshire                15

       Keene State College Background                  17

       Southeast Keene Neighborhood Change             19

       Response to Change                              21


                                              iii
Chapter 4

      Methods                                 26

      Survey Methodology                      26

      Survey Results                          32

Chapter 5

      Housing Assessment Methodologies        40

      Results                                 44

Chapter 6

      Limitations                             46

      Conclusions                             47


                                         iv
LIST OF FIGURES

Figures

          1. Southeast Keene Neighborhood                                            3

          2. Stages of Neighborhood Change                                           8

          3. Demographic distribution shown in Percentages                           17

          4. Total Fall Headcount Student Enrollment , Years 2001-2007               18

          5. Survey Responses Pertaining to KSC’s Perceived Value to the Community   18

          6. Number of families per Household 2001 to 2008                           20

          7. Student Households in Southeast Keene Neighborhood                      21

          8. Building Code Violations                                                24

          9. Locations of Surveyed Residents                                         28

          10. Surveys Being Distributed                                              29

          11. Total Months of Residency for non-students and students                34

          12. Housing Assessment Properties                                          40

          13. Assessed Housing Externalities                                         41

          14. Assessed Parking Conditions                                            42

          15. Negative Items on Properties                                           42

          16. Student and Non-Student Housing                                        44


                                                      v
LIST OF TABLES

Tables

         1. Keene New Hampshire 5 Largest Businesses                                  16

         2. Correlation Between Satisfaction Levels and Relationship with Neighbors   35

         3. Keene, New Hampshire Property Values 2001 to 2008                         38


                                                  vi
Abstract

This study has illuminated a wealth of information regarding the social and physical implications
of Keene State College students living off campus in Keene, New Hampshire. Drawing on
secondary research; this study has provided context in order to understand the concepts of
‘town and gown’ relationships. Primary research has revealed several significant social and
physical differences between the two major demographics of study, students and non-student
residents. Students have been categorized as being generally unconcerned with the social fiber
or physical condition of their neighborhood. Students generally do not feel as connected to the
community as do local residents. Local residents tend to view student housing, and students in
general, as having negative connotations and detrimental effects on their neighborhood. Spatial
trends have been identified in student housing and displayed using Geographic Information
Systems. It is predictable that student housing is going to increase in Southeast Keene as well as
the entire city. If nothing is done to rectify this situation, the social fabric that makes up
Southeast Keene may continue to deteriorate. Southeast Keene may become like other student
dominated areas of the city and other cities where rental housing is predominant. This will
force stable residential neighborhoods further from downtown Keene which is one of the most
valued aspects of the neighborhood. Drawing on past studies of neighborhood decline and
successful neighborhood revitalization efforts; this study concludes with an outlook to the
future of Southeast Keene.


Chapter 1


Introduction


       Neighborhoods exist in every town and city and all neighborhoods experience change

over time. These changes are caused by a multitude of reasons and are manifested with many

different characteristics. Neighborhood lifecycles are generally thought of in two terms, decline

or revitalization. This is a case study of Keene, New Hampshire (NH) where a demographic shift

is taking place and changing the neighborhoods that are valued by local residents. The

demographic shift of focus is the increasing presence of 18-24 year old males and females. The


                                                1
increase in this age group can be attributed to the presence of Keene State College which is

home to 5,443 students; 40 percent of whom do not live on campus (2007 data). This remaining

40 percent of the student population either commutes from an outside town or city or lives

within the community. Students living off campus are having an effect on the areas in which

they live and an effect on the residents among whom they live. This study is a spatial analysis of

a specific neighborhood in Keene which is currently experiencing change attributed to the

effects of student housing. The neighborhood in question is referred to as Southeast Keene.

The term Southeast Keene should be thought of as a general area without definite borders. The

neighborhood can generally be demarcated by city streets. The northern edge of the

neighborhood is bounded by Water Street to the North; to the East by Grove and Marlboro

Street; to the South by State Route 101 and to the West by Main Street (Figure 1).


Central Questions


       First, this study provides a definition of the term neighborhood as it is contextualized in

this study and other studies. Any analysis of a neighborhood cannot be completed without a

functional definition of the term because it can have different meanings in different contexts.

Why are student households of concern? To answer this question, an analysis of common

concerns residents have with student housing is provided, along with an analysis of student

lifestyles and common features associated with student households and student occupied

communities.


                                                2
Figure 1 Southeast Keene Neighborhood
                                        3
This study intends to provide a spatial analysis of the trends in student housing patterns;

specifically, why are students living off campus and where in the neighborhood are they living?

This study will gauge attitudes of residents as to the impact students have on their

neighborhood and their lives. This study will attempt to identify what effects, if any, living in

close proximity to student households have on residents, of Southeast Keene.


Hypotheses


       A series of spatial and statistical trends are expected to become evident through this

study. Using survey results through primary data collection, it is probable that residents who

live in closest proximity to student households will have significantly lower satisfaction rates as

well as poorer reported relationships with their neighbors. It is expected that residents in close

proximity to student households will report contacting the police, about disturbances in their

neighborhood, more so than other residents. It is likely that residents who have lived in the

neighborhood for the longest periods of time will have likely seen the largest amount of change

within their neighborhood. A correlation can be expected between length of residency and

satisfaction levels, negative student impacts, and police contacts. Residents and students in the

neighborhood will rate different aspects of their neighborhood much differently when it comes

to issues such as, litter, traffic, safety, substance abuse, and property values. Residents will be

prone to having much stronger opinions about these matters. Using data collected with a

housing quality assessment; student properties will likely have more maintenance issues that

owner occupied housing units. Using City Planning data, it is expected that Southeast Keene’s

property values have increased less when compared to the city averages from the years 2001 to

                                                4
2008. Multifamily housing units are also likely to have significantly increased in the

neighborhood from 2001 to 2008.


                                          5
Chapter Two


Neighborhoods Contextualized


       Any analysis of a neighborhood must take into account the fact that neighborhoods

have ambiguous borders and are difficult to define. Neighborhoods are not demarcated by

street signs, they cannot be found on road maps, they are not solely government jurisdictions,

school districts, or voting districts. Neighborhoods may be defined differently by people who

live within the same city block. One such definition describes neighborhoods as clusters of

residents with similar spatially based attributes (Galster 2001). This is an accurate definition in

that neighborhoods are spatial groupings of people, but it implies that any residential grouping

of people can be considered a neighborhood, from the largest city to the smallest town. That

definition can be problematic because neighborhoods are subsections of larger communities

(Sampson et al. 2000). Neighborhoods are often informally recognized dividers that exist in

larger urban areas. Residents of these areas feel a stronger connection to the smaller area in

which they live than the city as a whole (Logan and Collver 1984).


       Neighborhoods, however, are not solely spatial groupings of people in close proximity to

one another. Defining neighborhoods in solely spatial terms disregards the social dynamic that

makes up the fabric neighborhoods. Neighborhoods should be thought of as an area that can

expand and shrink depending on contexts and personal experiences of those who live there

(Sastry et al. 2002). The amorphous nature of neighborhoods is displayed well in a study that

employs statistics to gauge peoples’ perceptions of their neighborhood. This study involved 612

residents of Nashville, Tennessee, who were surveyed as to the limits of their neighborhood as
                                                6
measured in city blocks. The average perceived size was 19.1 city blocks; the standard

deviation, however, was more than three times that magnitude at 71.1 city blocks (Lee 2001).

This displays the vast discrepancy in the range of peoples’ perceptions of scale pertaining to

neighborhoods. Neighborhoods exist in the attitudes and social connections of the residents in

the community. In other studies, neighborhoods have been categorized solely in demographic

terms. This means that people will more closely identify with neighbors and neighborhoods that

are composed of people who are racially, economically, and close in age, to themselves

(Banerjee and Baer 1984; Logan and Collver 1984; Lee and Campbell 1997). If people will form

bonds more easily with people of similar demographics then it is feasible that neighborhoods

can be perceived along demographic boundaries. This means that communities with similar

demographics will likely have a higher level of neighborhood cohesion and can more easily

distinguish the limits of their own neighborhood.


Neighborhood Change


       Neighborhoods have lifecycles much like living organisms. Unlike living organisms,

however, neighborhoods do not follow a set path of growth, decline and eventual death like

organisms. Neighborhoods can decline and revitalize many times with no death or end

occurring (Figure 2).


                                               7
Stable neighborhood; Long
term residency, strong
community ties, high home           Stable neighborhood;
ownership, high income.             Young families, high
...stable property values,          income, strong community
                                    ties, high ownership rates.
properties well
maintained.
   Minor Decline; Out
  migration, minor physical
                                     Strongly revitalized
  deterioration, small
                                     neighborhood; Increasing
  increase in rental
                                     home ownership rates, Low
  properties.
                                     crime rates, strong
                                     community ties.
Obvious decline; Increased
rental housing, physical
deterioration is evident and        Full revitalization efforts;
unattended to. Rising crime         Strong community
and vandalism.                      organization, strong public
                                    and private investment in
                                    properties and housing.
Heavily deteriorated;
Predominantly rental housing,
very low average income, most       Revitalizing neighborhood;
housing units require major         Properties are being
repairs, high crime rates.          renovated; public and private
                                    spaces are beginning
                                    revitalization.
Unhealthy neighborhood
Lowest socio-economic
residents, housing units           Early revitalization; Community
dilapidated, very high crime       groups are formed, government
rates, housing                     assistance available, police are
                                   active in response to slum-like
abandonment common,
                                   conditions.
High vacancy rates.

                               Figure 2 Stages of Neighborhood Change


                                     8
It has been hypothesized that friendships and local acquaintances increase social

cohesion and a person’s level of commitment to a neighborhood (Sampson 1991). When people

feel connected to their neighbors and neighborhood a very stable community develops. Stable

neighborhoods have many different characteristics that separate them from other

neighborhoods and make them very desirable places in which to live. In a stable neighborhood

residents tend to have lived there for a long time, there is little outmigration of residents and

little or no transient population. Properties tend to be well maintained in stable neighborhoods

as people tend to take more pride in their homes and properties which encourages other

residents to follow suit and keep up with maintenance (Doran and Lees 2005). In a stable

neighborhood; the majority of residents live in owner occupied single family homes and the

neighborhood has a high average income relative to the surrounding communities (Metzger

2000).


         When residents begin to feel little connection with their neighbors, people will have

little connection to their neighborhood. This lack of social integration often results in

neighborhood decline; a physical and social deterioration of a neighborhood. When

neighborhoods decline several common characteristics occur. Out migration occurs; long time

residents will move to more desirable communities. During decline stages, rental properties

become more prevalent. Crime rates rise and lower income residents move into the

neighborhood. Renters and low-income home owners often cannot or do not maintain their

properties as do higher income residents (Baxter and Laurie 2002; Lucy and Phelps 2000).


                                               9
Homes and properties become run-down and litter and garbage become evident and

unattended to; abandonment is also common at this lowest stage of decline (Skogan 1990).


College Towns


       The relationship between college students and local residents, in urban areas where a

college or university exists, has been referred to as ‘town-gown’ relations (Gumprecht 2003;

Kenyon 1997; Nichols 1990). Town-gown relationships and strains are not unique to

contemporary institutes of higher education. Clashes, sometimes violent, have been recorded

back to medieval London, England, where Oxford and Cambridge students often clashed with

local residents (Kenyon 1997; Mansfield 1993). Early American educational institutes dealt with

similar issues when Yale students violently clashed with local New Haven firefighters in the

early 19th century (Nichols 1990). More recently these troubles persist; a dispute over access to

public space took place in Boulder, Colorado, between local youths and University of Colorado

students. A large brawl broke out leaving one student seriously injured (Staeheli 1997). College

students are accompanied by a lifestyle and culture that is unique to the urban environment.

One fundamental difference that exists is the transient nature of college students. College

students traditionally spend four years at a college while earning a bachelor’s degree.


       However, students rarely spend the entire four years in one urban setting. The academic

calendar year is littered with vacations and breaks between semesters when students often

return to their hometowns. In Southeast Keene, students have been residents for a significantly

less amount of time compared to home owning residents. Surveyed students have an average

length of residency of less than one year, (11.6 months) whereas surveyed homeowners have
                                               10
an average residency of 17.2 years. As a result, students do not feel the same level connection

to an area as do the residents who have lived in an area for an extended period of time because

the length of residency tends to correlate to the level of connection to a residential area

(Sampson 1991). Student housing patterns shift yearly and even monthly; making the

neighborhoods in which they live considerably less stable. Neighbors tend not to interact with

neighbors who are considered temporary, which disrupts the social cohesion of the

neighborhood (Kenyon 1997).


Student Behavior


       Student behaviors can indubitably have negative effects on neighborhoods. Substance

abuse among college students is prevalent.           Substance abuse is characterized by

overindulgence in and dependence on drugs and or alcohol leading to effects detrimental to an

individual’s mental and physical welfare (Gahlinger 2004). Studies reveal that college students

tend to consume alcohol at a greater rate than do many other demographics. An ongoing

concern of many college administrations is how to respond to student alcohol consumption.

Some argue that tough campus alcohol restrictions will reduce consumption. However, tough

drinking rules often drive alcohol consumption off campus and into surrounding communities

which leads to many concerned local residents. Many parents become concerned with the

younger populations’ exposure to the negative effects of alcohol abuse. A recent study was

conducted to estimate the number of alcohol consumers by age group per state. For the state

of New Hampshire, an estimated 98,000 individuals were characterized as consuming more

than five alcoholic beverages per week (National Center for Health Statistics 2005). According

                                              11
to the national alcohol and drug abuse association, a drink is considered to be one twelve

ounce beer, one eight ounce glass of wine, wine cooler, or a one ounce shot of liquor (Gahlinger

2003). Drawing on survey results, 53.1 percent of surveyed homeowners report alcohol abuse

being evident. Similar studies suggest that a third of college students consume more alcohol

than is safe, which constitutes alcohol abuse (Sells and Robson 1998). This reinforces literature

contending that alcohol has significant effects on neighborhoods (Sampson et al 2002).


       Comprehensive community interventions that bring several departments of city

government together with concerned private citizens or organizations have been shown to

reduce drinking or alcohol related problems (Hingson 1998). On college campuses, efforts to

identify and change the behavior of high risk drinking have taken root at many institutions

across the United States. For these intervention and prevention plans to succeed, complete

agreement from campus officials and community members is mandatory. It is feasible that

stringent campus policies drive drinkers into the community.


        Underage drinking brings with it many other complications. Aside from mental and

physical damage, overindulgence in alcohol can result in fatal motor vehicle crashes, drowning,

homicide, suicide, and or alcohol and drug related overdoses to name a few (Gahlinger 2003).

According to a recent report on alcohol statistics, traffic crashes are the leading cause of death

in the United States for people younger than age twenty–five (Hingson 1998). Although laws

prohibiting sale and provision of alcohol to minors have reduced alcohol related traffic deaths,

many students report receiving alcohol from family members and friends. Minor complications

arise from drinking such as missing class, incomplete homework assignments, and hangovers to

                                               12
name a few. Difficulty meeting academic responsibilities is one of the most common

consequences of alcohol use among college students.


       Another study suggests that two in five college students are considered ‘binge-drinkers’

meaning they consume considerably more alcohol than is considered healthy (Wechsler et al.

2002). Binge drinking is distinguished as males consuming more than five drinks in one sitting

and females consuming more than four drinks in one sitting. In the early 1990’s binge drinking

gained national recognition as the number one public health problem affecting college students

(Robson and Sell 1998). Statistics also show that on nearly any college campus, 70 percent of

the student body participates in binge drinking. Out of that 70 percent, nearly half of them

binge more than once a week. Nearly half of the college binge drinkers have five or more

alcohol-related problems on campus. They may be caught by authorities, or they may partake

in vandalism and other destructive and violent acts (Brower and Carroll 2007; Copeland 2003).

College students give many reasons as to why they partake in excessive drinking. Many explain

how alcohol enhances social activity, allows people to have more fun, breaks the ice, facilitates

connection with peers, and makes it easier to deal with stress (Robson and Sell 1998). For many

students, college represents their first experiences away from home and away from adult

supervision, hence experimentation with alcohol and drugs is an acceptable behavior among

peers at most college campuses.


Physical Characteristics of Student Housing


       College students bring with them many physical characteristics that carry negative

connotations and promote a negative view of students in the community. A premier
                                               13
characteristic concerning residents is student housing. With an influx of student residents

comes an influx of rental properties. Many people see the student migration as an economic

opportunity to turn residential homes into rental properties (Gopal 2008). These landlords and

students have very little incentive to maintain their properties at a high quality often to the

dismay of their neighbors. Dilapidated rental properties are often viewed as having a negative

influence on the property values of the surrounding structures. Poor housing and property

quality can tend to have similar spiraling negative effects on the surrounding properties.

Negative externalities can spread to other properties as residents notice the lack of their

neighbors general maintenance efforts can affect the maintenance of ones own property

(Doran and Lees 2006). There are also safety concerns of unmaintained properties. Many do

not like the idea of students living in unsafe conditions, and those safety concerns can spread to

surrounding properties, such as fires. Unmaintained and unsecure housing can also invite

burglaries and other criminal activity associated with student housing (Kenyon 1997).


                                               14
Chapter 3


Keene, New Hampshire


       Keene is located in southern New Hampshire, geographically situated centrally in

Cheshire County, which in total includes 23 towns. Among the more predominantly known

towns of Cheshire County are Keene, Jaffrey, Dublin and Alstead. Cheshire County is also one of

the ten counties that comprise New Hampshire (Mensch 2001). The average income per

household in 2004 for New Hampshire residents is $57,352.00, whereas the average income for

Keene residents was $49,935. There exist a large number of non-family households in Keene. In

1999, 758 non-family household made less than $10,000. This is significantly lower than the

average income for Keene residents. It is very likely that many of these non-family/low income

households are occupied by students.


       The largest economic factors pertaining to the City of Keene are related to business and

employment. Keene has a labor force of 14,032 people. Table 1 provides the five largest

employers of Keene of which Keene State College ranks number three with, 707 current

employees (US Census Bureau). By providing over 700 people with jobs, KSC is obviously

economically valuable to the city of Keene (New Hampshire Employment 2007). The economic

impact of Keene State College has created many additional jobs to residents of Cheshire

County. During the fiscal year 2005, Keene State College bought nearly 28 million dollars worth

of goods and services, and provided more than 557 jobs to residents of Cheshire County

(Carson 2006). As the economic growth of Keene persists into the 2000’s, Keene State College

continues to expand its campus as the Keene State College enrollments likewise increases.
                                              15
Table 1 Keene New Hampshire 5 Largest Businesses


5 Largest Businesses in Keene, NH      Product/Service             Employees      Established

Cheshire Medical Center                Healthcare                  1,500       1892

C & S Wholesale Grocers                Wholesale Food              820         2004

Keene State College                    Education                   707         1909

Keene School District                  Education                   690         *varies

                                       Mini     &      Precision
TimKen Super Precision                                             632         N/A
                                       bearings

*Varies- Different schools in Keene were established at different periods of time.


       The population for Keene as of 2000, was 22,563, but increased to 22,893 people by

2007. Population density for Keene is 609 people per square mile. Figure 3 represents the age

structure of Keene. The largest populations are present in the age groups 15-19 and 20-24, in

comparison to all other age groups. This undoubtedly reflects the demographic impact of Keene

State College


                                               16
Figure 3 Demographic distribution shown in percentages.


Keene State College Background


       Presently, a total of 5,443 full time and part time students including undergraduate,

graduate and continuing education students attend Keene State College. The community of

Keene State College is made up of mostly females, which encompass 3,124 females and the

males with 2,319. On average, the age of undergraduates that attend Keene State College is 21,

with the average number of first-year students being 18. Since 2005, Keene State College has

been accepting an increasing number of students each Fall semester (Figure 4). As the college

accepts an increasing number of students, the demand for housing similarly increases. With

limited on-campus housing capabilities and the soaring freshman enrollment, junior and senior

students are pursuing off-campus housing, predominately in nearby residential neighborhoods

(Carson 2006).

                                             17
Figure 4 Total Fall Headcount Student Enrollment, Years 2001-2007.

       Despite concerns of some in the neighborhood, 41.5 percent of residents surveyed in

Southeast of Keene, strongly agreed that “there can be no doubt that Keene State (college) is

one of the most valuable facilities in the city and to the southwestern region of N.H. as well.”

(Figure 5). Figure 5 was compiled from survey data which was produced to gauge the perceived

importance of Keene State College to the city and region. The percent gradually increases as the

highest percentages of neighborhood residents strongly agree that Keene State College is a

valuable commodity to the community.


Figure 5 Survey Responses Pertaining to KSC’s Perceived Value to the Community.

                                              18
Southeast Keene Neighborhood Change


        It is difficult to determine exactly what stage of change neighborhoods are currently

experiencing. Different parts of a city can be experiencing different neighborhood changes

simultaneously. One area can be declining while another revitalizing through different social

actions and private or public investment. Southeast Keene is experiencing changes in

demography manifested by students moving into the neighborhood. Some people view a rising

student population as an economic opportunity and capitalize on it by making previously single

family homes rentable to college students (Gopal 2008). In Southeast Keene many homes have

been converted from single family units to double or triple family homes in recent years (Figure

6). This would suggest that Southeast Keene is experiencing Stage Two or Three of

neighborhood decline. Using data from the City of Keene Department of Assessment, Figure 6

displays the increased conversion of single family homes to multiple family dwellings from the

year 2001 to 2008. Notice the western portion of the 2008 map; the high density of multifamily

homes increased drastically from 2001. This area is also in the closest proximity to Keene State

College and is home to many student households as evidenced by mapping data from the office

of the Registrar at Keene State College (Figure 7). The City of Keene is also taking steps to

preserve the residential neighborhoods of the city. The city previously set forth an ordinance to

cut back on fraternities and large multiple occupancy off-campus housing units. This is a

primary characteristic of declining neighborhoods (Pacione 2001).


                                               19
Figure 6 Number of families per Household 2001 to 2008
                                            20
Figure 7 Student Households in Southeast Keene Neighborhood


Responses to Change


       It is also feasible that Southeast Keene residents and city officials take steps to begin

revitalizing the neighborhood, or at least stop or slow decline. The formation of the Southeast

Keene Neighborhood Group is a primary indicator or revitalization efforts. Social efficacy at the

local level is often the most powerful tool residents have in improving or maintaining their

quality of life (Sampson 1991; Bright 2000). The Southeast Keene Neighborhood Group was

originated with the intention of mobilizing the neighborhood against the effects of students

moving into the community. The Southeast Keene Neighborhood Group website provides a

                                               21
brief description of the purpose of the group, “We are a committed group of Keene, NH

residents trying to maintain the quality of life in our Southeast Keene neighborhood”

(Southeast Keene Neighborhood Group 2008). In 2007 the group started meeting monthly, on

every second Tuesday to discuss the neighborhood’s positive and negative aspects. There are

currently 36 registered members in the Southeast Keene Neighborhood Group, website. When

visiting the Southeast Keene Neighborhood Group online, members of the group post forums

on the quality and satisfaction levels and important information that is occurring in their

neighborhood.


       The City of Keene is taking steps to reverse or stop the decline of residential

neighborhoods. A city wide ordinance states that no more than four occupants with different

last names can take up residence in the same dwelling. Similar ordinances have been passes in

other college towns in response to student housing crises (Gumprecht 2003). This ordinance

was in part a response to large fraternity houses and off-campus student dwellings that were

considered a nuisance (Kopczynski 2008). The ordinance may have stopped large house parties

which are of concern to city officials and residents. The ordinance, however, also forced

students to disperse into residential neighborhoods in search of housing. This particular step

may have partially rectified one aspect of decline. Large parties and general disorder are

associated with fraternity houses, but it may have inadvertently exacerbated other

characteristics of decline by increasing housing demand and in turn catalyzing the increase of

rental properties. The City Council is also currently attempting to pass a series of ordinances

that will hold renters and landlords, more accountable for the conditions of their properties.


                                              22
This ordinance would require a registration of all rental properties to make it easier to identify

the properties that are problematic.


       The City of Keene Code Enforcement Department (KCED) has implemented a series of

ordinances in order to rectify the physical characteristics of neighborhood decline. This

department oversees many aspects of public and private development and maintenance. It is

through KCED that many maintenance issues are addressed by city officials. Owners of homes

can be held accountable for the general condition and maintenance of their properties. Many

cities have similar departments and with similar guidelines to encourage the upkeep of

privately owned properties. These ordinances were specifically proposed to deal the increasing

number of student properties which are subject to many violations under current code

enforcement ordinances (Figure 8). The properties highlighted signify reported code violations;

the parcels represented by red signify code enforcement violations taking place at student-

occupied households. Even though student households do not make up the majority of the

neighborhood their households tend to carry a disproportionately high number of cases, over

50 percent.


                                               23
Figure 8 Building Code Violations


       The KCED is working currently trying to come up with a solution to the problems posed

by student households. Keene is attempting to implement more stringent ordinances for

student occupied housing. Keene City officials have contacted other New Hampshire

municipalities in an attempt to better understand how the towns of Durham, Hanover,

Plymouth, and Rindge (all home to colleges or universities of differing sizes) have dealt with the

issue of student housing. All four of these towns have attempted to enact similar regulations

but have not succeeded and all have expressed interest in what direction the City of Keene will

take in addressing the student housing issue. If these proposed ordinances are passed in Keene,


                                               24
the new efforts will include increased fines, violation based registration of student households,

and a ‘Party House’ designation. The ‘Party House’ designation would identify and fine houses

that habitually cause disturbances to the public; whether they are noise, structural, or general

disorder issues (Kopczynski 2008).


       Keene State College is also taking action in an attempt to minimize the detrimental

effects students have on the community. One step is the attempt to stabilize the college’s

enrollment. A recent influx of students caught the administration off-guard when a greater,

than expected, number of accepted students decided to attend KSC. This caused an on-campus

housing shortage and forced many upperclassmen off-campus and into rentals recently

converted from single family use. The school employs a full-time police officer who acts as a

liaison between campus officials and the police department. The school has also recently

entered into an agreement with the town to pay for municipal services that are associated with

the college and college students. An estimated 20 percent of all emergency calls in Keene are

associated with KSC students. Therefore, the college has agreed to pay for 20 percent of the

emergency response cost in an attempt to alleviate the strain KSC is causing the city. This bill

will amount to over one million dollars over the next four years (Robinson 2008; Palermo 2008).


                                               25
Chapter 4


Methods


       Primary data collection is one of the most important aspects of social science research.

Surveys represent one of the most common types of quantitative, social science research (Fink

2003). Primary data can be collected in many different ways. For this study, two primary data

collection methods were employed in order to obtain the necessary information to provide

meaningful statistical analysis or social and physical aspects of the neighborhood and its

residents. First, a survey was developed to obtain data from residents regarding their attitudes

and opinions regarding the neighborhood. The second tool used was a housing assessment,

designed to assess the physical structure of homes and the general condition of the property.


Survey Methodology


       Survey research can take many forms; questionnaires or surveys are usually physically

distributed to respondents, these can be distributed by hand or through the mail. Other forms

of survey research can be online questionnaires, face-to-face interviews, or telephone

interviews. Using surveys, it is possible to collect data from large or small populations. The two

most popular forms of survey research are questionnaires and personal interviews. Surveying

provides imperative information in understanding the concerns, characteristics and

demographics of a certain control group. Initial planning of the survey design and survey

questions is extremely important in conducting survey research. The process of selecting the

appropriate survey method begins with examining different types of techniques and

                                               26
determining which one is best suited for obtaining the information pertinent to the research

questions at hand. Surveys must be designed with careful consideration to ensure that

respondents can clearly interpret and respond to each question and provide useful and

meaningful response. It often requires tremendous time and effort critiquing each question

making sure it is vital to the survey and relevant to the overall study. Surveys are designed to

give a better understanding of the concerns and general feelings of the respondents (Weisberg

2005).

         For this research project, the decision was made that as many residents as possible in

the Southeast neighborhood would be asked to participate in a door-to-door survey (Figure 9).

In order to assure the survey was free from error; several surveys were distributed to the

Southeast Neighborhood Group, which meets monthly in the Keene Public Library. Because this

group is concerned with the same objectives as the project at hand, they were ideal candidates

for a pretrial of the survey. These pilot surveys identified some structural issues that were

rectified before the final product was distributed to the public.

         Researchers distributed the survey in Southeast Keene on three different occasions. The

first survey was administered on a weekday afternoon because most children are home from

school at that time, and a parent would likely be home. The first day yielded fifteen completed

surveys. The second attempt of administering surveys took place on a Saturday morning when

families were likely to be home. Streets in close proximity to Baker Street were the focus area

of this survey distribution. A total of sixteen surveys were collected. Similar to the first day of

surveying, the third trial of surveying took place on a Thursday afternoon. Marlboro Street and

the adjoining streets were the main focus of this distribution in which nineteen surveys were
                                                27
collected. The third day of sampling yielded more surveys completed by students who rent

opposed to the first two distributions which produced mostly homeowners (Figure 10).


Figure 9 Locations of Surveyed Residents


                                             28
Figure 10 Surveys being distributed

       Additional surveys were handed out by different individuals of the group as well as by

the Professor facilitating the project. Each resident was approached with the same

questionnaire in hopes that everyone would agree to filling out the survey. The majority of

residents were willing to take part in the study and seemed interested in the goings-on in the

neighborhood. Many residents seemed eager to voice their concerns and attitudes regarding

the state of their neighborhood. The final outcome resulted in a total of 65 completed surveys

from 332 residential households in the neighborhood.

       The layout of the survey was a two sided questionnaire containing issues deemed

pertinent to the community and its resident’s daily lives (Appendix A). A brief introduction at

                                              29
the top of the survey states its purpose and clarifies how it will be used to gain a better

understanding of the concerns residents are experiencing. The first two questions identify

respondents according to gender and whether the respondent is a renter or owner. The

purpose of these questions is to divide respondents into groups in order to detect statistical

trends that may occur. Employing the Likert Scale; the next two questions were asked to

determine respondents overall satisfaction levels as well as determining whether satisfaction

levels were increasing, decreasing, staying the same, or no opinion. The Likert Scale is a

measurement scale used in research, which assigns numerical value for multiple answers given

on a survey (Fink 2003). Answers are given on a scale ranging from complete agreement on

one side to complete disagreement on the other side, with no opinion in the middle. For this

particular question a four-point differential Likert scale was implemented because it is a scale

with an even number of points with no mid-point forcing respondents to make a clear, concise

choice (Fink 2003).

       The next section of the survey dealt with specific aspects of life within Southeast Keene.

Residents were asked to rate their attitudes regarding litter, violation of traffic laws, sidewalk

conditions, safety, alcohol and or drug abuse, and recent changes in property values. Using a

five-point Likert scale consisting of the categories: strongly agree, somewhat agree, no opinion,

somewhat disagree, and strongly disagree, residents rated their attitude on the various topics.

The responses of these questions will be used in statistical analysis to identify and examine

trends that occur within and in between each grouping variable.

       The reverse side of the survey identifies the respondent as either a Keene State College

student or not. The subsequent questions determine the perceived effects associated with
                                               30
college students in the neighborhood. Using a five-point Likert scale, respondents answered

what type of impact Keene State students have on the neighborhood given the choices of

‘strong positive, positive, neutral, negative, and strong negative impact’. This was designed to

make conclusions on whether there is a correlation between non-students and negative

opinions about the neighborhood. Individuals were also asked to identify the proximity in

which they live to college students. They had the choice of classifying themselves as immediate

neighbors, two to three houses away, four or greater houses away, or not in close proximity.

This is a vital question to ask because the distance residents live from students may have direct

influences their opinions positively or negatively. Individuals were then asked, in the past five

years or since taking up residency in the neighborhood, whether or not they had noticed an

increase in the number of college students living in the neighborhood. Residents then had the

option of stating if they have ever had to call the Police to respond to a disturbance and if so

how many times.

       The concluding questions of the survey implemented the four-point Likert scale by

asking residents to rate their relationship with neighbors. They had the option of rating their

relationship as either poor, fair, good, or excellent. Following this question, residents were

asked to rate their level of agreement with a past neighborhood assessment of Keene. The past

assessment stated: “there can be no doubt that Keene State (College) is one of the most

valuable facilities in the City and to the Southwestern region of N.H. as well.” With the aid of a

five-point Likert scale, respondents were able to classify whether they strongly agreed,

somewhat agreed, had no opinion, somewhat disagreed, or strongly disagreed with the


                                               31
statement. As a conclusion to the survey, respondents were asked to complete sentences

describing the best and worst thing about their neighborhood.

Survey Results


       Drawing on data collected from the survey, several statistical trends were identified

regarding residents’ attitudes regarding their neighborhood. The two primary groups surveyed

were student residents and non-student residents. This group was nearly evenly surveyed. Of

the surveyed population, 46.2 percent were current Keene State College students and 53.8

percent were local residents. Ownership and rental rates followed this trend, as zero percent of

students reported owning a home, while 90.4 percent of non-student respondents are

homeowners. The survey was also designed to detect trends differentiated by gender, 63

percent of respondents were male and 37 percent were female.


       As expected, the non-student population has a significantly longer term of residency

than do students. No students report having lived in the neighborhood for longer than three

years. At 11.6 months, the average term of residency for students is under one year, while the

average term of residency for non-students is 17.2 years. This is unquestionably affected by one

significant outlier, a resident of 60 years. This range displays a vast discrepancy for two

populations with near equal numbers (Figure 11). This displays the transient nature of college

students within the neighborhood. As mentioned in Chapter 2; length of residency is a primary

indicator in a resident’s level of commitment to a neighborhood (Sampson 1991). This

difference displays a primary difference existing between respondent groups. A person who has


                                              32
lived in the neighborhood for a short period of time will have much different perspectives

regarding neighborhood change.


       Non-student residents, on average, have a decreasing level of satisfaction whereas

student resident’s average level of satisfaction is more stable. Just over 37 percent of home-

owners report their neighborhood satisfaction level as decreasing. This is in stark contrast to

student respondents, 86.7 percent of which feel their satisfaction levels are staying the same or

increasing. This difference can be attributed to the non-student’s length of residency (Figure

11). It is plausible that the longer residents have lived in the neighborhood, the larger the

amount of change they have witnessed. It is also plausible that the influx of student households

can exacerbate the declining satisfaction levels of non-student residents. To examine this

question, a Correlation test was run to determine any relationship, if any, dropping satisfaction

levels have with the perceived influx of students. A correlation test measures the level of

association between two spatial variables (McGrew and Monroe 2000). The results of this test

returned significant results at the .066 level. This presents a cause of concern for the future of

satisfaction levels of residents if students continue to move into the area. This also signifies

some characteristic attitudes and sentiments associated with the early stages of neighborhood

decline.


                                               33
Non-Students                      KSC Students
Figure 11 Total Months of Residency for Non-students and Students

        When asked to compare the quality of life of their neighborhood to other

neighborhoods within Keene, students and non students again showed a significant difference

in sentiments. Students, overwhelmingly, believed the average quality of life was significantly

higher than other neighborhoods. Non-student respondents were more likely to believe their

neighborhood was equal to other neighborhoods in Keene. This difference of means occurs at

the .006 significance level this represents a statistically significant difference in average

attitudes between students and non-student residents. If friendships and local acquaintances

increase residents connection to a neighborhood (Sampson 1991) than it can be expected that

neighborhood satisfaction levels will increase if survey respondents report good relationships

with their neighbors. Satisfaction levels have a very significant positive correlation to reported

relationships with neighbors; it is again statistically significant at the .01 level (Table 2).

                                                   34
Table 2 Correlation Between Satisfaction Levels and Relationships with Neighbors


                                                  Correlations

                                                                    Satisfaction         Neighbor Relations
                                                                                                              **
Spearman's rho        Satisfaction Correlation Coefficient                   1.000                      .453

                                     Sig. (2-tailed)                                .                    .000

                                     N                                             65                     65
                                                                                    **
                      Neighbor       Correlation Coefficient                 .453                      1.000
                      Relations
                                     Sig. (2-tailed)                           .000                            .

                                     N                                             65                     65

**. Correlation is significant at the 0.01 level (2-tailed).


         This survey was designed to gauge respondents’ level of concern regarding several

different aspects of neighborhood life. The results of this portion of the survey have identified

several more significant differences in student and non-student sentiments regarding their

neighborhood. Non-student residents are more concerned with litter and garbage in their

neighborhood. Likewise, when asked to respond to traffic concerns, students are significantly

less concerned with drivers obeying traffic laws than non-student residents. While some

residents report being very unsatisfied with sidewalks in their neighborhood, no significant

difference exists between students and non-students. This portion of the survey returned

results that indicate student respondents generally have no opinion about traffic or public

space in their neighborhood. This statistic speaks to the general apathy students are

categorized as having.


         A primary factor in people’s perceptions of a stable neighborhood is safety, residents

feel little connection to an area in which they do not feel safe (Doran and Lees 2005; Saunders

                                                               35
1999). All respondents of this survey report feeling safe in their homes. However, non-students

do report feeling less safe than do students when walking at in the neighborhood at night. This

difference in the perception of safety is largely insignificant both demographics generally agree

on the feeling of safety. This implies that residents of Southeast Keene still view their

neighborhood as a safe place to live. This is a promising statistic that reflects a positive aspect

of Southeast Keene recognized by both students and local residents.


       As identified above, many statistically significant differences exist between student and

non student residents. However, very few differences occur between genders. Non-student

resident females report very similar sentiments as their male counterparts regarding their

neighborhood. Some differences that do occur on a significant level pertain to traffic. Female

residents report a higher rate of dissatisfaction in regards to drivers’ compliance with traffic

regulations. Another significant gender difference that occurs regards the perceived impact

Keene State College students have on the neighborhood. Males tend to believe students have a

more positive impact than do females which is significant at the .006 level. This trend

corresponds with the question asking respondents to rate Keene State College’s value to the

City of Keene. Males tend to view KSC as a more valuable entity to the city than do females.

This significance also occurs at the .006 level.


       Property values are often assessed in order to gauge the condition or stability of a

neighborhood. Stable property values often indicate a stable and healthy neighborhood

whereas decreasing property values are a principle factor in neighborhood decline. When

property values begin to decline a host of other negative characteristics of decline soon follow.

                                                   36
Outmigration among former residents becomes prevalent, lower income residents move to the

neighborhood, rental housing increases, and crime rates rise (Metzger 2000; Skogan 1990). Due

to these effects; it is no surprise that property values are of chief concern to homeowners.

Keene is no exception, when surveyed; homeowners report their property values have recently

dropped due to changes in their neighborhood. When asked to gauge their own property

values, 80 percent of surveyed students had no opinion on the matter.


       While many homeowners believe their property value has declined, property values

have increased in the entire City of Keene since 2001. If homeowner’s concerns can be justified

or accurate; property values in Southeast Keene will have increased less than the city as a

whole since 2001. However, the perceived decrease in property values is inaccurate. Residential

property values in Southeast Keene have increased at a greater rate when compared to the

entire city (Table 3). This seems to contradict the neighborhood decline that a main focus of

this study. However, as previously stated (Figure 7), many homes in Keene have been converted

from one family to multiple unit homes in response to the increase in rental demand from 2001

to 2008. Multiple unit homes are more valuable on the housing market than single unit homes

especially when there is a steady demand for temporary housing as there is in Keene. The

increase in rental housing is a sign of neighborhood decline, but also represents added

economic value to properties. This economic value does not apply to the neighborhood. The

economic value exists only for the owner of the property who is personally capitalizing on

renting the property. In Southeast Keene, property values are not a reliable indicator of

neighborhood decline.


                                              37
Table 3 Keene, New Hampshire Property Values 2001 to 2008


                       2001                    2008                  Percent Increase

Keene                         $126,474                $223,731             76.8%

Southeast Keene               $95,188                 $182,995             92.2%

*City of Keene Department of Assessment Data

        Drawing on data collected with the open response questions on the survey, some trends

became evident regarding respondents attitudes toward the ‘best’ and ‘worst’ aspects of their

neighborhood. The best quality of southeast Keene, as reported by residents, is its location.

Over forty percent of respondents cite Southeast Keene’s proximity to downtown as its ‘best’

feature.   Nearly the same percentage of respondents report the ‘best’ aspect of their

neighborhood is their neighbors. Many of these respondents characterize their neighbors as

friendly and considerate. Location and social cohesiveness are two characteristics that are

common in all stable neighborhoods. The best aspects of Southeast Keene show no clear

distinction between student and non-students respondents. The majority of both groups value

the same aspects of their neighborhood. Other valued characteristics of the neighborhood

were its safety, proximity to schools, quietness, and cleanliness.


        When asked to identify the ‘worst’ aspect about the neighborhood, there was a much

wider range of responses. These aspects differed widely between student and non-student

residents. Keene State College and Keene State College students were mentioned in some

fashion in nearly 20 percent of the responses regarding the worst aspect of the neighborhood.

However, these responses differed in their reasons.         Even more unpopular than student
                                                38
housing and poor student behavior however are housing issues. Over 30 percent of the worst

aspects of the neighborhood involve housing issues, including; increase in rental housing, high

turnover rates, disorder of rental properties, and unresponsive landlords. These are all issues

that predominantly concern the non-students populations. In the student population concerns

were much different. Many student respondents had nothing negative to report about their

neighborhood and simply left this portion of the survey blank. Again, outlining the apathy that

exists with students and their neighborhoods. Other aspects of the neighborhood concerning

students were the lack of parking, road conditions, and neighbors. Nearly 15 percent of student

respondents mentioned poor relations with their neighbors as the worst aspect of their

neighborhood.


                                              39
Chapter 5

Housing Assessment Methodologies

         For the housing quality assessment in Southeast Keene, two sample populations of

homes were selected from the neighborhood. The first population was comprised of local non-

student homes while the other sample consisted of known student addresses obtained from

the Keene State College Registrar’s office (Figure 12). In order to pick which houses were to be

analyzed, a random sampling number was generated in order to obtain a random starting point

for each population pool. It was determined that the starting point address for off campus

students was 38 South Street. Beginning with 38 South Street, every fifth student household

was assessed while skipping non-student households. The starting point for non-student

housing for non-student residents was 95 Adams Street and every fifth property was assessed

skipping known student households. Both focus groups were assessed by the same researcher

using an identical assessment tool for each population (Appendix B).

         The housing quality assessment was implemented on two different occasions. The

initial day of evaluation was conducted on a weekday afternoon. The focus for the first day of

appraisal was non-student residents located in the Southeast neighborhood. The remaining

households were assessed the following weekend along with the completion of the entire

student household group. Assessment was completed by the same individual and was done so

by driving slowly by each house and critiquing from the road (Figure 12).


                                              40
Figure 12 Housing Assessment Properties

         Housing quality was evaluated on a scale from one to three. If an aspect of a house

scored a value of one, there were major problems, a score of two had minor problems, and a

score of three had no problems. To determine the overall quality and condition of the houses’

exteriors, there were five main points of focus for the housing assessment. The points of focus

included paint or exterior finishes, the condition of windows and doors, roof quality and

condition, porches and decks including railings and any steps (Figure 13).


                                               41
Poorly Assessed Housing Characteristics


           Broken and missing windows               Major problems with paint and trim


         Major problems with roof quality           Major problems with paint and trim


Figure 13 Assessed Housing Externalities

       The general parking condition was assessed for each selected house to determine if the

house had adequate parking. If houses had cars parked on the street or on the grass, parking

was considered inadequate. This section included any walkways or sidewalks that were present;

these were assessed according to their general condition and the presence or absence of cracks

or damage (Figure 14).

                                               42
Assessed Parking Conditions


                 Cars parked on lawns in violation of city code enforcement


Figure 14 Assessed Parking Conditions

The final components graded were litter and/or garbage surrounding the house, the presence

of a dumpster, and general landscape maintenance (Figure 15).

                        Negative Externalities on Properties


            Discarded mattress                Discarded bicycle, ladders and litter


                                 Dumpsters and litter


Figure 15 Negative Items on Properties
                                                43
Results


          The Housing assessment also produced some statistical differences in the quality and

condition of housing in the neighborhood. The majority of student housing is of lower quality

than owner-occupied housing. The student housing sample population has an average quality

assessment of 2.5 on a three point scale. Owner-occupied housing scored a 2.819. This is not a

statistically significant difference in means but it is a trend in housing quality. Another

important trend to recognize is that owner-occupied housing scored slightly lower assessments

in areas where a high density of student housing is present. This solidifies the spiraling theories

of decay which state that disorder and decline will inevitably spread to the properties in close

proximity (Skogan 1990; Doran and Lees 2005). The poorly assessed homes tended to be

grouped together as did the more positively assessed homes.


          Some specific difference occurred regarding the quality and condition of owner and

student occupied housing. Student Houses are significantly more apt to have a dumpster. This is

likely because many student houses are occupied by up to four adults who will produce much

more waste than other types of households. Also, many students are not residents of the City

of Keene and therefore do not have the same kind of access to city waste facilities. Most rental

properties include some kind of trash pickup for residents, and dumpsters represent the most

efficient process for waste removal with little regard to the perceptions associated with

dumpsters in residential neighborhoods.


          Statistical significance was difficult to detect through this assessment. The differences

that did occur are visibly easy to discern (Figure 16). Some non-student properties are in
                                                 44
exceedingly poor condition. These homes threw off any statistical significance that would have

occurred. Assessing homes in smaller microcosms of the neighborhood could have returned

more significant differences between residential and student properties and areas.


                 Non-Student Housing                          Student Housing


Figure 16 Student and Non-student Housing.


                                              45
Chapter 6

Limitations

       As with many studies, principal limitations are associated with the design and

implementation of the survey instrument utilized in this study. One challenge experienced

while designing the survey was ensuring each question was applicable to both resident and

renter occupied households. Drawbacks were experienced when dispersing the surveys door-

to-door. As not all residents chose to participate in the survey, which in turn reduced the

amount of completed surveys used to run statistical tests and analyze results. Locating data

revealing the addresses of off-campus student households was problematic due to the fact that

not all students report their off campus addresses to the Keene State College Registrar’s Office,

while others do not allow their information to be publicly disseminated.

       Additional limitations were experienced while conducting the housing assessment. The

standard by which houses are assessed in this study was somewhat subjective in that the

researchers have had no formal training in housing assessment. As previously mentioned, it

was not possible to obtain a complete and accurate list of student households. Therefore, some

of the non-student dwellings assessed may have housed student occupants. When mapping the

houses which were assessed in the Southeast neighborhood of Keene, the associated data file

did not provide a current listing of all properties that housed multiple families, which inhibited

the ability to identify on the map each evaluated domain.


                                               46
Conclusions


       This study has returned conclusive results regarding primary data analysis. There is a

significant difference regarding the perceptions of the case study neighborhood between

student and non-student residents. Students, in general are less concerned with centrifugal

forces that are taking place in the neighborhood, this is likely attributed to the short term of

residency of students. They have little economic investment in the place they live. Conversely,

non-student residents are raising families and are investing or have invested large amounts of

social and financial capital into their homes and neighborhood. The survey data presents a

cautionary outlook as more students are expected to enter the neighborhood and many

residents report a deteriorating level of satisfaction.


       Many actions need to take place in order to reverse or stall the trends and perceptions

of neighborhood decline being experienced by Southeast Keene. The level of cooperation

between the City and the College must be high. The college and the city are beginning to work

in conjunction more so than years previous. Other institutions have implemented programs

within the college itself to promote and solidify the reputation of the college or university

within the community. One such program took place in Birmingham, Alabama, where incoming

students were encouraged to be active in the community and were made aware of what makes

a good neighbor. This program was implemented after some community backlash began to

occur in response to large fraternity parties and general disorder (Nichols 1990).


       This is a good start, but students should be required to sit through a lecture, or even a

semester long class in what it means to be a positive and cohesive member of a community.
                                                 47
This would increase students’ awareness of residential concerns of student lifestyles in the

immediate community where their college is located. This would hopefully increase students’

attention to their actions and behavior and how it reverberates in the community. This system

would be implemented by the college, but would be most effective if it included members of

the community as well as city officials such as police officers or council members. This sort of

system would hopefully make for a more responsible student living in the community which

could potentially correlate with a better reputation of students and the institute at which they

study.


         A class such as this would not only make for a more responsible student-resident, but

the lessons learned could also endure into adulthood and make for more responsible adult

homeowners. This class would encapsulate the dynamics of local society. Many classes exist in

global economic affairs, or global geographic regions, or global awareness in general. There are

relatively few classes that focus on the local aspects of being a good citizen. A class of this type

could have far reaching implications in the college, the community, and lives of students. More

studies would need to be developed to expand this idea, but inaction on the part of any or all

parties involved will only decay the much sought after quality of life in Keene’s residential

neighborhoods.


         To reverse or stop neighborhood decline the City of Keene can take action through

increased code enforcement, though a crucial component of any city taking action is

accountability. There are two parties involved in the student housing issue, landlords and their

student tenants. The student housing issue is not solely caused by a student presence. Students

                                                48
renting houses cannot be held accountable for all of the negative aspects associated with

student households. Students living in the neighborhood must be held accountable for their

behavior and the cleanliness of the properties in which they live. Negative characteristics, such

as litter, parking on lawns, loud parties and disruptive behavior can all be directly attributed to

students. These are mostly issues of responsibility and can be addressed with fines and tickets

for code enforcement violations.


       Holding landlords responsible for the condition of their properties can be problematic,

as the City of Keene has no official registry of rental properties. Landlords must also be held

accountable for the conditions of the households they rent out to students. Landlords are

responsible for the structural integrity of their properties. The tenants cannot be expected to

conduct repairs on roofs, windows, or other externalities of the houses in which they live.

Therefore, there needs to a distinction between rental properties and owner occupied housing

when assessing the condition of the property. Landlords are responsible to keep up the outside

appearance and condition of their properties, but are also responsible for the inside of their

dwellings. They need to be held accountable for the safety of their tenants. Some properties

rented to students are simply unsafe. Students living in troubling conditions often do no know

where to turn for help in dealing with absentee landlords. Information should be made

available to students planning to live off-campus about the rights they have as renters. Students

should understand their responsibilities as well as the responsibilities of their landlords.


       In the City of Keene, these steps towards responsible student citizenship and improved

town-gown relations are already underway. While concern persists in the Southeast Keene

                                                 49
neighborhood, there still exists overarching attitudes of goodwill to the college and its students.

Many residents report having no trouble with student neighbors, with several even going so far

as to praise some student households for their contributions to the community. Amongst

students themselves there is also recognition of the need for civility, and concern that a few

student households may taint the overall image of the Keene State College student. With

positive attitudes and proactive solutions, the future of the Southeast Keene Neighborhood

remains hopeful.


                                                50
Literature Cited


Aitkin, Stuart C. 1990. Local Evaluations of Neighborhood Change. Annals of the Association of
        American Geographers. 80 (2):247-267.

Banerjee, Tridib and William C. Baer. 1984. Beyond the Neighborhood Unit: Residential
       Environments and Public Policy. New York, NY: Plenum Press.

Baxter, V. and, Mickey Laurie. 2000. Residential Mortgage Foreclosure and Neighborhood
       Change. Housing Policy Debate 11 (3): 675-99.

Bright, Elise M. 2000. Reviving America’s Forgotten Neighborhood. New York: Garland
       Publishing.

Brower, Aaron M. and Lisa Carroll. 2007. Spatial and Temporal Aspects of Alcohol-Related
      Crime in a College Town. Journal of American College Health. 55(5): 267-275.

Carson, Cristi. 2006. Keene State College. Economic Impact of the College on the Community,
       Region and State. Office of Research and Planning, University System on New
       Hampshire.

Copeland, L. 2003. College Towns Fight Student Slums. USA Today, 2 October.

Doran, Bruce J. and Brian G. Lees. 2005. Investigating the Spatiotemporal Links Between
       Disorder, Crime, and the Fear of Crime. Professional Geographer. 57(1): 1-12.

Faulkner, Philip. 1993. Economic Development Plan. City of Keene New Hampshire.

Fink, Arlene. 2003. The Survey Handbook, Second Edition. Thousand Oaks, CA: Sage
       Publications.

Gahlinger, Paul. 2004. Illegal Drugs: A Complete Guide to their History, Chemistry, Use, and
       Abuse. New York: Plume.

Galster, George. 2001. On The Nature of Neighborhood. Urban Studies. 38 (12): 2111-2124.

Gopal, Prashant. 2008. College Towns: Still a Smart Investment. Business Week. 5.


                                               51
Graham, John. 2005. Stick Your Neck Out: A Street Smart Guide to Creating Change in your
      Community and Beyond. San Francisco: Berrett-Koehler Publishers.

Gumprecht, Blake. 2003. The American College Town. The Geographical Review 93 (1): 51-80.

Hallman, Howard. 1984. Neighborhoods: Their Place in Urban Life. California: Sage
      Publications.

Hingson, Ralph W. 1998. Public Health Reports 113(1): 52-55.

Kenyon, Elizabeth L. 1997. Seasonal Sub-Communities: The Impact of Student Households on
      Residential Communities. The British Journal of Sociology. 48 (2): 286-301.

Kopczynski, Medard K. 2008. Code Enforcement Options. Prepared for the Planning, Licenses,
      and Development Committee. City of Keene, New Hampshire Health Department.

Lee, B.A., and K.E. Campbell (1997) “Common Ground? Urban Neighborhoods as Survey
        Respondents See Them,” Social Science Quarterly 78(4): 922-936.

Lee, Barret, R.S. Oropesa and James W. Kanan. 1994. Neighborhood Context and Residential
       Mobility. Demography. 31 (2): 249-270.

Lee, Barret. 2001. Taking Neighborhoods Seriously. In Does it Take a Village? ed. Booth, Alan
       and Ann C. Crouter, 31-40. New York: Lawrence Erlbaum Associates.

Logan, John R. and O. Andrew Collver. 1984. Residents’ Perceptions of Suburban Community
       Differences. American Sociological Review. 48: 428-433.

Lucy, William H., and David L. Phelps. 2000. Confronting Suburban Decline. Washington DC:
       Island Press.

Mansfield, Nick. 1993 Grads and Snobs: John Brown, Town and Gown in Early Nineteenth-
      Century Cambridge. History Workshop. 35: 184-198.

McGrew, J. Chapman, and Charles B. Monroe. 2000. An Introduction to Statistical Problem
     Solving in Geography. Boston: McGraw-Hill Company.

Mensch, Ann. 2001. New Hampshire Local History: Cheshire County. http://home.att.
      net/~local_history/NH-Cheshire_Co.htm (last accessed 28 October 2008).

Metzger, J. 2000. Planned Abandonment: Neighborhood Life Cycle Theory and National Urban
      Policy. Housing Policy Debate. 11(1): 8-31.

                                             52
New Hampshire Employment Security. 2007. Economic & Labor Market Information Bureau.
     http://www.nh.gov/nhes/elmi/htmlprofiles/keene.html (last accessed 11 November
     2008).

Nichols, David. 1990. University-Community          Relations:   Living   Together   Effectively.
       Springfield: Charles C. Thomas Publisher.

Pacione, Michael. 2001. Urban Geography: A Global Perspective. Glascow: Bell and Bain.

Palermo, Sarah. 2008. Plan: KSC to Pay More for Services. The Keene Sentinel. November 20.

Robinson, Andrew. 2008. Keene State’s Response to Off-campus Housing Issues. October 29,
       2008.

Sell, Louise and Robson, Philip. 1998. Perceptions of College Life, Emotional Well-Being and
        Patterns of Drug and Alcohol Use Among Oxford Undergraduates. Oxford Review of
        Education. 24(2): 235-244.

Sastry, Narayan, Anne Pebley and Michela Zonta. 2002. Neighborhood Definitions and the
        Spatial Dimension of Daily Life in Los Angeles. Presentation at the 2002 Annual Meetings
        of the Population Association of America, Atlanta, Georgia. April 2002.

Sampson, Robert. 1991. Linking the Micro and Macrolevel Dimensions of Community Social
      Organization. Social Forces. 70 (1): 43-64.

Sampson, Robert, Jeffrey D. Morenoff and Thomas Gannon-Riley. 2002. Assessing
      “Neighborhood Effects”: Social Process and New Directions in Research. The Annual
      Review of Sociology. 28: 443-478.

Sampson, Robert and Stephen W. Raudenbush. 1999. Systematic Social Observation of Public
      Space: A New Look at Disorder in Urban Neighborhoods. The American Journal of
      Sociology, Vol. 105, No. 3 (Nov., 1999), pp. 603-651

Saunders, Ralph. 1999. The Space Community Policing Makes and the Body That Makes It.
      Professional Geographer. 51 (1): 135-146.

Sells, Louise and Philip Robson. 1998. Perceptions of College Life, Emotional Well-being and
        Patterns of Drug and Alcohol Use among Oxford Undergraduates. Oxford Review of
        Education. 24 (2): 235-243.

Sibly, R. and Jim Hone. 2002. Population Growth Rate and its Determinates: an overview.
        Philosophical Transactions: Biological Sciences 357 (1425): 1153-77.

                                              53
Skogan, Wesley G. 1990. Disorder and Decline: Crime and the Spiral of Decay in American
      Neighborhoods. Ontario: Collier Macmillan Canada.

Staeheli, Lynn A. and A. Thompson. 1997. Citizenship, Community, and Struggles for Public
       Space. Professional Geographer 49(1): 28–38

Southeast Keene Neighborhood Group. 2008. http://southeastkeene.ning.com/ (last accessed
      10 November 2008).

Wechsler, Henry, Jae Eun Lee, John Hall Alexander C. Wagenaar, and Hang Lee. 2002.
      Secondhand Effects of Student Alcohol Use Reported by Neighbors of Colleges: The Role
      of Alcohol Outlets. Social Science and Medicine. 55: 425-435.

Weisberg, Herbert F. 2005. The Total Survey Error Approach: A Guide to the New Science of
      Survey Research. Chicago: The University of Chicago Press.

United States Census Bureau. 2008. Keene, New Hampshire. http://www.census.gov/ (last
       accessed 12 November 2008.)


                                              54
Appendices
Appendix A- South East Keene Survey
Hello! We are from Department of Geography at Keene State College and are working in concert with the South East
Keene Neighborhood Group to conduct a study about your neighborhood. This survey is designed to gain an
understanding of the concerns of you and your neighbors. Results of this study will be presented to the Keene State
College Geography Department, SE Keene Neighborhood Group, and the City of Keene. Your participation in this survey
would be greatly appreciated.

How long have you been a resident of this neighborhood?                  Years              Months

Please Circle:                             Please Circle:

        1. Female                                   1. Home owner

        2. Male                                     2. Renter

How would you rate your overall satisfaction with your neighborhood?

                            1. Poor                 2 . Fair               3. Good            4. Excellent

Is your level of satisfaction with your neighborhood…

         1. Increasing            2. Decreasing         3. Staying the Same           4. Don’t Know/No Opinion

In comparison with the rest of Keene, would you say that the quality of life in your neighborhood is:

        1. Significantly Higher            2. Higher           3. Same           4. Lower      5. Significantly Lower

Please rate the following aspects of life in your neighborhood:

                                         Strongly         Somewhat          No Opinion       Somewhat        Strongly
                                         Agree              Agree                             Disagree       Disagree

1. Litter is a problem
in my neighborhood

2. Drivers obey traffic laws
in my neighborhood

3. Sidewalks are in
good condition

4. I feel safe in my home

5. I feel safe walking at night

6. Alcohol abuse is evident

7. Illegal Drug use is evident

8. Recent changes in the
neighborhood have caused
property values to decline
                                                                                                                        52
Are you a student at Keene State College?       Yes                No


What type of impact do Keene State College students have in your neighborhood?

        1.   Strong Positive      2. Positive         3. Neutral        4. Negative        5. Strong Negative

Do you live in close proximity to college students?

        1. Yes (Immediate neighbors)                      3. Yes (4+ houses away)

        2. Yes (2-3 houses away)                          4. Not in close proximity

In the past five years, or since you have been a resident, have you noticed an increase in the number of college
students living in your neighborhood?

        1. Yes

        2. No

        3. Not Sure


Have you ever called the Police to respond to a disturbance in your neighborhood?

    1. Yes (If yes, how many times?)

    2. No

How would you rate your relationship with your neighbors?

                 1. Poor             2. Fair                 3. Good                  4. Excellent


A past assessment of Keene neighborhoods stated: “there can be no doubt that Keene State (College) is one of the
most valuable facilities in the City and to the southwestern region of N.H. as well.” Do you agree with this statement?

      1. Strongly Agree    2. Somewhat Agree      3.No Opinion          4. Somewhat Disagree         5.Strongly Disagree


Please complete the following sentences:

“The best thing about my neighborhood is…”


“The worst thing about my neighborhood is…”
                                                                                                                      53
Appendices

Appendix B- Housing Assessment tool

Address:______________________________________


   1=Major Problems            2=Minor Problems        3= No Problems


Exterior Structure                            Grade        Comments

Paint                                         ______
Exterior Finishes (wholes/breaks)             ______
House components (missing)                    ______
Windows and doors (glass with cracks)         ______


Roofs

Maintenance                                   ______
Cleanliness                                   ______


Porches and Decks

Stairs                                        ______
Railings (missing, broken)                    ______


Parking

Spaces (adequate)                             ______
Surface                                       ______
Walkways broken or cracked                    ______


Litter/ Landscaping

Litter/garbage                                ______
Dumpster’s                                    ______
Lawns, hedges                                 ______
                                                                        54

More Related Content

Viewers also liked

Enhancing the intranet with gamification
Enhancing the intranet with gamificationEnhancing the intranet with gamification
Enhancing the intranet with gamificationAlex Manchester
 
Planning and development club, November 2016
Planning and development club, November 2016Planning and development club, November 2016
Planning and development club, November 2016Browne Jacobson LLP
 
פרויקט בחוף בת ים
פרויקט בחוף בת יםפרויקט בחוף בת ים
פרויקט בחוף בת יםshartal10
 
Top-Notch Slimmest Smartphones on Earth
Top-Notch Slimmest Smartphones on EarthTop-Notch Slimmest Smartphones on Earth
Top-Notch Slimmest Smartphones on EarthTechAhead
 
Grafico diario del dax perfomance index para el 07 11-2013
Grafico diario del dax perfomance index para el 07 11-2013Grafico diario del dax perfomance index para el 07 11-2013
Grafico diario del dax perfomance index para el 07 11-2013Experiencia Trading
 
Twitter for co p bex lewis & david rush
Twitter for co p   bex lewis & david rushTwitter for co p   bex lewis & david rush
Twitter for co p bex lewis & david rushBex Lewis
 
LUDOPARCIAL - TUTORIAL
LUDOPARCIAL - TUTORIALLUDOPARCIAL - TUTORIAL
LUDOPARCIAL - TUTORIALAníbal Rossi
 
China: kicking the can down the road
China: kicking the can down the roadChina: kicking the can down the road
China: kicking the can down the roadRBS Economics
 
Digital Marketing and Social Personal Media
Digital Marketing and Social Personal MediaDigital Marketing and Social Personal Media
Digital Marketing and Social Personal MediaIb Potter
 
Universidad Nacional de Chimborazo Proyecto de Estadistica
Universidad Nacional de Chimborazo   Proyecto de EstadisticaUniversidad Nacional de Chimborazo   Proyecto de Estadistica
Universidad Nacional de Chimborazo Proyecto de EstadisticaDario Pilco
 

Viewers also liked (15)

Enhancing the intranet with gamification
Enhancing the intranet with gamificationEnhancing the intranet with gamification
Enhancing the intranet with gamification
 
Planning and development club, November 2016
Planning and development club, November 2016Planning and development club, November 2016
Planning and development club, November 2016
 
פרויקט בחוף בת ים
פרויקט בחוף בת יםפרויקט בחוף בת ים
פרויקט בחוף בת ים
 
กรอบไทย
กรอบไทยกรอบไทย
กรอบไทย
 
Top-Notch Slimmest Smartphones on Earth
Top-Notch Slimmest Smartphones on EarthTop-Notch Slimmest Smartphones on Earth
Top-Notch Slimmest Smartphones on Earth
 
Grafico diario del dax perfomance index para el 07 11-2013
Grafico diario del dax perfomance index para el 07 11-2013Grafico diario del dax perfomance index para el 07 11-2013
Grafico diario del dax perfomance index para el 07 11-2013
 
Twitter for co p bex lewis & david rush
Twitter for co p   bex lewis & david rushTwitter for co p   bex lewis & david rush
Twitter for co p bex lewis & david rush
 
OXO Soluitions
OXO SoluitionsOXO Soluitions
OXO Soluitions
 
ECRI INSTITUTE - Monitores Fetales, Parte I
ECRI INSTITUTE - Monitores Fetales, Parte IECRI INSTITUTE - Monitores Fetales, Parte I
ECRI INSTITUTE - Monitores Fetales, Parte I
 
Daily Newsletter: 18th July, 2011
Daily Newsletter: 18th July, 2011Daily Newsletter: 18th July, 2011
Daily Newsletter: 18th July, 2011
 
LUDOPARCIAL - TUTORIAL
LUDOPARCIAL - TUTORIALLUDOPARCIAL - TUTORIAL
LUDOPARCIAL - TUTORIAL
 
China: kicking the can down the road
China: kicking the can down the roadChina: kicking the can down the road
China: kicking the can down the road
 
Digital Marketing and Social Personal Media
Digital Marketing and Social Personal MediaDigital Marketing and Social Personal Media
Digital Marketing and Social Personal Media
 
أحدث اختراعات العالم
أحدث اختراعات العالمأحدث اختراعات العالم
أحدث اختراعات العالم
 
Universidad Nacional de Chimborazo Proyecto de Estadistica
Universidad Nacional de Chimborazo   Proyecto de EstadisticaUniversidad Nacional de Chimborazo   Proyecto de Estadistica
Universidad Nacional de Chimborazo Proyecto de Estadistica
 

Similar to Keene Neighborhood

Workforce Housing in the Monadnock Region
Workforce Housing in the Monadnock RegionWorkforce Housing in the Monadnock Region
Workforce Housing in the Monadnock RegionJenny Darrow
 
Cheshire County Recycling
Cheshire County RecyclingCheshire County Recycling
Cheshire County RecyclingJenny Darrow
 
GEOG309 - Redcliffs Community BEST EVER!!
GEOG309 - Redcliffs Community BEST EVER!!GEOG309 - Redcliffs Community BEST EVER!!
GEOG309 - Redcliffs Community BEST EVER!!Tom Swan
 
Video Conferencing at McBride Secondary School:
Video Conferencing at McBride Secondary School:Video Conferencing at McBride Secondary School:
Video Conferencing at McBride Secondary School:Videoguy
 
Anticipating hot issues and producing timely reports for policy makers
Anticipating hot issues and producing timely reports for policy makersAnticipating hot issues and producing timely reports for policy makers
Anticipating hot issues and producing timely reports for policy makersMerlien Institute
 
case studieson Gentrification and Displacement in the Sa.docx
case studieson Gentrification and Displacement in the Sa.docxcase studieson Gentrification and Displacement in the Sa.docx
case studieson Gentrification and Displacement in the Sa.docxcowinhelen
 
The Effects of Neighborhood Change on New York City Housing Authority Residents
The Effects of Neighborhood Change on New York City Housing Authority ResidentsThe Effects of Neighborhood Change on New York City Housing Authority Residents
The Effects of Neighborhood Change on New York City Housing Authority ResidentsNYCOpportunity
 
Final Document Finished
Final Document Finished Final Document Finished
Final Document Finished Jason Ochalek
 
ReportonOff-CampusStudentPopulation-3
ReportonOff-CampusStudentPopulation-3ReportonOff-CampusStudentPopulation-3
ReportonOff-CampusStudentPopulation-3Anish Patel
 
Case studies on_gentrification_and_displacement-_full_report
Case studies on_gentrification_and_displacement-_full_reportCase studies on_gentrification_and_displacement-_full_report
Case studies on_gentrification_and_displacement-_full_reportRobert StGenis
 
Wndn Marketing Plan 2008 04 21
Wndn Marketing Plan 2008 04 21Wndn Marketing Plan 2008 04 21
Wndn Marketing Plan 2008 04 21ScottStockwell
 
SHS-FD-BUDGET-CONSTRAINTS-OF-SENIOR-HIGH-SCHOOL-IN-CONNECTION-WITH-GACHA-GAME...
SHS-FD-BUDGET-CONSTRAINTS-OF-SENIOR-HIGH-SCHOOL-IN-CONNECTION-WITH-GACHA-GAME...SHS-FD-BUDGET-CONSTRAINTS-OF-SENIOR-HIGH-SCHOOL-IN-CONNECTION-WITH-GACHA-GAME...
SHS-FD-BUDGET-CONSTRAINTS-OF-SENIOR-HIGH-SCHOOL-IN-CONNECTION-WITH-GACHA-GAME...rico482904
 
The Spatial Transformation of Fishing Village Bagan Deli Belawan Medan In Ind...
The Spatial Transformation of Fishing Village Bagan Deli Belawan Medan In Ind...The Spatial Transformation of Fishing Village Bagan Deli Belawan Medan In Ind...
The Spatial Transformation of Fishing Village Bagan Deli Belawan Medan In Ind...AJHSSR Journal
 
PGTDissertation_AchimVonMalotki
PGTDissertation_AchimVonMalotkiPGTDissertation_AchimVonMalotki
PGTDissertation_AchimVonMalotkiAchim von Malotki
 

Similar to Keene Neighborhood (19)

Workforce Housing in the Monadnock Region
Workforce Housing in the Monadnock RegionWorkforce Housing in the Monadnock Region
Workforce Housing in the Monadnock Region
 
Keene Dumpsters
Keene DumpstersKeene Dumpsters
Keene Dumpsters
 
Beaver Brook
Beaver BrookBeaver Brook
Beaver Brook
 
vp.cover
vp.covervp.cover
vp.cover
 
Cheshire County Recycling
Cheshire County RecyclingCheshire County Recycling
Cheshire County Recycling
 
GEOG309 - Redcliffs Community BEST EVER!!
GEOG309 - Redcliffs Community BEST EVER!!GEOG309 - Redcliffs Community BEST EVER!!
GEOG309 - Redcliffs Community BEST EVER!!
 
Video Conferencing at McBride Secondary School:
Video Conferencing at McBride Secondary School:Video Conferencing at McBride Secondary School:
Video Conferencing at McBride Secondary School:
 
Anticipating hot issues and producing timely reports for policy makers
Anticipating hot issues and producing timely reports for policy makersAnticipating hot issues and producing timely reports for policy makers
Anticipating hot issues and producing timely reports for policy makers
 
case studieson Gentrification and Displacement in the Sa.docx
case studieson Gentrification and Displacement in the Sa.docxcase studieson Gentrification and Displacement in the Sa.docx
case studieson Gentrification and Displacement in the Sa.docx
 
Keene Historic Preservation
Keene Historic PreservationKeene Historic Preservation
Keene Historic Preservation
 
The Effects of Neighborhood Change on New York City Housing Authority Residents
The Effects of Neighborhood Change on New York City Housing Authority ResidentsThe Effects of Neighborhood Change on New York City Housing Authority Residents
The Effects of Neighborhood Change on New York City Housing Authority Residents
 
Final Document Finished
Final Document Finished Final Document Finished
Final Document Finished
 
ReportonOff-CampusStudentPopulation-3
ReportonOff-CampusStudentPopulation-3ReportonOff-CampusStudentPopulation-3
ReportonOff-CampusStudentPopulation-3
 
Case studies on_gentrification_and_displacement-_full_report
Case studies on_gentrification_and_displacement-_full_reportCase studies on_gentrification_and_displacement-_full_report
Case studies on_gentrification_and_displacement-_full_report
 
2
22
2
 
Wndn Marketing Plan 2008 04 21
Wndn Marketing Plan 2008 04 21Wndn Marketing Plan 2008 04 21
Wndn Marketing Plan 2008 04 21
 
SHS-FD-BUDGET-CONSTRAINTS-OF-SENIOR-HIGH-SCHOOL-IN-CONNECTION-WITH-GACHA-GAME...
SHS-FD-BUDGET-CONSTRAINTS-OF-SENIOR-HIGH-SCHOOL-IN-CONNECTION-WITH-GACHA-GAME...SHS-FD-BUDGET-CONSTRAINTS-OF-SENIOR-HIGH-SCHOOL-IN-CONNECTION-WITH-GACHA-GAME...
SHS-FD-BUDGET-CONSTRAINTS-OF-SENIOR-HIGH-SCHOOL-IN-CONNECTION-WITH-GACHA-GAME...
 
The Spatial Transformation of Fishing Village Bagan Deli Belawan Medan In Ind...
The Spatial Transformation of Fishing Village Bagan Deli Belawan Medan In Ind...The Spatial Transformation of Fishing Village Bagan Deli Belawan Medan In Ind...
The Spatial Transformation of Fishing Village Bagan Deli Belawan Medan In Ind...
 
PGTDissertation_AchimVonMalotki
PGTDissertation_AchimVonMalotkiPGTDissertation_AchimVonMalotki
PGTDissertation_AchimVonMalotki
 

More from Jenny Darrow

The Higher Education Landscape
The Higher Education LandscapeThe Higher Education Landscape
The Higher Education LandscapeJenny Darrow
 
Academic Plan 2009 2014
Academic Plan 2009 2014Academic Plan 2009 2014
Academic Plan 2009 2014Jenny Darrow
 
Academic Plan Executive Summary 091709
Academic Plan Executive Summary 091709Academic Plan Executive Summary 091709
Academic Plan Executive Summary 091709Jenny Darrow
 
DRAFT Academic Plan 2009 2014 091709
DRAFT Academic Plan 2009 2014 091709DRAFT Academic Plan 2009 2014 091709
DRAFT Academic Plan 2009 2014 091709Jenny Darrow
 
2009 Academic Affairs Meeting Slides
2009 Academic Affairs Meeting Slides2009 Academic Affairs Meeting Slides
2009 Academic Affairs Meeting SlidesJenny Darrow
 
Milford Housing Project
Milford Housing ProjectMilford Housing Project
Milford Housing ProjectJenny Darrow
 
Academic Plan 2009 2014 041309 Draft
Academic Plan 2009 2014 041309 DraftAcademic Plan 2009 2014 041309 Draft
Academic Plan 2009 2014 041309 DraftJenny Darrow
 
Academic Plan 2009 2014 041309 Draft
Academic Plan 2009 2014 041309 DraftAcademic Plan 2009 2014 041309 Draft
Academic Plan 2009 2014 041309 DraftJenny Darrow
 
Academic Plan 2009 2014 041309 Draft
Academic Plan 2009 2014 041309 DraftAcademic Plan 2009 2014 041309 Draft
Academic Plan 2009 2014 041309 DraftJenny Darrow
 
Academic Plan 2009 2014 041309 Draft
Academic Plan 2009 2014 041309 DraftAcademic Plan 2009 2014 041309 Draft
Academic Plan 2009 2014 041309 DraftJenny Darrow
 
Keene State College Academic Affairs Technology Plan 111808
Keene State College Academic Affairs Technology Plan 111808Keene State College Academic Affairs Technology Plan 111808
Keene State College Academic Affairs Technology Plan 111808Jenny Darrow
 
2008 AT/IT Summit Assessment Results
2008 AT/IT Summit Assessment Results2008 AT/IT Summit Assessment Results
2008 AT/IT Summit Assessment ResultsJenny Darrow
 
Overcoming A Culture Of Technology
Overcoming A Culture Of TechnologyOvercoming A Culture Of Technology
Overcoming A Culture Of TechnologyJenny Darrow
 

More from Jenny Darrow (17)

The Higher Education Landscape
The Higher Education LandscapeThe Higher Education Landscape
The Higher Education Landscape
 
Academic Plan 2009 2014
Academic Plan 2009 2014Academic Plan 2009 2014
Academic Plan 2009 2014
 
Academic Plan Executive Summary 091709
Academic Plan Executive Summary 091709Academic Plan Executive Summary 091709
Academic Plan Executive Summary 091709
 
DRAFT Academic Plan 2009 2014 091709
DRAFT Academic Plan 2009 2014 091709DRAFT Academic Plan 2009 2014 091709
DRAFT Academic Plan 2009 2014 091709
 
2009 Academic Affairs Meeting Slides
2009 Academic Affairs Meeting Slides2009 Academic Affairs Meeting Slides
2009 Academic Affairs Meeting Slides
 
Milford Housing Project
Milford Housing ProjectMilford Housing Project
Milford Housing Project
 
Milford Housing
Milford HousingMilford Housing
Milford Housing
 
Vernal Pools
Vernal PoolsVernal Pools
Vernal Pools
 
PoèMe Finale
PoèMe FinalePoèMe Finale
PoèMe Finale
 
Academic Plan 2009 2014 041309 Draft
Academic Plan 2009 2014 041309 DraftAcademic Plan 2009 2014 041309 Draft
Academic Plan 2009 2014 041309 Draft
 
Academic Plan 2009 2014 041309 Draft
Academic Plan 2009 2014 041309 DraftAcademic Plan 2009 2014 041309 Draft
Academic Plan 2009 2014 041309 Draft
 
Academic Plan 2009 2014 041309 Draft
Academic Plan 2009 2014 041309 DraftAcademic Plan 2009 2014 041309 Draft
Academic Plan 2009 2014 041309 Draft
 
Academic Plan 2009 2014 041309 Draft
Academic Plan 2009 2014 041309 DraftAcademic Plan 2009 2014 041309 Draft
Academic Plan 2009 2014 041309 Draft
 
Keene State College Academic Affairs Technology Plan 111808
Keene State College Academic Affairs Technology Plan 111808Keene State College Academic Affairs Technology Plan 111808
Keene State College Academic Affairs Technology Plan 111808
 
2008 AT/IT Summit Assessment Results
2008 AT/IT Summit Assessment Results2008 AT/IT Summit Assessment Results
2008 AT/IT Summit Assessment Results
 
Overcoming A Culture Of Technology
Overcoming A Culture Of TechnologyOvercoming A Culture Of Technology
Overcoming A Culture Of Technology
 
TEST for MSMITH
TEST for MSMITHTEST for MSMITH
TEST for MSMITH
 

Recently uploaded

Capitol Tech U Doctoral Presentation - April 2024.pptx
Capitol Tech U Doctoral Presentation - April 2024.pptxCapitol Tech U Doctoral Presentation - April 2024.pptx
Capitol Tech U Doctoral Presentation - April 2024.pptxCapitolTechU
 
Full Stack Web Development Course for Beginners
Full Stack Web Development Course  for BeginnersFull Stack Web Development Course  for Beginners
Full Stack Web Development Course for BeginnersSabitha Banu
 
Framing an Appropriate Research Question 6b9b26d93da94caf993c038d9efcdedb.pdf
Framing an Appropriate Research Question 6b9b26d93da94caf993c038d9efcdedb.pdfFraming an Appropriate Research Question 6b9b26d93da94caf993c038d9efcdedb.pdf
Framing an Appropriate Research Question 6b9b26d93da94caf993c038d9efcdedb.pdfUjwalaBharambe
 
ECONOMIC CONTEXT - PAPER 1 Q3: NEWSPAPERS.pptx
ECONOMIC CONTEXT - PAPER 1 Q3: NEWSPAPERS.pptxECONOMIC CONTEXT - PAPER 1 Q3: NEWSPAPERS.pptx
ECONOMIC CONTEXT - PAPER 1 Q3: NEWSPAPERS.pptxiammrhaywood
 
Introduction to AI in Higher Education_draft.pptx
Introduction to AI in Higher Education_draft.pptxIntroduction to AI in Higher Education_draft.pptx
Introduction to AI in Higher Education_draft.pptxpboyjonauth
 
Organic Name Reactions for the students and aspirants of Chemistry12th.pptx
Organic Name Reactions  for the students and aspirants of Chemistry12th.pptxOrganic Name Reactions  for the students and aspirants of Chemistry12th.pptx
Organic Name Reactions for the students and aspirants of Chemistry12th.pptxVS Mahajan Coaching Centre
 
Software Engineering Methodologies (overview)
Software Engineering Methodologies (overview)Software Engineering Methodologies (overview)
Software Engineering Methodologies (overview)eniolaolutunde
 
Incoming and Outgoing Shipments in 1 STEP Using Odoo 17
Incoming and Outgoing Shipments in 1 STEP Using Odoo 17Incoming and Outgoing Shipments in 1 STEP Using Odoo 17
Incoming and Outgoing Shipments in 1 STEP Using Odoo 17Celine George
 
History Class XII Ch. 3 Kinship, Caste and Class (1).pptx
History Class XII Ch. 3 Kinship, Caste and Class (1).pptxHistory Class XII Ch. 3 Kinship, Caste and Class (1).pptx
History Class XII Ch. 3 Kinship, Caste and Class (1).pptxsocialsciencegdgrohi
 
Final demo Grade 9 for demo Plan dessert.pptx
Final demo Grade 9 for demo Plan dessert.pptxFinal demo Grade 9 for demo Plan dessert.pptx
Final demo Grade 9 for demo Plan dessert.pptxAvyJaneVismanos
 
MARGINALIZATION (Different learners in Marginalized Group
MARGINALIZATION (Different learners in Marginalized GroupMARGINALIZATION (Different learners in Marginalized Group
MARGINALIZATION (Different learners in Marginalized GroupJonathanParaisoCruz
 
Enzyme, Pharmaceutical Aids, Miscellaneous Last Part of Chapter no 5th.pdf
Enzyme, Pharmaceutical Aids, Miscellaneous Last Part of Chapter no 5th.pdfEnzyme, Pharmaceutical Aids, Miscellaneous Last Part of Chapter no 5th.pdf
Enzyme, Pharmaceutical Aids, Miscellaneous Last Part of Chapter no 5th.pdfSumit Tiwari
 
CELL CYCLE Division Science 8 quarter IV.pptx
CELL CYCLE Division Science 8 quarter IV.pptxCELL CYCLE Division Science 8 quarter IV.pptx
CELL CYCLE Division Science 8 quarter IV.pptxJiesonDelaCerna
 
Crayon Activity Handout For the Crayon A
Crayon Activity Handout For the Crayon ACrayon Activity Handout For the Crayon A
Crayon Activity Handout For the Crayon AUnboundStockton
 
Interactive Powerpoint_How to Master effective communication
Interactive Powerpoint_How to Master effective communicationInteractive Powerpoint_How to Master effective communication
Interactive Powerpoint_How to Master effective communicationnomboosow
 
How to Make a Pirate ship Primary Education.pptx
How to Make a Pirate ship Primary Education.pptxHow to Make a Pirate ship Primary Education.pptx
How to Make a Pirate ship Primary Education.pptxmanuelaromero2013
 
POINT- BIOCHEMISTRY SEM 2 ENZYMES UNIT 5.pptx
POINT- BIOCHEMISTRY SEM 2 ENZYMES UNIT 5.pptxPOINT- BIOCHEMISTRY SEM 2 ENZYMES UNIT 5.pptx
POINT- BIOCHEMISTRY SEM 2 ENZYMES UNIT 5.pptxSayali Powar
 
Computed Fields and api Depends in the Odoo 17
Computed Fields and api Depends in the Odoo 17Computed Fields and api Depends in the Odoo 17
Computed Fields and api Depends in the Odoo 17Celine George
 
“Oh GOSH! Reflecting on Hackteria's Collaborative Practices in a Global Do-It...
“Oh GOSH! Reflecting on Hackteria's Collaborative Practices in a Global Do-It...“Oh GOSH! Reflecting on Hackteria's Collaborative Practices in a Global Do-It...
“Oh GOSH! Reflecting on Hackteria's Collaborative Practices in a Global Do-It...Marc Dusseiller Dusjagr
 

Recently uploaded (20)

Capitol Tech U Doctoral Presentation - April 2024.pptx
Capitol Tech U Doctoral Presentation - April 2024.pptxCapitol Tech U Doctoral Presentation - April 2024.pptx
Capitol Tech U Doctoral Presentation - April 2024.pptx
 
Full Stack Web Development Course for Beginners
Full Stack Web Development Course  for BeginnersFull Stack Web Development Course  for Beginners
Full Stack Web Development Course for Beginners
 
Framing an Appropriate Research Question 6b9b26d93da94caf993c038d9efcdedb.pdf
Framing an Appropriate Research Question 6b9b26d93da94caf993c038d9efcdedb.pdfFraming an Appropriate Research Question 6b9b26d93da94caf993c038d9efcdedb.pdf
Framing an Appropriate Research Question 6b9b26d93da94caf993c038d9efcdedb.pdf
 
ECONOMIC CONTEXT - PAPER 1 Q3: NEWSPAPERS.pptx
ECONOMIC CONTEXT - PAPER 1 Q3: NEWSPAPERS.pptxECONOMIC CONTEXT - PAPER 1 Q3: NEWSPAPERS.pptx
ECONOMIC CONTEXT - PAPER 1 Q3: NEWSPAPERS.pptx
 
Introduction to AI in Higher Education_draft.pptx
Introduction to AI in Higher Education_draft.pptxIntroduction to AI in Higher Education_draft.pptx
Introduction to AI in Higher Education_draft.pptx
 
Organic Name Reactions for the students and aspirants of Chemistry12th.pptx
Organic Name Reactions  for the students and aspirants of Chemistry12th.pptxOrganic Name Reactions  for the students and aspirants of Chemistry12th.pptx
Organic Name Reactions for the students and aspirants of Chemistry12th.pptx
 
Software Engineering Methodologies (overview)
Software Engineering Methodologies (overview)Software Engineering Methodologies (overview)
Software Engineering Methodologies (overview)
 
Incoming and Outgoing Shipments in 1 STEP Using Odoo 17
Incoming and Outgoing Shipments in 1 STEP Using Odoo 17Incoming and Outgoing Shipments in 1 STEP Using Odoo 17
Incoming and Outgoing Shipments in 1 STEP Using Odoo 17
 
History Class XII Ch. 3 Kinship, Caste and Class (1).pptx
History Class XII Ch. 3 Kinship, Caste and Class (1).pptxHistory Class XII Ch. 3 Kinship, Caste and Class (1).pptx
History Class XII Ch. 3 Kinship, Caste and Class (1).pptx
 
Final demo Grade 9 for demo Plan dessert.pptx
Final demo Grade 9 for demo Plan dessert.pptxFinal demo Grade 9 for demo Plan dessert.pptx
Final demo Grade 9 for demo Plan dessert.pptx
 
MARGINALIZATION (Different learners in Marginalized Group
MARGINALIZATION (Different learners in Marginalized GroupMARGINALIZATION (Different learners in Marginalized Group
MARGINALIZATION (Different learners in Marginalized Group
 
Enzyme, Pharmaceutical Aids, Miscellaneous Last Part of Chapter no 5th.pdf
Enzyme, Pharmaceutical Aids, Miscellaneous Last Part of Chapter no 5th.pdfEnzyme, Pharmaceutical Aids, Miscellaneous Last Part of Chapter no 5th.pdf
Enzyme, Pharmaceutical Aids, Miscellaneous Last Part of Chapter no 5th.pdf
 
CELL CYCLE Division Science 8 quarter IV.pptx
CELL CYCLE Division Science 8 quarter IV.pptxCELL CYCLE Division Science 8 quarter IV.pptx
CELL CYCLE Division Science 8 quarter IV.pptx
 
OS-operating systems- ch04 (Threads) ...
OS-operating systems- ch04 (Threads) ...OS-operating systems- ch04 (Threads) ...
OS-operating systems- ch04 (Threads) ...
 
Crayon Activity Handout For the Crayon A
Crayon Activity Handout For the Crayon ACrayon Activity Handout For the Crayon A
Crayon Activity Handout For the Crayon A
 
Interactive Powerpoint_How to Master effective communication
Interactive Powerpoint_How to Master effective communicationInteractive Powerpoint_How to Master effective communication
Interactive Powerpoint_How to Master effective communication
 
How to Make a Pirate ship Primary Education.pptx
How to Make a Pirate ship Primary Education.pptxHow to Make a Pirate ship Primary Education.pptx
How to Make a Pirate ship Primary Education.pptx
 
POINT- BIOCHEMISTRY SEM 2 ENZYMES UNIT 5.pptx
POINT- BIOCHEMISTRY SEM 2 ENZYMES UNIT 5.pptxPOINT- BIOCHEMISTRY SEM 2 ENZYMES UNIT 5.pptx
POINT- BIOCHEMISTRY SEM 2 ENZYMES UNIT 5.pptx
 
Computed Fields and api Depends in the Odoo 17
Computed Fields and api Depends in the Odoo 17Computed Fields and api Depends in the Odoo 17
Computed Fields and api Depends in the Odoo 17
 
“Oh GOSH! Reflecting on Hackteria's Collaborative Practices in a Global Do-It...
“Oh GOSH! Reflecting on Hackteria's Collaborative Practices in a Global Do-It...“Oh GOSH! Reflecting on Hackteria's Collaborative Practices in a Global Do-It...
“Oh GOSH! Reflecting on Hackteria's Collaborative Practices in a Global Do-It...
 

Keene Neighborhood

  • 1. December 2008 New Kids on the Block: An Analysis of Student Housing Trends in Southeast Keene, New Hampshire JAMES CUNNIINGHAM AMES UNN NGHAM VANESSA CIIARLEGLIIO ANESSA ARLEGL O LIINDSAY LAMBERT NDSAY AMBERT HEATHER SOULARD EATHER OULARD Keene State College Department of Geography Faculty Sponsor: Dr. Christopher Cusack
  • 2. First, we would like to thank the entire Geography department; Dr. K. Alvarez, Dr. K Bayr, Professor T. Miller, Dr. Jo Beth Mullens and Dr. Al Rydant who have helped shape our education to this point. With a special thanks to Dr. Christopher Cusack who has spent countless hours working with us on this project and many other projects preparing us for life after college. The Department of Geography and its faculty represent an extraordinary element of Keene State College which leaves a lasting impression on every student who passes through it. We would like to thank Dan Curran and Dave Curran, for allowing us to attend meetings and giving us insight on what was happening within the Southeast Keene neighborhood. We would like to acknowledge and thank Will Schoefmann, of the Keene Planning Department, for supplying us with the Keene parcel data from which we based most of our maps. Also, thank you to Medard Kopczynski, Assistant City Manager/Health Director of Keene, New Hampshire, for providing the group with the Code Enforcements for the City of Keene. Additional appreciation to Laura Thibodeau, CNHA, City Assessor, for supplying assessed values for property parcels. Great thanks to Dr. Andrew Robinson, Vice President of Student Affairs at Keene State College, for taking the time to meet with us and providing information pertinent to the college’s growth rate and student living. Thank you Cristi Carson, from the Office of Institutional Research at Keene State College, for all of the factual information pertaining to the college and as well as KSC college demographics retained from previous years from the Keene State College Fact Books. We greatly appreciate Sherry Huntley from KSC Registrars office for providing off- campus student housing locations. Additional thanks to our Senior Seminar class, it has been a pleasure meeting and working with all of you! To anyone we may have missed, your help with making this project a success was not dismissed. Thank you. ii
  • 3. TABLE OF CONTENTS Acknowledgments ii List of Figures v List of Tables vi Abstract 1 Chapter 1 Introduction 1 Central Questions 2 Hypothesis 4 Chapter 2 Neighborhood Contextualized 6 Neighborhood Change 7 College Towns 10 Student Behavior 11 Physical Characteristics of Student Housing 14 Chapter 3 Location of Keene, New Hampshire 15 Keene State College Background 17 Southeast Keene Neighborhood Change 19 Response to Change 21 iii
  • 4. Chapter 4 Methods 26 Survey Methodology 26 Survey Results 32 Chapter 5 Housing Assessment Methodologies 40 Results 44 Chapter 6 Limitations 46 Conclusions 47 iv
  • 5. LIST OF FIGURES Figures 1. Southeast Keene Neighborhood 3 2. Stages of Neighborhood Change 8 3. Demographic distribution shown in Percentages 17 4. Total Fall Headcount Student Enrollment , Years 2001-2007 18 5. Survey Responses Pertaining to KSC’s Perceived Value to the Community 18 6. Number of families per Household 2001 to 2008 20 7. Student Households in Southeast Keene Neighborhood 21 8. Building Code Violations 24 9. Locations of Surveyed Residents 28 10. Surveys Being Distributed 29 11. Total Months of Residency for non-students and students 34 12. Housing Assessment Properties 40 13. Assessed Housing Externalities 41 14. Assessed Parking Conditions 42 15. Negative Items on Properties 42 16. Student and Non-Student Housing 44 v
  • 6. LIST OF TABLES Tables 1. Keene New Hampshire 5 Largest Businesses 16 2. Correlation Between Satisfaction Levels and Relationship with Neighbors 35 3. Keene, New Hampshire Property Values 2001 to 2008 38 vi
  • 7. Abstract This study has illuminated a wealth of information regarding the social and physical implications of Keene State College students living off campus in Keene, New Hampshire. Drawing on secondary research; this study has provided context in order to understand the concepts of ‘town and gown’ relationships. Primary research has revealed several significant social and physical differences between the two major demographics of study, students and non-student residents. Students have been categorized as being generally unconcerned with the social fiber or physical condition of their neighborhood. Students generally do not feel as connected to the community as do local residents. Local residents tend to view student housing, and students in general, as having negative connotations and detrimental effects on their neighborhood. Spatial trends have been identified in student housing and displayed using Geographic Information Systems. It is predictable that student housing is going to increase in Southeast Keene as well as the entire city. If nothing is done to rectify this situation, the social fabric that makes up Southeast Keene may continue to deteriorate. Southeast Keene may become like other student dominated areas of the city and other cities where rental housing is predominant. This will force stable residential neighborhoods further from downtown Keene which is one of the most valued aspects of the neighborhood. Drawing on past studies of neighborhood decline and successful neighborhood revitalization efforts; this study concludes with an outlook to the future of Southeast Keene. Chapter 1 Introduction Neighborhoods exist in every town and city and all neighborhoods experience change over time. These changes are caused by a multitude of reasons and are manifested with many different characteristics. Neighborhood lifecycles are generally thought of in two terms, decline or revitalization. This is a case study of Keene, New Hampshire (NH) where a demographic shift is taking place and changing the neighborhoods that are valued by local residents. The demographic shift of focus is the increasing presence of 18-24 year old males and females. The 1
  • 8. increase in this age group can be attributed to the presence of Keene State College which is home to 5,443 students; 40 percent of whom do not live on campus (2007 data). This remaining 40 percent of the student population either commutes from an outside town or city or lives within the community. Students living off campus are having an effect on the areas in which they live and an effect on the residents among whom they live. This study is a spatial analysis of a specific neighborhood in Keene which is currently experiencing change attributed to the effects of student housing. The neighborhood in question is referred to as Southeast Keene. The term Southeast Keene should be thought of as a general area without definite borders. The neighborhood can generally be demarcated by city streets. The northern edge of the neighborhood is bounded by Water Street to the North; to the East by Grove and Marlboro Street; to the South by State Route 101 and to the West by Main Street (Figure 1). Central Questions First, this study provides a definition of the term neighborhood as it is contextualized in this study and other studies. Any analysis of a neighborhood cannot be completed without a functional definition of the term because it can have different meanings in different contexts. Why are student households of concern? To answer this question, an analysis of common concerns residents have with student housing is provided, along with an analysis of student lifestyles and common features associated with student households and student occupied communities. 2
  • 9. Figure 1 Southeast Keene Neighborhood 3
  • 10. This study intends to provide a spatial analysis of the trends in student housing patterns; specifically, why are students living off campus and where in the neighborhood are they living? This study will gauge attitudes of residents as to the impact students have on their neighborhood and their lives. This study will attempt to identify what effects, if any, living in close proximity to student households have on residents, of Southeast Keene. Hypotheses A series of spatial and statistical trends are expected to become evident through this study. Using survey results through primary data collection, it is probable that residents who live in closest proximity to student households will have significantly lower satisfaction rates as well as poorer reported relationships with their neighbors. It is expected that residents in close proximity to student households will report contacting the police, about disturbances in their neighborhood, more so than other residents. It is likely that residents who have lived in the neighborhood for the longest periods of time will have likely seen the largest amount of change within their neighborhood. A correlation can be expected between length of residency and satisfaction levels, negative student impacts, and police contacts. Residents and students in the neighborhood will rate different aspects of their neighborhood much differently when it comes to issues such as, litter, traffic, safety, substance abuse, and property values. Residents will be prone to having much stronger opinions about these matters. Using data collected with a housing quality assessment; student properties will likely have more maintenance issues that owner occupied housing units. Using City Planning data, it is expected that Southeast Keene’s property values have increased less when compared to the city averages from the years 2001 to 4
  • 11. 2008. Multifamily housing units are also likely to have significantly increased in the neighborhood from 2001 to 2008. 5
  • 12. Chapter Two Neighborhoods Contextualized Any analysis of a neighborhood must take into account the fact that neighborhoods have ambiguous borders and are difficult to define. Neighborhoods are not demarcated by street signs, they cannot be found on road maps, they are not solely government jurisdictions, school districts, or voting districts. Neighborhoods may be defined differently by people who live within the same city block. One such definition describes neighborhoods as clusters of residents with similar spatially based attributes (Galster 2001). This is an accurate definition in that neighborhoods are spatial groupings of people, but it implies that any residential grouping of people can be considered a neighborhood, from the largest city to the smallest town. That definition can be problematic because neighborhoods are subsections of larger communities (Sampson et al. 2000). Neighborhoods are often informally recognized dividers that exist in larger urban areas. Residents of these areas feel a stronger connection to the smaller area in which they live than the city as a whole (Logan and Collver 1984). Neighborhoods, however, are not solely spatial groupings of people in close proximity to one another. Defining neighborhoods in solely spatial terms disregards the social dynamic that makes up the fabric neighborhoods. Neighborhoods should be thought of as an area that can expand and shrink depending on contexts and personal experiences of those who live there (Sastry et al. 2002). The amorphous nature of neighborhoods is displayed well in a study that employs statistics to gauge peoples’ perceptions of their neighborhood. This study involved 612 residents of Nashville, Tennessee, who were surveyed as to the limits of their neighborhood as 6
  • 13. measured in city blocks. The average perceived size was 19.1 city blocks; the standard deviation, however, was more than three times that magnitude at 71.1 city blocks (Lee 2001). This displays the vast discrepancy in the range of peoples’ perceptions of scale pertaining to neighborhoods. Neighborhoods exist in the attitudes and social connections of the residents in the community. In other studies, neighborhoods have been categorized solely in demographic terms. This means that people will more closely identify with neighbors and neighborhoods that are composed of people who are racially, economically, and close in age, to themselves (Banerjee and Baer 1984; Logan and Collver 1984; Lee and Campbell 1997). If people will form bonds more easily with people of similar demographics then it is feasible that neighborhoods can be perceived along demographic boundaries. This means that communities with similar demographics will likely have a higher level of neighborhood cohesion and can more easily distinguish the limits of their own neighborhood. Neighborhood Change Neighborhoods have lifecycles much like living organisms. Unlike living organisms, however, neighborhoods do not follow a set path of growth, decline and eventual death like organisms. Neighborhoods can decline and revitalize many times with no death or end occurring (Figure 2). 7
  • 14. Stable neighborhood; Long term residency, strong community ties, high home Stable neighborhood; ownership, high income. Young families, high ...stable property values, income, strong community ties, high ownership rates. properties well maintained. Minor Decline; Out migration, minor physical Strongly revitalized deterioration, small neighborhood; Increasing increase in rental home ownership rates, Low properties. crime rates, strong community ties. Obvious decline; Increased rental housing, physical deterioration is evident and Full revitalization efforts; unattended to. Rising crime Strong community and vandalism. organization, strong public and private investment in properties and housing. Heavily deteriorated; Predominantly rental housing, very low average income, most Revitalizing neighborhood; housing units require major Properties are being repairs, high crime rates. renovated; public and private spaces are beginning revitalization. Unhealthy neighborhood Lowest socio-economic residents, housing units Early revitalization; Community dilapidated, very high crime groups are formed, government rates, housing assistance available, police are active in response to slum-like abandonment common, conditions. High vacancy rates. Figure 2 Stages of Neighborhood Change 8
  • 15. It has been hypothesized that friendships and local acquaintances increase social cohesion and a person’s level of commitment to a neighborhood (Sampson 1991). When people feel connected to their neighbors and neighborhood a very stable community develops. Stable neighborhoods have many different characteristics that separate them from other neighborhoods and make them very desirable places in which to live. In a stable neighborhood residents tend to have lived there for a long time, there is little outmigration of residents and little or no transient population. Properties tend to be well maintained in stable neighborhoods as people tend to take more pride in their homes and properties which encourages other residents to follow suit and keep up with maintenance (Doran and Lees 2005). In a stable neighborhood; the majority of residents live in owner occupied single family homes and the neighborhood has a high average income relative to the surrounding communities (Metzger 2000). When residents begin to feel little connection with their neighbors, people will have little connection to their neighborhood. This lack of social integration often results in neighborhood decline; a physical and social deterioration of a neighborhood. When neighborhoods decline several common characteristics occur. Out migration occurs; long time residents will move to more desirable communities. During decline stages, rental properties become more prevalent. Crime rates rise and lower income residents move into the neighborhood. Renters and low-income home owners often cannot or do not maintain their properties as do higher income residents (Baxter and Laurie 2002; Lucy and Phelps 2000). 9
  • 16. Homes and properties become run-down and litter and garbage become evident and unattended to; abandonment is also common at this lowest stage of decline (Skogan 1990). College Towns The relationship between college students and local residents, in urban areas where a college or university exists, has been referred to as ‘town-gown’ relations (Gumprecht 2003; Kenyon 1997; Nichols 1990). Town-gown relationships and strains are not unique to contemporary institutes of higher education. Clashes, sometimes violent, have been recorded back to medieval London, England, where Oxford and Cambridge students often clashed with local residents (Kenyon 1997; Mansfield 1993). Early American educational institutes dealt with similar issues when Yale students violently clashed with local New Haven firefighters in the early 19th century (Nichols 1990). More recently these troubles persist; a dispute over access to public space took place in Boulder, Colorado, between local youths and University of Colorado students. A large brawl broke out leaving one student seriously injured (Staeheli 1997). College students are accompanied by a lifestyle and culture that is unique to the urban environment. One fundamental difference that exists is the transient nature of college students. College students traditionally spend four years at a college while earning a bachelor’s degree. However, students rarely spend the entire four years in one urban setting. The academic calendar year is littered with vacations and breaks between semesters when students often return to their hometowns. In Southeast Keene, students have been residents for a significantly less amount of time compared to home owning residents. Surveyed students have an average length of residency of less than one year, (11.6 months) whereas surveyed homeowners have 10
  • 17. an average residency of 17.2 years. As a result, students do not feel the same level connection to an area as do the residents who have lived in an area for an extended period of time because the length of residency tends to correlate to the level of connection to a residential area (Sampson 1991). Student housing patterns shift yearly and even monthly; making the neighborhoods in which they live considerably less stable. Neighbors tend not to interact with neighbors who are considered temporary, which disrupts the social cohesion of the neighborhood (Kenyon 1997). Student Behavior Student behaviors can indubitably have negative effects on neighborhoods. Substance abuse among college students is prevalent. Substance abuse is characterized by overindulgence in and dependence on drugs and or alcohol leading to effects detrimental to an individual’s mental and physical welfare (Gahlinger 2004). Studies reveal that college students tend to consume alcohol at a greater rate than do many other demographics. An ongoing concern of many college administrations is how to respond to student alcohol consumption. Some argue that tough campus alcohol restrictions will reduce consumption. However, tough drinking rules often drive alcohol consumption off campus and into surrounding communities which leads to many concerned local residents. Many parents become concerned with the younger populations’ exposure to the negative effects of alcohol abuse. A recent study was conducted to estimate the number of alcohol consumers by age group per state. For the state of New Hampshire, an estimated 98,000 individuals were characterized as consuming more than five alcoholic beverages per week (National Center for Health Statistics 2005). According 11
  • 18. to the national alcohol and drug abuse association, a drink is considered to be one twelve ounce beer, one eight ounce glass of wine, wine cooler, or a one ounce shot of liquor (Gahlinger 2003). Drawing on survey results, 53.1 percent of surveyed homeowners report alcohol abuse being evident. Similar studies suggest that a third of college students consume more alcohol than is safe, which constitutes alcohol abuse (Sells and Robson 1998). This reinforces literature contending that alcohol has significant effects on neighborhoods (Sampson et al 2002). Comprehensive community interventions that bring several departments of city government together with concerned private citizens or organizations have been shown to reduce drinking or alcohol related problems (Hingson 1998). On college campuses, efforts to identify and change the behavior of high risk drinking have taken root at many institutions across the United States. For these intervention and prevention plans to succeed, complete agreement from campus officials and community members is mandatory. It is feasible that stringent campus policies drive drinkers into the community. Underage drinking brings with it many other complications. Aside from mental and physical damage, overindulgence in alcohol can result in fatal motor vehicle crashes, drowning, homicide, suicide, and or alcohol and drug related overdoses to name a few (Gahlinger 2003). According to a recent report on alcohol statistics, traffic crashes are the leading cause of death in the United States for people younger than age twenty–five (Hingson 1998). Although laws prohibiting sale and provision of alcohol to minors have reduced alcohol related traffic deaths, many students report receiving alcohol from family members and friends. Minor complications arise from drinking such as missing class, incomplete homework assignments, and hangovers to 12
  • 19. name a few. Difficulty meeting academic responsibilities is one of the most common consequences of alcohol use among college students. Another study suggests that two in five college students are considered ‘binge-drinkers’ meaning they consume considerably more alcohol than is considered healthy (Wechsler et al. 2002). Binge drinking is distinguished as males consuming more than five drinks in one sitting and females consuming more than four drinks in one sitting. In the early 1990’s binge drinking gained national recognition as the number one public health problem affecting college students (Robson and Sell 1998). Statistics also show that on nearly any college campus, 70 percent of the student body participates in binge drinking. Out of that 70 percent, nearly half of them binge more than once a week. Nearly half of the college binge drinkers have five or more alcohol-related problems on campus. They may be caught by authorities, or they may partake in vandalism and other destructive and violent acts (Brower and Carroll 2007; Copeland 2003). College students give many reasons as to why they partake in excessive drinking. Many explain how alcohol enhances social activity, allows people to have more fun, breaks the ice, facilitates connection with peers, and makes it easier to deal with stress (Robson and Sell 1998). For many students, college represents their first experiences away from home and away from adult supervision, hence experimentation with alcohol and drugs is an acceptable behavior among peers at most college campuses. Physical Characteristics of Student Housing College students bring with them many physical characteristics that carry negative connotations and promote a negative view of students in the community. A premier 13
  • 20. characteristic concerning residents is student housing. With an influx of student residents comes an influx of rental properties. Many people see the student migration as an economic opportunity to turn residential homes into rental properties (Gopal 2008). These landlords and students have very little incentive to maintain their properties at a high quality often to the dismay of their neighbors. Dilapidated rental properties are often viewed as having a negative influence on the property values of the surrounding structures. Poor housing and property quality can tend to have similar spiraling negative effects on the surrounding properties. Negative externalities can spread to other properties as residents notice the lack of their neighbors general maintenance efforts can affect the maintenance of ones own property (Doran and Lees 2006). There are also safety concerns of unmaintained properties. Many do not like the idea of students living in unsafe conditions, and those safety concerns can spread to surrounding properties, such as fires. Unmaintained and unsecure housing can also invite burglaries and other criminal activity associated with student housing (Kenyon 1997). 14
  • 21. Chapter 3 Keene, New Hampshire Keene is located in southern New Hampshire, geographically situated centrally in Cheshire County, which in total includes 23 towns. Among the more predominantly known towns of Cheshire County are Keene, Jaffrey, Dublin and Alstead. Cheshire County is also one of the ten counties that comprise New Hampshire (Mensch 2001). The average income per household in 2004 for New Hampshire residents is $57,352.00, whereas the average income for Keene residents was $49,935. There exist a large number of non-family households in Keene. In 1999, 758 non-family household made less than $10,000. This is significantly lower than the average income for Keene residents. It is very likely that many of these non-family/low income households are occupied by students. The largest economic factors pertaining to the City of Keene are related to business and employment. Keene has a labor force of 14,032 people. Table 1 provides the five largest employers of Keene of which Keene State College ranks number three with, 707 current employees (US Census Bureau). By providing over 700 people with jobs, KSC is obviously economically valuable to the city of Keene (New Hampshire Employment 2007). The economic impact of Keene State College has created many additional jobs to residents of Cheshire County. During the fiscal year 2005, Keene State College bought nearly 28 million dollars worth of goods and services, and provided more than 557 jobs to residents of Cheshire County (Carson 2006). As the economic growth of Keene persists into the 2000’s, Keene State College continues to expand its campus as the Keene State College enrollments likewise increases. 15
  • 22. Table 1 Keene New Hampshire 5 Largest Businesses 5 Largest Businesses in Keene, NH Product/Service Employees Established Cheshire Medical Center Healthcare 1,500 1892 C & S Wholesale Grocers Wholesale Food 820 2004 Keene State College Education 707 1909 Keene School District Education 690 *varies Mini & Precision TimKen Super Precision 632 N/A bearings *Varies- Different schools in Keene were established at different periods of time. The population for Keene as of 2000, was 22,563, but increased to 22,893 people by 2007. Population density for Keene is 609 people per square mile. Figure 3 represents the age structure of Keene. The largest populations are present in the age groups 15-19 and 20-24, in comparison to all other age groups. This undoubtedly reflects the demographic impact of Keene State College 16
  • 23. Figure 3 Demographic distribution shown in percentages. Keene State College Background Presently, a total of 5,443 full time and part time students including undergraduate, graduate and continuing education students attend Keene State College. The community of Keene State College is made up of mostly females, which encompass 3,124 females and the males with 2,319. On average, the age of undergraduates that attend Keene State College is 21, with the average number of first-year students being 18. Since 2005, Keene State College has been accepting an increasing number of students each Fall semester (Figure 4). As the college accepts an increasing number of students, the demand for housing similarly increases. With limited on-campus housing capabilities and the soaring freshman enrollment, junior and senior students are pursuing off-campus housing, predominately in nearby residential neighborhoods (Carson 2006). 17
  • 24. Figure 4 Total Fall Headcount Student Enrollment, Years 2001-2007. Despite concerns of some in the neighborhood, 41.5 percent of residents surveyed in Southeast of Keene, strongly agreed that “there can be no doubt that Keene State (college) is one of the most valuable facilities in the city and to the southwestern region of N.H. as well.” (Figure 5). Figure 5 was compiled from survey data which was produced to gauge the perceived importance of Keene State College to the city and region. The percent gradually increases as the highest percentages of neighborhood residents strongly agree that Keene State College is a valuable commodity to the community. Figure 5 Survey Responses Pertaining to KSC’s Perceived Value to the Community. 18
  • 25. Southeast Keene Neighborhood Change It is difficult to determine exactly what stage of change neighborhoods are currently experiencing. Different parts of a city can be experiencing different neighborhood changes simultaneously. One area can be declining while another revitalizing through different social actions and private or public investment. Southeast Keene is experiencing changes in demography manifested by students moving into the neighborhood. Some people view a rising student population as an economic opportunity and capitalize on it by making previously single family homes rentable to college students (Gopal 2008). In Southeast Keene many homes have been converted from single family units to double or triple family homes in recent years (Figure 6). This would suggest that Southeast Keene is experiencing Stage Two or Three of neighborhood decline. Using data from the City of Keene Department of Assessment, Figure 6 displays the increased conversion of single family homes to multiple family dwellings from the year 2001 to 2008. Notice the western portion of the 2008 map; the high density of multifamily homes increased drastically from 2001. This area is also in the closest proximity to Keene State College and is home to many student households as evidenced by mapping data from the office of the Registrar at Keene State College (Figure 7). The City of Keene is also taking steps to preserve the residential neighborhoods of the city. The city previously set forth an ordinance to cut back on fraternities and large multiple occupancy off-campus housing units. This is a primary characteristic of declining neighborhoods (Pacione 2001). 19
  • 26. Figure 6 Number of families per Household 2001 to 2008 20
  • 27. Figure 7 Student Households in Southeast Keene Neighborhood Responses to Change It is also feasible that Southeast Keene residents and city officials take steps to begin revitalizing the neighborhood, or at least stop or slow decline. The formation of the Southeast Keene Neighborhood Group is a primary indicator or revitalization efforts. Social efficacy at the local level is often the most powerful tool residents have in improving or maintaining their quality of life (Sampson 1991; Bright 2000). The Southeast Keene Neighborhood Group was originated with the intention of mobilizing the neighborhood against the effects of students moving into the community. The Southeast Keene Neighborhood Group website provides a 21
  • 28. brief description of the purpose of the group, “We are a committed group of Keene, NH residents trying to maintain the quality of life in our Southeast Keene neighborhood” (Southeast Keene Neighborhood Group 2008). In 2007 the group started meeting monthly, on every second Tuesday to discuss the neighborhood’s positive and negative aspects. There are currently 36 registered members in the Southeast Keene Neighborhood Group, website. When visiting the Southeast Keene Neighborhood Group online, members of the group post forums on the quality and satisfaction levels and important information that is occurring in their neighborhood. The City of Keene is taking steps to reverse or stop the decline of residential neighborhoods. A city wide ordinance states that no more than four occupants with different last names can take up residence in the same dwelling. Similar ordinances have been passes in other college towns in response to student housing crises (Gumprecht 2003). This ordinance was in part a response to large fraternity houses and off-campus student dwellings that were considered a nuisance (Kopczynski 2008). The ordinance may have stopped large house parties which are of concern to city officials and residents. The ordinance, however, also forced students to disperse into residential neighborhoods in search of housing. This particular step may have partially rectified one aspect of decline. Large parties and general disorder are associated with fraternity houses, but it may have inadvertently exacerbated other characteristics of decline by increasing housing demand and in turn catalyzing the increase of rental properties. The City Council is also currently attempting to pass a series of ordinances that will hold renters and landlords, more accountable for the conditions of their properties. 22
  • 29. This ordinance would require a registration of all rental properties to make it easier to identify the properties that are problematic. The City of Keene Code Enforcement Department (KCED) has implemented a series of ordinances in order to rectify the physical characteristics of neighborhood decline. This department oversees many aspects of public and private development and maintenance. It is through KCED that many maintenance issues are addressed by city officials. Owners of homes can be held accountable for the general condition and maintenance of their properties. Many cities have similar departments and with similar guidelines to encourage the upkeep of privately owned properties. These ordinances were specifically proposed to deal the increasing number of student properties which are subject to many violations under current code enforcement ordinances (Figure 8). The properties highlighted signify reported code violations; the parcels represented by red signify code enforcement violations taking place at student- occupied households. Even though student households do not make up the majority of the neighborhood their households tend to carry a disproportionately high number of cases, over 50 percent. 23
  • 30. Figure 8 Building Code Violations The KCED is working currently trying to come up with a solution to the problems posed by student households. Keene is attempting to implement more stringent ordinances for student occupied housing. Keene City officials have contacted other New Hampshire municipalities in an attempt to better understand how the towns of Durham, Hanover, Plymouth, and Rindge (all home to colleges or universities of differing sizes) have dealt with the issue of student housing. All four of these towns have attempted to enact similar regulations but have not succeeded and all have expressed interest in what direction the City of Keene will take in addressing the student housing issue. If these proposed ordinances are passed in Keene, 24
  • 31. the new efforts will include increased fines, violation based registration of student households, and a ‘Party House’ designation. The ‘Party House’ designation would identify and fine houses that habitually cause disturbances to the public; whether they are noise, structural, or general disorder issues (Kopczynski 2008). Keene State College is also taking action in an attempt to minimize the detrimental effects students have on the community. One step is the attempt to stabilize the college’s enrollment. A recent influx of students caught the administration off-guard when a greater, than expected, number of accepted students decided to attend KSC. This caused an on-campus housing shortage and forced many upperclassmen off-campus and into rentals recently converted from single family use. The school employs a full-time police officer who acts as a liaison between campus officials and the police department. The school has also recently entered into an agreement with the town to pay for municipal services that are associated with the college and college students. An estimated 20 percent of all emergency calls in Keene are associated with KSC students. Therefore, the college has agreed to pay for 20 percent of the emergency response cost in an attempt to alleviate the strain KSC is causing the city. This bill will amount to over one million dollars over the next four years (Robinson 2008; Palermo 2008). 25
  • 32. Chapter 4 Methods Primary data collection is one of the most important aspects of social science research. Surveys represent one of the most common types of quantitative, social science research (Fink 2003). Primary data can be collected in many different ways. For this study, two primary data collection methods were employed in order to obtain the necessary information to provide meaningful statistical analysis or social and physical aspects of the neighborhood and its residents. First, a survey was developed to obtain data from residents regarding their attitudes and opinions regarding the neighborhood. The second tool used was a housing assessment, designed to assess the physical structure of homes and the general condition of the property. Survey Methodology Survey research can take many forms; questionnaires or surveys are usually physically distributed to respondents, these can be distributed by hand or through the mail. Other forms of survey research can be online questionnaires, face-to-face interviews, or telephone interviews. Using surveys, it is possible to collect data from large or small populations. The two most popular forms of survey research are questionnaires and personal interviews. Surveying provides imperative information in understanding the concerns, characteristics and demographics of a certain control group. Initial planning of the survey design and survey questions is extremely important in conducting survey research. The process of selecting the appropriate survey method begins with examining different types of techniques and 26
  • 33. determining which one is best suited for obtaining the information pertinent to the research questions at hand. Surveys must be designed with careful consideration to ensure that respondents can clearly interpret and respond to each question and provide useful and meaningful response. It often requires tremendous time and effort critiquing each question making sure it is vital to the survey and relevant to the overall study. Surveys are designed to give a better understanding of the concerns and general feelings of the respondents (Weisberg 2005). For this research project, the decision was made that as many residents as possible in the Southeast neighborhood would be asked to participate in a door-to-door survey (Figure 9). In order to assure the survey was free from error; several surveys were distributed to the Southeast Neighborhood Group, which meets monthly in the Keene Public Library. Because this group is concerned with the same objectives as the project at hand, they were ideal candidates for a pretrial of the survey. These pilot surveys identified some structural issues that were rectified before the final product was distributed to the public. Researchers distributed the survey in Southeast Keene on three different occasions. The first survey was administered on a weekday afternoon because most children are home from school at that time, and a parent would likely be home. The first day yielded fifteen completed surveys. The second attempt of administering surveys took place on a Saturday morning when families were likely to be home. Streets in close proximity to Baker Street were the focus area of this survey distribution. A total of sixteen surveys were collected. Similar to the first day of surveying, the third trial of surveying took place on a Thursday afternoon. Marlboro Street and the adjoining streets were the main focus of this distribution in which nineteen surveys were 27
  • 34. collected. The third day of sampling yielded more surveys completed by students who rent opposed to the first two distributions which produced mostly homeowners (Figure 10). Figure 9 Locations of Surveyed Residents 28
  • 35. Figure 10 Surveys being distributed Additional surveys were handed out by different individuals of the group as well as by the Professor facilitating the project. Each resident was approached with the same questionnaire in hopes that everyone would agree to filling out the survey. The majority of residents were willing to take part in the study and seemed interested in the goings-on in the neighborhood. Many residents seemed eager to voice their concerns and attitudes regarding the state of their neighborhood. The final outcome resulted in a total of 65 completed surveys from 332 residential households in the neighborhood. The layout of the survey was a two sided questionnaire containing issues deemed pertinent to the community and its resident’s daily lives (Appendix A). A brief introduction at 29
  • 36. the top of the survey states its purpose and clarifies how it will be used to gain a better understanding of the concerns residents are experiencing. The first two questions identify respondents according to gender and whether the respondent is a renter or owner. The purpose of these questions is to divide respondents into groups in order to detect statistical trends that may occur. Employing the Likert Scale; the next two questions were asked to determine respondents overall satisfaction levels as well as determining whether satisfaction levels were increasing, decreasing, staying the same, or no opinion. The Likert Scale is a measurement scale used in research, which assigns numerical value for multiple answers given on a survey (Fink 2003). Answers are given on a scale ranging from complete agreement on one side to complete disagreement on the other side, with no opinion in the middle. For this particular question a four-point differential Likert scale was implemented because it is a scale with an even number of points with no mid-point forcing respondents to make a clear, concise choice (Fink 2003). The next section of the survey dealt with specific aspects of life within Southeast Keene. Residents were asked to rate their attitudes regarding litter, violation of traffic laws, sidewalk conditions, safety, alcohol and or drug abuse, and recent changes in property values. Using a five-point Likert scale consisting of the categories: strongly agree, somewhat agree, no opinion, somewhat disagree, and strongly disagree, residents rated their attitude on the various topics. The responses of these questions will be used in statistical analysis to identify and examine trends that occur within and in between each grouping variable. The reverse side of the survey identifies the respondent as either a Keene State College student or not. The subsequent questions determine the perceived effects associated with 30
  • 37. college students in the neighborhood. Using a five-point Likert scale, respondents answered what type of impact Keene State students have on the neighborhood given the choices of ‘strong positive, positive, neutral, negative, and strong negative impact’. This was designed to make conclusions on whether there is a correlation between non-students and negative opinions about the neighborhood. Individuals were also asked to identify the proximity in which they live to college students. They had the choice of classifying themselves as immediate neighbors, two to three houses away, four or greater houses away, or not in close proximity. This is a vital question to ask because the distance residents live from students may have direct influences their opinions positively or negatively. Individuals were then asked, in the past five years or since taking up residency in the neighborhood, whether or not they had noticed an increase in the number of college students living in the neighborhood. Residents then had the option of stating if they have ever had to call the Police to respond to a disturbance and if so how many times. The concluding questions of the survey implemented the four-point Likert scale by asking residents to rate their relationship with neighbors. They had the option of rating their relationship as either poor, fair, good, or excellent. Following this question, residents were asked to rate their level of agreement with a past neighborhood assessment of Keene. The past assessment stated: “there can be no doubt that Keene State (College) is one of the most valuable facilities in the City and to the Southwestern region of N.H. as well.” With the aid of a five-point Likert scale, respondents were able to classify whether they strongly agreed, somewhat agreed, had no opinion, somewhat disagreed, or strongly disagreed with the 31
  • 38. statement. As a conclusion to the survey, respondents were asked to complete sentences describing the best and worst thing about their neighborhood. Survey Results Drawing on data collected from the survey, several statistical trends were identified regarding residents’ attitudes regarding their neighborhood. The two primary groups surveyed were student residents and non-student residents. This group was nearly evenly surveyed. Of the surveyed population, 46.2 percent were current Keene State College students and 53.8 percent were local residents. Ownership and rental rates followed this trend, as zero percent of students reported owning a home, while 90.4 percent of non-student respondents are homeowners. The survey was also designed to detect trends differentiated by gender, 63 percent of respondents were male and 37 percent were female. As expected, the non-student population has a significantly longer term of residency than do students. No students report having lived in the neighborhood for longer than three years. At 11.6 months, the average term of residency for students is under one year, while the average term of residency for non-students is 17.2 years. This is unquestionably affected by one significant outlier, a resident of 60 years. This range displays a vast discrepancy for two populations with near equal numbers (Figure 11). This displays the transient nature of college students within the neighborhood. As mentioned in Chapter 2; length of residency is a primary indicator in a resident’s level of commitment to a neighborhood (Sampson 1991). This difference displays a primary difference existing between respondent groups. A person who has 32
  • 39. lived in the neighborhood for a short period of time will have much different perspectives regarding neighborhood change. Non-student residents, on average, have a decreasing level of satisfaction whereas student resident’s average level of satisfaction is more stable. Just over 37 percent of home- owners report their neighborhood satisfaction level as decreasing. This is in stark contrast to student respondents, 86.7 percent of which feel their satisfaction levels are staying the same or increasing. This difference can be attributed to the non-student’s length of residency (Figure 11). It is plausible that the longer residents have lived in the neighborhood, the larger the amount of change they have witnessed. It is also plausible that the influx of student households can exacerbate the declining satisfaction levels of non-student residents. To examine this question, a Correlation test was run to determine any relationship, if any, dropping satisfaction levels have with the perceived influx of students. A correlation test measures the level of association between two spatial variables (McGrew and Monroe 2000). The results of this test returned significant results at the .066 level. This presents a cause of concern for the future of satisfaction levels of residents if students continue to move into the area. This also signifies some characteristic attitudes and sentiments associated with the early stages of neighborhood decline. 33
  • 40. Non-Students KSC Students Figure 11 Total Months of Residency for Non-students and Students When asked to compare the quality of life of their neighborhood to other neighborhoods within Keene, students and non students again showed a significant difference in sentiments. Students, overwhelmingly, believed the average quality of life was significantly higher than other neighborhoods. Non-student respondents were more likely to believe their neighborhood was equal to other neighborhoods in Keene. This difference of means occurs at the .006 significance level this represents a statistically significant difference in average attitudes between students and non-student residents. If friendships and local acquaintances increase residents connection to a neighborhood (Sampson 1991) than it can be expected that neighborhood satisfaction levels will increase if survey respondents report good relationships with their neighbors. Satisfaction levels have a very significant positive correlation to reported relationships with neighbors; it is again statistically significant at the .01 level (Table 2). 34
  • 41. Table 2 Correlation Between Satisfaction Levels and Relationships with Neighbors Correlations Satisfaction Neighbor Relations ** Spearman's rho Satisfaction Correlation Coefficient 1.000 .453 Sig. (2-tailed) . .000 N 65 65 ** Neighbor Correlation Coefficient .453 1.000 Relations Sig. (2-tailed) .000 . N 65 65 **. Correlation is significant at the 0.01 level (2-tailed). This survey was designed to gauge respondents’ level of concern regarding several different aspects of neighborhood life. The results of this portion of the survey have identified several more significant differences in student and non-student sentiments regarding their neighborhood. Non-student residents are more concerned with litter and garbage in their neighborhood. Likewise, when asked to respond to traffic concerns, students are significantly less concerned with drivers obeying traffic laws than non-student residents. While some residents report being very unsatisfied with sidewalks in their neighborhood, no significant difference exists between students and non-students. This portion of the survey returned results that indicate student respondents generally have no opinion about traffic or public space in their neighborhood. This statistic speaks to the general apathy students are categorized as having. A primary factor in people’s perceptions of a stable neighborhood is safety, residents feel little connection to an area in which they do not feel safe (Doran and Lees 2005; Saunders 35
  • 42. 1999). All respondents of this survey report feeling safe in their homes. However, non-students do report feeling less safe than do students when walking at in the neighborhood at night. This difference in the perception of safety is largely insignificant both demographics generally agree on the feeling of safety. This implies that residents of Southeast Keene still view their neighborhood as a safe place to live. This is a promising statistic that reflects a positive aspect of Southeast Keene recognized by both students and local residents. As identified above, many statistically significant differences exist between student and non student residents. However, very few differences occur between genders. Non-student resident females report very similar sentiments as their male counterparts regarding their neighborhood. Some differences that do occur on a significant level pertain to traffic. Female residents report a higher rate of dissatisfaction in regards to drivers’ compliance with traffic regulations. Another significant gender difference that occurs regards the perceived impact Keene State College students have on the neighborhood. Males tend to believe students have a more positive impact than do females which is significant at the .006 level. This trend corresponds with the question asking respondents to rate Keene State College’s value to the City of Keene. Males tend to view KSC as a more valuable entity to the city than do females. This significance also occurs at the .006 level. Property values are often assessed in order to gauge the condition or stability of a neighborhood. Stable property values often indicate a stable and healthy neighborhood whereas decreasing property values are a principle factor in neighborhood decline. When property values begin to decline a host of other negative characteristics of decline soon follow. 36
  • 43. Outmigration among former residents becomes prevalent, lower income residents move to the neighborhood, rental housing increases, and crime rates rise (Metzger 2000; Skogan 1990). Due to these effects; it is no surprise that property values are of chief concern to homeowners. Keene is no exception, when surveyed; homeowners report their property values have recently dropped due to changes in their neighborhood. When asked to gauge their own property values, 80 percent of surveyed students had no opinion on the matter. While many homeowners believe their property value has declined, property values have increased in the entire City of Keene since 2001. If homeowner’s concerns can be justified or accurate; property values in Southeast Keene will have increased less than the city as a whole since 2001. However, the perceived decrease in property values is inaccurate. Residential property values in Southeast Keene have increased at a greater rate when compared to the entire city (Table 3). This seems to contradict the neighborhood decline that a main focus of this study. However, as previously stated (Figure 7), many homes in Keene have been converted from one family to multiple unit homes in response to the increase in rental demand from 2001 to 2008. Multiple unit homes are more valuable on the housing market than single unit homes especially when there is a steady demand for temporary housing as there is in Keene. The increase in rental housing is a sign of neighborhood decline, but also represents added economic value to properties. This economic value does not apply to the neighborhood. The economic value exists only for the owner of the property who is personally capitalizing on renting the property. In Southeast Keene, property values are not a reliable indicator of neighborhood decline. 37
  • 44. Table 3 Keene, New Hampshire Property Values 2001 to 2008 2001 2008 Percent Increase Keene $126,474 $223,731 76.8% Southeast Keene $95,188 $182,995 92.2% *City of Keene Department of Assessment Data Drawing on data collected with the open response questions on the survey, some trends became evident regarding respondents attitudes toward the ‘best’ and ‘worst’ aspects of their neighborhood. The best quality of southeast Keene, as reported by residents, is its location. Over forty percent of respondents cite Southeast Keene’s proximity to downtown as its ‘best’ feature. Nearly the same percentage of respondents report the ‘best’ aspect of their neighborhood is their neighbors. Many of these respondents characterize their neighbors as friendly and considerate. Location and social cohesiveness are two characteristics that are common in all stable neighborhoods. The best aspects of Southeast Keene show no clear distinction between student and non-students respondents. The majority of both groups value the same aspects of their neighborhood. Other valued characteristics of the neighborhood were its safety, proximity to schools, quietness, and cleanliness. When asked to identify the ‘worst’ aspect about the neighborhood, there was a much wider range of responses. These aspects differed widely between student and non-student residents. Keene State College and Keene State College students were mentioned in some fashion in nearly 20 percent of the responses regarding the worst aspect of the neighborhood. However, these responses differed in their reasons. Even more unpopular than student 38
  • 45. housing and poor student behavior however are housing issues. Over 30 percent of the worst aspects of the neighborhood involve housing issues, including; increase in rental housing, high turnover rates, disorder of rental properties, and unresponsive landlords. These are all issues that predominantly concern the non-students populations. In the student population concerns were much different. Many student respondents had nothing negative to report about their neighborhood and simply left this portion of the survey blank. Again, outlining the apathy that exists with students and their neighborhoods. Other aspects of the neighborhood concerning students were the lack of parking, road conditions, and neighbors. Nearly 15 percent of student respondents mentioned poor relations with their neighbors as the worst aspect of their neighborhood. 39
  • 46. Chapter 5 Housing Assessment Methodologies For the housing quality assessment in Southeast Keene, two sample populations of homes were selected from the neighborhood. The first population was comprised of local non- student homes while the other sample consisted of known student addresses obtained from the Keene State College Registrar’s office (Figure 12). In order to pick which houses were to be analyzed, a random sampling number was generated in order to obtain a random starting point for each population pool. It was determined that the starting point address for off campus students was 38 South Street. Beginning with 38 South Street, every fifth student household was assessed while skipping non-student households. The starting point for non-student housing for non-student residents was 95 Adams Street and every fifth property was assessed skipping known student households. Both focus groups were assessed by the same researcher using an identical assessment tool for each population (Appendix B). The housing quality assessment was implemented on two different occasions. The initial day of evaluation was conducted on a weekday afternoon. The focus for the first day of appraisal was non-student residents located in the Southeast neighborhood. The remaining households were assessed the following weekend along with the completion of the entire student household group. Assessment was completed by the same individual and was done so by driving slowly by each house and critiquing from the road (Figure 12). 40
  • 47. Figure 12 Housing Assessment Properties Housing quality was evaluated on a scale from one to three. If an aspect of a house scored a value of one, there were major problems, a score of two had minor problems, and a score of three had no problems. To determine the overall quality and condition of the houses’ exteriors, there were five main points of focus for the housing assessment. The points of focus included paint or exterior finishes, the condition of windows and doors, roof quality and condition, porches and decks including railings and any steps (Figure 13). 41
  • 48. Poorly Assessed Housing Characteristics Broken and missing windows Major problems with paint and trim Major problems with roof quality Major problems with paint and trim Figure 13 Assessed Housing Externalities The general parking condition was assessed for each selected house to determine if the house had adequate parking. If houses had cars parked on the street or on the grass, parking was considered inadequate. This section included any walkways or sidewalks that were present; these were assessed according to their general condition and the presence or absence of cracks or damage (Figure 14). 42
  • 49. Assessed Parking Conditions Cars parked on lawns in violation of city code enforcement Figure 14 Assessed Parking Conditions The final components graded were litter and/or garbage surrounding the house, the presence of a dumpster, and general landscape maintenance (Figure 15). Negative Externalities on Properties Discarded mattress Discarded bicycle, ladders and litter Dumpsters and litter Figure 15 Negative Items on Properties 43
  • 50. Results The Housing assessment also produced some statistical differences in the quality and condition of housing in the neighborhood. The majority of student housing is of lower quality than owner-occupied housing. The student housing sample population has an average quality assessment of 2.5 on a three point scale. Owner-occupied housing scored a 2.819. This is not a statistically significant difference in means but it is a trend in housing quality. Another important trend to recognize is that owner-occupied housing scored slightly lower assessments in areas where a high density of student housing is present. This solidifies the spiraling theories of decay which state that disorder and decline will inevitably spread to the properties in close proximity (Skogan 1990; Doran and Lees 2005). The poorly assessed homes tended to be grouped together as did the more positively assessed homes. Some specific difference occurred regarding the quality and condition of owner and student occupied housing. Student Houses are significantly more apt to have a dumpster. This is likely because many student houses are occupied by up to four adults who will produce much more waste than other types of households. Also, many students are not residents of the City of Keene and therefore do not have the same kind of access to city waste facilities. Most rental properties include some kind of trash pickup for residents, and dumpsters represent the most efficient process for waste removal with little regard to the perceptions associated with dumpsters in residential neighborhoods. Statistical significance was difficult to detect through this assessment. The differences that did occur are visibly easy to discern (Figure 16). Some non-student properties are in 44
  • 51. exceedingly poor condition. These homes threw off any statistical significance that would have occurred. Assessing homes in smaller microcosms of the neighborhood could have returned more significant differences between residential and student properties and areas. Non-Student Housing Student Housing Figure 16 Student and Non-student Housing. 45
  • 52. Chapter 6 Limitations As with many studies, principal limitations are associated with the design and implementation of the survey instrument utilized in this study. One challenge experienced while designing the survey was ensuring each question was applicable to both resident and renter occupied households. Drawbacks were experienced when dispersing the surveys door- to-door. As not all residents chose to participate in the survey, which in turn reduced the amount of completed surveys used to run statistical tests and analyze results. Locating data revealing the addresses of off-campus student households was problematic due to the fact that not all students report their off campus addresses to the Keene State College Registrar’s Office, while others do not allow their information to be publicly disseminated. Additional limitations were experienced while conducting the housing assessment. The standard by which houses are assessed in this study was somewhat subjective in that the researchers have had no formal training in housing assessment. As previously mentioned, it was not possible to obtain a complete and accurate list of student households. Therefore, some of the non-student dwellings assessed may have housed student occupants. When mapping the houses which were assessed in the Southeast neighborhood of Keene, the associated data file did not provide a current listing of all properties that housed multiple families, which inhibited the ability to identify on the map each evaluated domain. 46
  • 53. Conclusions This study has returned conclusive results regarding primary data analysis. There is a significant difference regarding the perceptions of the case study neighborhood between student and non-student residents. Students, in general are less concerned with centrifugal forces that are taking place in the neighborhood, this is likely attributed to the short term of residency of students. They have little economic investment in the place they live. Conversely, non-student residents are raising families and are investing or have invested large amounts of social and financial capital into their homes and neighborhood. The survey data presents a cautionary outlook as more students are expected to enter the neighborhood and many residents report a deteriorating level of satisfaction. Many actions need to take place in order to reverse or stall the trends and perceptions of neighborhood decline being experienced by Southeast Keene. The level of cooperation between the City and the College must be high. The college and the city are beginning to work in conjunction more so than years previous. Other institutions have implemented programs within the college itself to promote and solidify the reputation of the college or university within the community. One such program took place in Birmingham, Alabama, where incoming students were encouraged to be active in the community and were made aware of what makes a good neighbor. This program was implemented after some community backlash began to occur in response to large fraternity parties and general disorder (Nichols 1990). This is a good start, but students should be required to sit through a lecture, or even a semester long class in what it means to be a positive and cohesive member of a community. 47
  • 54. This would increase students’ awareness of residential concerns of student lifestyles in the immediate community where their college is located. This would hopefully increase students’ attention to their actions and behavior and how it reverberates in the community. This system would be implemented by the college, but would be most effective if it included members of the community as well as city officials such as police officers or council members. This sort of system would hopefully make for a more responsible student living in the community which could potentially correlate with a better reputation of students and the institute at which they study. A class such as this would not only make for a more responsible student-resident, but the lessons learned could also endure into adulthood and make for more responsible adult homeowners. This class would encapsulate the dynamics of local society. Many classes exist in global economic affairs, or global geographic regions, or global awareness in general. There are relatively few classes that focus on the local aspects of being a good citizen. A class of this type could have far reaching implications in the college, the community, and lives of students. More studies would need to be developed to expand this idea, but inaction on the part of any or all parties involved will only decay the much sought after quality of life in Keene’s residential neighborhoods. To reverse or stop neighborhood decline the City of Keene can take action through increased code enforcement, though a crucial component of any city taking action is accountability. There are two parties involved in the student housing issue, landlords and their student tenants. The student housing issue is not solely caused by a student presence. Students 48
  • 55. renting houses cannot be held accountable for all of the negative aspects associated with student households. Students living in the neighborhood must be held accountable for their behavior and the cleanliness of the properties in which they live. Negative characteristics, such as litter, parking on lawns, loud parties and disruptive behavior can all be directly attributed to students. These are mostly issues of responsibility and can be addressed with fines and tickets for code enforcement violations. Holding landlords responsible for the condition of their properties can be problematic, as the City of Keene has no official registry of rental properties. Landlords must also be held accountable for the conditions of the households they rent out to students. Landlords are responsible for the structural integrity of their properties. The tenants cannot be expected to conduct repairs on roofs, windows, or other externalities of the houses in which they live. Therefore, there needs to a distinction between rental properties and owner occupied housing when assessing the condition of the property. Landlords are responsible to keep up the outside appearance and condition of their properties, but are also responsible for the inside of their dwellings. They need to be held accountable for the safety of their tenants. Some properties rented to students are simply unsafe. Students living in troubling conditions often do no know where to turn for help in dealing with absentee landlords. Information should be made available to students planning to live off-campus about the rights they have as renters. Students should understand their responsibilities as well as the responsibilities of their landlords. In the City of Keene, these steps towards responsible student citizenship and improved town-gown relations are already underway. While concern persists in the Southeast Keene 49
  • 56. neighborhood, there still exists overarching attitudes of goodwill to the college and its students. Many residents report having no trouble with student neighbors, with several even going so far as to praise some student households for their contributions to the community. Amongst students themselves there is also recognition of the need for civility, and concern that a few student households may taint the overall image of the Keene State College student. With positive attitudes and proactive solutions, the future of the Southeast Keene Neighborhood remains hopeful. 50
  • 57. Literature Cited Aitkin, Stuart C. 1990. Local Evaluations of Neighborhood Change. Annals of the Association of American Geographers. 80 (2):247-267. Banerjee, Tridib and William C. Baer. 1984. Beyond the Neighborhood Unit: Residential Environments and Public Policy. New York, NY: Plenum Press. Baxter, V. and, Mickey Laurie. 2000. Residential Mortgage Foreclosure and Neighborhood Change. Housing Policy Debate 11 (3): 675-99. Bright, Elise M. 2000. Reviving America’s Forgotten Neighborhood. New York: Garland Publishing. Brower, Aaron M. and Lisa Carroll. 2007. Spatial and Temporal Aspects of Alcohol-Related Crime in a College Town. Journal of American College Health. 55(5): 267-275. Carson, Cristi. 2006. Keene State College. Economic Impact of the College on the Community, Region and State. Office of Research and Planning, University System on New Hampshire. Copeland, L. 2003. College Towns Fight Student Slums. USA Today, 2 October. Doran, Bruce J. and Brian G. Lees. 2005. Investigating the Spatiotemporal Links Between Disorder, Crime, and the Fear of Crime. Professional Geographer. 57(1): 1-12. Faulkner, Philip. 1993. Economic Development Plan. City of Keene New Hampshire. Fink, Arlene. 2003. The Survey Handbook, Second Edition. Thousand Oaks, CA: Sage Publications. Gahlinger, Paul. 2004. Illegal Drugs: A Complete Guide to their History, Chemistry, Use, and Abuse. New York: Plume. Galster, George. 2001. On The Nature of Neighborhood. Urban Studies. 38 (12): 2111-2124. Gopal, Prashant. 2008. College Towns: Still a Smart Investment. Business Week. 5. 51
  • 58. Graham, John. 2005. Stick Your Neck Out: A Street Smart Guide to Creating Change in your Community and Beyond. San Francisco: Berrett-Koehler Publishers. Gumprecht, Blake. 2003. The American College Town. The Geographical Review 93 (1): 51-80. Hallman, Howard. 1984. Neighborhoods: Their Place in Urban Life. California: Sage Publications. Hingson, Ralph W. 1998. Public Health Reports 113(1): 52-55. Kenyon, Elizabeth L. 1997. Seasonal Sub-Communities: The Impact of Student Households on Residential Communities. The British Journal of Sociology. 48 (2): 286-301. Kopczynski, Medard K. 2008. Code Enforcement Options. Prepared for the Planning, Licenses, and Development Committee. City of Keene, New Hampshire Health Department. Lee, B.A., and K.E. Campbell (1997) “Common Ground? Urban Neighborhoods as Survey Respondents See Them,” Social Science Quarterly 78(4): 922-936. Lee, Barret, R.S. Oropesa and James W. Kanan. 1994. Neighborhood Context and Residential Mobility. Demography. 31 (2): 249-270. Lee, Barret. 2001. Taking Neighborhoods Seriously. In Does it Take a Village? ed. Booth, Alan and Ann C. Crouter, 31-40. New York: Lawrence Erlbaum Associates. Logan, John R. and O. Andrew Collver. 1984. Residents’ Perceptions of Suburban Community Differences. American Sociological Review. 48: 428-433. Lucy, William H., and David L. Phelps. 2000. Confronting Suburban Decline. Washington DC: Island Press. Mansfield, Nick. 1993 Grads and Snobs: John Brown, Town and Gown in Early Nineteenth- Century Cambridge. History Workshop. 35: 184-198. McGrew, J. Chapman, and Charles B. Monroe. 2000. An Introduction to Statistical Problem Solving in Geography. Boston: McGraw-Hill Company. Mensch, Ann. 2001. New Hampshire Local History: Cheshire County. http://home.att. net/~local_history/NH-Cheshire_Co.htm (last accessed 28 October 2008). Metzger, J. 2000. Planned Abandonment: Neighborhood Life Cycle Theory and National Urban Policy. Housing Policy Debate. 11(1): 8-31. 52
  • 59. New Hampshire Employment Security. 2007. Economic & Labor Market Information Bureau. http://www.nh.gov/nhes/elmi/htmlprofiles/keene.html (last accessed 11 November 2008). Nichols, David. 1990. University-Community Relations: Living Together Effectively. Springfield: Charles C. Thomas Publisher. Pacione, Michael. 2001. Urban Geography: A Global Perspective. Glascow: Bell and Bain. Palermo, Sarah. 2008. Plan: KSC to Pay More for Services. The Keene Sentinel. November 20. Robinson, Andrew. 2008. Keene State’s Response to Off-campus Housing Issues. October 29, 2008. Sell, Louise and Robson, Philip. 1998. Perceptions of College Life, Emotional Well-Being and Patterns of Drug and Alcohol Use Among Oxford Undergraduates. Oxford Review of Education. 24(2): 235-244. Sastry, Narayan, Anne Pebley and Michela Zonta. 2002. Neighborhood Definitions and the Spatial Dimension of Daily Life in Los Angeles. Presentation at the 2002 Annual Meetings of the Population Association of America, Atlanta, Georgia. April 2002. Sampson, Robert. 1991. Linking the Micro and Macrolevel Dimensions of Community Social Organization. Social Forces. 70 (1): 43-64. Sampson, Robert, Jeffrey D. Morenoff and Thomas Gannon-Riley. 2002. Assessing “Neighborhood Effects”: Social Process and New Directions in Research. The Annual Review of Sociology. 28: 443-478. Sampson, Robert and Stephen W. Raudenbush. 1999. Systematic Social Observation of Public Space: A New Look at Disorder in Urban Neighborhoods. The American Journal of Sociology, Vol. 105, No. 3 (Nov., 1999), pp. 603-651 Saunders, Ralph. 1999. The Space Community Policing Makes and the Body That Makes It. Professional Geographer. 51 (1): 135-146. Sells, Louise and Philip Robson. 1998. Perceptions of College Life, Emotional Well-being and Patterns of Drug and Alcohol Use among Oxford Undergraduates. Oxford Review of Education. 24 (2): 235-243. Sibly, R. and Jim Hone. 2002. Population Growth Rate and its Determinates: an overview. Philosophical Transactions: Biological Sciences 357 (1425): 1153-77. 53
  • 60. Skogan, Wesley G. 1990. Disorder and Decline: Crime and the Spiral of Decay in American Neighborhoods. Ontario: Collier Macmillan Canada. Staeheli, Lynn A. and A. Thompson. 1997. Citizenship, Community, and Struggles for Public Space. Professional Geographer 49(1): 28–38 Southeast Keene Neighborhood Group. 2008. http://southeastkeene.ning.com/ (last accessed 10 November 2008). Wechsler, Henry, Jae Eun Lee, John Hall Alexander C. Wagenaar, and Hang Lee. 2002. Secondhand Effects of Student Alcohol Use Reported by Neighbors of Colleges: The Role of Alcohol Outlets. Social Science and Medicine. 55: 425-435. Weisberg, Herbert F. 2005. The Total Survey Error Approach: A Guide to the New Science of Survey Research. Chicago: The University of Chicago Press. United States Census Bureau. 2008. Keene, New Hampshire. http://www.census.gov/ (last accessed 12 November 2008.) 54
  • 61. Appendices Appendix A- South East Keene Survey Hello! We are from Department of Geography at Keene State College and are working in concert with the South East Keene Neighborhood Group to conduct a study about your neighborhood. This survey is designed to gain an understanding of the concerns of you and your neighbors. Results of this study will be presented to the Keene State College Geography Department, SE Keene Neighborhood Group, and the City of Keene. Your participation in this survey would be greatly appreciated. How long have you been a resident of this neighborhood? Years Months Please Circle: Please Circle: 1. Female 1. Home owner 2. Male 2. Renter How would you rate your overall satisfaction with your neighborhood? 1. Poor 2 . Fair 3. Good 4. Excellent Is your level of satisfaction with your neighborhood… 1. Increasing 2. Decreasing 3. Staying the Same 4. Don’t Know/No Opinion In comparison with the rest of Keene, would you say that the quality of life in your neighborhood is: 1. Significantly Higher 2. Higher 3. Same 4. Lower 5. Significantly Lower Please rate the following aspects of life in your neighborhood: Strongly Somewhat No Opinion Somewhat Strongly Agree Agree Disagree Disagree 1. Litter is a problem in my neighborhood 2. Drivers obey traffic laws in my neighborhood 3. Sidewalks are in good condition 4. I feel safe in my home 5. I feel safe walking at night 6. Alcohol abuse is evident 7. Illegal Drug use is evident 8. Recent changes in the neighborhood have caused property values to decline 52
  • 62. Are you a student at Keene State College? Yes No What type of impact do Keene State College students have in your neighborhood? 1. Strong Positive 2. Positive 3. Neutral 4. Negative 5. Strong Negative Do you live in close proximity to college students? 1. Yes (Immediate neighbors) 3. Yes (4+ houses away) 2. Yes (2-3 houses away) 4. Not in close proximity In the past five years, or since you have been a resident, have you noticed an increase in the number of college students living in your neighborhood? 1. Yes 2. No 3. Not Sure Have you ever called the Police to respond to a disturbance in your neighborhood? 1. Yes (If yes, how many times?) 2. No How would you rate your relationship with your neighbors? 1. Poor 2. Fair 3. Good 4. Excellent A past assessment of Keene neighborhoods stated: “there can be no doubt that Keene State (College) is one of the most valuable facilities in the City and to the southwestern region of N.H. as well.” Do you agree with this statement? 1. Strongly Agree 2. Somewhat Agree 3.No Opinion 4. Somewhat Disagree 5.Strongly Disagree Please complete the following sentences: “The best thing about my neighborhood is…” “The worst thing about my neighborhood is…” 53
  • 63. Appendices Appendix B- Housing Assessment tool Address:______________________________________ 1=Major Problems 2=Minor Problems 3= No Problems Exterior Structure Grade Comments Paint ______ Exterior Finishes (wholes/breaks) ______ House components (missing) ______ Windows and doors (glass with cracks) ______ Roofs Maintenance ______ Cleanliness ______ Porches and Decks Stairs ______ Railings (missing, broken) ______ Parking Spaces (adequate) ______ Surface ______ Walkways broken or cracked ______ Litter/ Landscaping Litter/garbage ______ Dumpster’s ______ Lawns, hedges ______ 54