This report evaluates the impact of neighborhood change on residents of the New York City Housing Authority (NYCHA), highlighting the complexities arising from gentrification in public housing areas. It finds income disparities among residents based on their neighborhood classifications, with those in higher-income neighborhoods earning significantly more, although they face rising affordability concerns. The research emphasizes the need for improved resource access and support for skill-building and employment opportunities for NYCHA residents across various neighborhood contexts.

![CEO RESPONSE TO ABT ASSOCIATES EVALUATION
ON THE EFFECTS OF NEIGHBORHOOD CHANGE FOR NYCHA RESIDENTS
May 2015
In his second State of the City address on February 3, 2015, Mayor Bill de Blasio made affordable and mixed
income housing the center of his agenda, promising to build and preserve 200,000 affordable homes which
will house over a half million New Yorkers in the coming decade.1 The plan includes building 80,000 new
affordable housing units and preserving the affordability and quality of 120,000 existing housing units. An
emphasis of the plan is to foster diverse, equitable, and livable neighborhoods. 2
Subsidized housing has been an important poverty-alleviation tool in neighborhoods across the city for
decades. However, the landscape around public housing has shifted dramatically. Most New York City
Housing Authority (NYCHA) housing was built in what were low‐income neighborhoods, but today an
increasing number of these NYCHA developments are located in gentrified or rapidly changing
neighborhoods. The Center for Economic Opportunity (CEO) recognized that the implications of such
change are complex – with potential concerns for residents but also potential benefits – and wanted to learn
how neighborhood change is affecting the lives of low-income New Yorkers.
CEO is the City of New York’s anti-poverty innovation unit. Working in conjunction with City Agencies and
other partners, CEO develops, manages and evaluates program and policy initiatives to help the City improve
its systems and identify effective responses to poverty and its related challenges. Part of the Mayor’s Office
of Operations, CEO supports the administration on issues of equity and equality. CEO also produces the
annual Poverty Measure Report which provides detailed insights into the scope of poverty and impact of
public policy across New York City. The report has consistently shown that the poverty rate for New York
City Housing Authority (NYCHA) families would approximately double without this housing subsidy.3
In this study, CEO sought to answer a stand-alone research question (rather than evaluating a specific
programmatic intervention) and contracted Abt Associates to evaluate how neighborhood change, or
gentrification, affects the lives of NYCHA residents. To do this research, Abt partnered closely with New
York University’s Furman Center for Real Estate and Urban Policy, three community-based partners
(BronxWorks, Hudson Guild, and Urban Upbound), and NYCHA residents to learn about experiences of
neighborhood change in New York City. CEO worked closely with NYCHA’s Department of Research and
Management Analysis on the project.
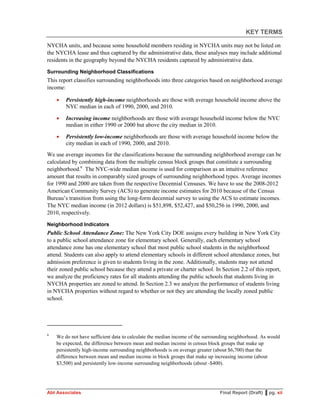
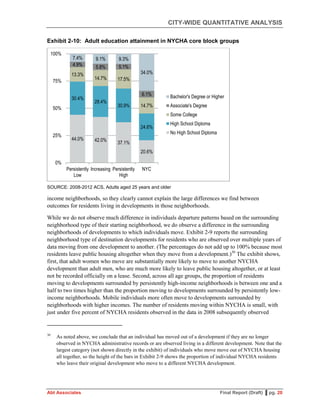
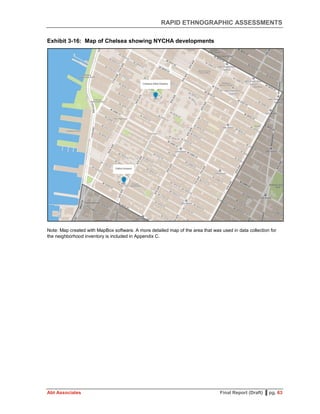
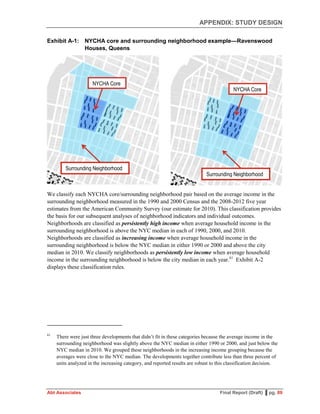
The research team examined effects of neighborhood change for NYCHA residents by classifying
neighborhoods containing public housing as persistently low-income, increasing income, or high-income and
then identifying indicators with the potential to vary across categories. The evaluators conducted both a
citywide quantitative analysis and in-depth qualitative case studies of developments in three illustrative
neighborhoods selected to correspond with these three neighborhood classifications – Sedgwick Houses in
Morris Heights, Queensbridge Houses in Long Island City, and Elliot-Chelsea Houses in Chelsea. The
qualitative case-studies drew on community-based participatory research – leveraging the perspectives of
community members, particularly NYCHA residents, and engaging them as core research partners. The field
research for this study was conducted from April to August 2014.
1
NYC Office of the Mayor. State of the City: Mayor de Blasio Puts Affordable Housing at Center of 2015 Agenda. [Press Release] 3 Feb. 2015.
2 See NYC Office of the Mayor. Mayor de Blasio Unveils ‘Housing New York’: A Five-Borough, 10-Year Housing Plan to Protect and Expand
Affordability. [Press Release] 5 May 2014, and read the full report: Housing New York: A Five Borough, Ten Year Plan.
3 See The CEO Poverty Measure, 2005-2013, Appendix C.](https://image.slidesharecdn.com/finalreportrevised050615plusresponse-150522154705-lva1-app6892/85/The-Effects-of-Neighborhood-Change-on-New-York-City-Housing-Authority-Residents-3-320.jpg)

![City’s neighborhoods and housing developments safer, with a specific focus on the fifteen housing
developments – including Queensbridge – that account for almost 20 percent of violent crime in NYCHA.8
Since the fieldwork for this study was completed, a number of additional initiatives related to findings from
the report have also been launched. For example, in fall 2014 the NYC Department of Housing Preservation
and Development’s Office of Neighborhood Strategies9 was created, and the City has implemented major
place-based initiatives in both East New York and Brownsville.10 Additionally, Mayor de Blasio has launched
a number of citywide initiatives that touch on themes raised within this report, including a major expansion of
after-school programming for middle school youth (SONYC), universal pre-kindergarten (Pre-K for All), and
a plan to significantly shift workforce development services in the city to better train New Yorkers for good-
paying careers (Career Pathways).11
NYCHA launched NextGeneration NYCHA in fall 2014 to actively engage communities in a collaborative
effort to develop plans that support the long-term sustainability of public housing. The process is bringing
together NYCHA residents, staff, community partners, and neighbors from three developments: Mill Brook
Houses in Mott Haven, Ingersoll in Fort Greene, and Van Dyke in Brownsville. As in this study, NextGen
NYCHA recognizes the central role residents have to play in identifying community needs and strategies to
address these needs.
CEO will continue to pursue research and evaluation to inform a variety of citywide initiatives and is
committed to the implementation and evaluation of strategies to meet the needs of NYCHA residents.
Evaluations of Jobs-Plus, a place-based employment program for NYCHA residents, are currently
forthcoming.12 Further research will broaden understanding in the field of the best ways to support strong
communities with opportunities for public housing residents and other low-income New Yorkers.
Jean-Marie Callan
Senior Program & Policy Advisor
David Berman
Director of Programs and Evaluation
8 NYC Office of the Mayor. Making New York City’s Neighborhoods and Housing Developments Safer. [Press Release] 8 July 2014.
9
The Office of Neighborhood Strategies works closely with communities to plan for new affordable housing and preserve existing
homes in a way that strengthens their surrounding neighborhoods.
10
NYC Department of City Planning. DeBlasio Administration and Council Member Garodnick Announce Two-Track Planning Strategy for East
Midtown to Foster Growth, Create Jobs, and Drive Critical Up-Front Infrastructure Investments. [Press Release] 30 May 2014; New York City
Department of Housing Preservation and Development. City, State, Federal Agencies, Community Partners and Developers Launch
Comprehensive Initiative to Jump Start Positive Change and Cooperation in Brownsville Community. [Press Release] 28 October 2014.
11 SONYC and Pre-K for All were launched by the Department of Youth and Community Development and Department of
Education in fall 2014. See NYC Office of the Mayor. New York City Launch ‘SONYC,’ Largest After-School Expansion for Middle School in
City’s History. [Press Release] 12 September 2014, and NYC Office of the Mayor. New York City Launches Historic Expansion of Pre-K to
More than 51,000 Children. [Press Release] 4 September 2014. In fall of 2014 the administration also announced Career Pathways, which
is being led by the Mayor’s Office of Workforce Development. See NYC Office of the Mayor. De Blasio Administration Announces
Overhaul of Workforce Development to Focus on Good-Paying Jobs, Skill-Building, and Strengthening New York City’s Economy. [Press Release] 21
November 2014, and read the full report: Career Pathways: One City Working Together.
12 CEO oversees Jobs-Plus sites across the City in partnership with the Mayor’s Fund to Advance New York City, the Young Men’s
Initiative, NYCHA, the Human Resources Administration, and the Department of Consumer Affairs’ Office of Financial
Empowerment. For more information see nyc.gov/ceo](https://image.slidesharecdn.com/finalreportrevised050615plusresponse-150522154705-lva1-app6892/85/The-Effects-of-Neighborhood-Change-on-New-York-City-Housing-Authority-Residents-5-320.jpg)


![RAPID ETHNOGRAPHIC ASSESSMENTS
Abt Associates Final Report (Draft) ▌pg. 38
prevention and homelessness), immigrant services, chronic illness, and workforce development. In
Morris Heights, BronxWorks operates a senior center that serves about 300 people, a child care center
serving 55 children, a homeless shelter serving 150 families, and a weekly farmers’ market.
BronxWorks also operates its broad-based outreach programs in Morris Heights to enroll people in
food stamps and health insurance, and to work on immigration issues.
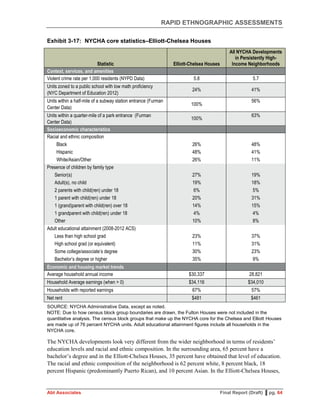
Economic Well-Being
Neighborhood unemployment registers at 20 percent and there were perceived to be few job
opportunities in Morris Heights. The area is predominantly residential with smaller stores such as
clothing outlets, bodegas, delis, pharmacies, and check cashing outlets. There is no major employer in
the immediate area and several residents felt that stores that were in the neighborhood were reluctant
to hire African Americans.41
Most of the working people we spoke to commuted to Manhattan—some said that in addition to there
being more jobs, the pay is better than in Morris Heights. Some residents did use the connections they
had within Sedgwick to find jobs in other neighborhoods. One young resident who worked at a
restaurant in Manhattan described finding a job there through someone he knew at Sedgwick who was
a manager. He went on to refer others from the neighborhood: “But I put a couple of people—because
like I said, we're like a family. I worked there for about a year and a half. And about 20 to 25 people
from here either work[ed] there and got fired or some of them still work there.”
Several residents felt that unemployment was due to a number of potential issues both coming from
and impacting residents. One young adult in a focus group felt that although it is challenging to find
jobs, some people in the community are choosing not to work. An 18-year-old criticized the
neighborhood environment as encouraging his peers to “sit around” rather than pursue opportunities
that do exist in the neighborhood: “There's opportunities to get jobs in the neighborhood, but then it's,
like, the neighborhood holds people back. You wake up and all you're going to do is sit around. That's
why I be, like, you got to get up out of here.” Older residents, by contrast, felt that the neighborhood
had fewer “job training programs [and] learning opportunities” than had been available in the past.
For older residents who had witnessed this change, it was more a lack of structured opportunities than
a lack of motivation that held back some young people.
Affordability was a concern for many Sedgwick residents since they believed that many of their
neighbors had limited incomes, either because they were retired or were on public assistance. In fact,
Sedgwick residents’ incomes on average are somewhat lower than their neighbors’ ($26,078 versus
$39,827) and there are notably more senior citizens living in NYCHA housing than surrounding
affordable and market-rate units (see Exhibit 3-3 and Exhibit 3-6).42
Several residents said that their
rents keep going up and that, while the development is supposed to be low-income housing, they see
41
Some stores in the neighborhood cater to Spanish-speaking clients but this issue was not confined to those
establishments.
42
In spite of these perceptions, having 8 percent of residents on public assistance in Sedgwick is lower than
the overall NYCHA average of 11 percent and the Bronx-wide average of 12 percent. As noted in the
introduction, how neighborhood change affects and depends on the share of older residents is an important
topic for future research.](https://image.slidesharecdn.com/finalreportrevised050615plusresponse-150522154705-lva1-app6892/85/The-Effects-of-Neighborhood-Change-on-New-York-City-Housing-Authority-Residents-57-320.jpg)
![RAPID ETHNOGRAPHIC ASSESSMENTS
Abt Associates Final Report (Draft) ▌pg. 39
it as middle-high income housing.43
Some connected these rising costs to larger economic conditions
in the country. One resident put it as, “the U.S. has lost touch with its own people. It’s too busy trying
to be high-class. If you ain’t got no money you are lost to the sauce.”
There are no banks in the area directly adjacent to the Sedgwick Houses, though there are some in the
neighborhood about a 10 minute walk away. One stakeholder noted that there is a credit union nearby
but the residents we spoke to were not familiar with it. Most residents reported using check-cashing
places or banks in other neighborhoods; some also stored their money at home. The residents who use
check-cashing places said they did so because they are more convenient than mainstream banks—one
resident said there are five in the neighborhood. Furthermore, you don’t need to set up a bank account
to use one, and as one participant put it, “when you’re on public assistance the bank will take all your
money,” presumably in account fees.
Most of our interviewees learned about managing money from other family members. Primarily, the
lessons they described from their parents were in the vein of “how to manage the value of a dollar,”
how to prioritize bill-paying, and to do so without help from others. One of our participants, a 24-
year-old mother who grew up in Sedgwick, described in detail how her mother modeled frugal
financial habits:
Sedgwick resident: “[M]y mother really made sure we held onto our money and made
sure we had—like if we had ten dollars, we had two dollars a day…. So her
managing our money, it showed us like that, we got to stretch this. I got to make sure
I have this for this day and this for this day, and if I need [inaudible] first, and
whatever bills you got you pay that first, and then you can play with your money. So
I guess my mother being strict about my money and [inaudible] and giving me
money when she felt like it—it helps. It definitely helped…. But now we got the
money to play with, but bills first. I definitely learned that. Saving money was
something I needed to learn.”
Finally, residents also discussed high unemployment as part of larger systemic issues. One young
person we interviewed said “with less jobs, people are more aggravated. Everybody will be outside
and that's when people bump heads. That's when crime comes. More jobs make everything better.”
Others felt that economic conditions in the neighborhood reflected a lack of investment in their
community. One interviewee discussed hoping that NYCHA could fundraise so the community could
have better playgrounds and after-school centers. As noted above, many residents were disappointed
by the closing of the child care center and hoped that it could be put to use, but were skeptical that
there would be resources available.
Quality of Local Schools
There are ten pre-kindergarten programs, eight public elementary schools including one charter, five
middle schools, and one high school in the Morris Heights area. Education appears to be a
43
NYCHA rents are set at 30% of a household’s gross income or the Flat Rent, which affects 30% of
residents who earn the highest incomes in NYCHA. Those rents are being adjusted upwards over five years
to bring those residents’ rents up to the 30% threshold. See
http://www.nyc.gov/html/nycha/html/residents/res_new_flat_rent.shtml.](https://image.slidesharecdn.com/finalreportrevised050615plusresponse-150522154705-lva1-app6892/85/The-Effects-of-Neighborhood-Change-on-New-York-City-Housing-Authority-Residents-58-320.jpg)

![RAPID ETHNOGRAPHIC ASSESSMENTS
Abt Associates Final Report (Draft) ▌pg. 42
For some residents, the availability of quality food and other retail was linked to other social and
economic issues facing the neighborhood. A public official reflected that in the past “businesses…felt
unsafe making deliveries here due to the high level of crime.” The official said: “Delivery people
would often get robbed or assaulted. But this has really changed, and the levels of crime have greatly
gone down.” Overall, the retail landscape was felt to be improving around Morris Heights compared
to the 1970s, 1980s, and 1990s.
Sedgwick resident: “The Gateway Mall is new: they have Burlington [Coat Factory];
Bed, Bath and Beyond; Toys 'R Us; Raymour & Flanigan; BJs…people in the Bronx
feel it's a blessing to have it, because now we don't have to travel down to 35th
Street. We don't have to travel up to White Plains, up to the Westchester mall on
Central Avenue, or go further up.”
The mall, formally the Bronx Terminal Market at Gateway Center, opened in a former wholesale
produce market next to Yankee Stadium. From Sedgwick Houses, it is about a half-hour walk or ride
by bus or train compared to closer to an hour to the alternatives this resident mentioned.
In spite of these incremental changes in the broader area, participants in this research pointed out
continuing systemic problems in the neighborhood. One woman, for example, believed the quality of
the food was poor because the area was heavily minority and retailers systematically do not prioritize
serving minority communities. In addition to systemic issues, there were more localized issues around
race and retail in the neighborhood: another resident mentioned that she did not like to shop at one
local supermarket because they “didn’t hire any black people when they came here.” More generally,
there was agreement, including from a staff member of a job placement agency, that local stores do
not employ neighborhood residents.
Quality and Use of Neighborhood Amenities Such as Parks
There are four playgrounds, handball courts, and basketball courts on the development grounds; these
facilities are captured in our statistical measure that shows 99 percent of Sedgwick Houses being
within one-quarter mile of a park. Within the last year, residents had also planted community garden
plots in one of the common areas. The largest park in the area, about three-quarters of a mile from
Sedgwick, is Roberto Clemente State Park, with facilities that include a pool, riverfront park, picnic
areas, and sports fields. Another park in the area was a just-completed (but not yet open) “mosaic
park” created by the DreamYard arts education organization. Residents appreciated many of the
amenities in the parks, such as the pool at Roberto Clemente State Park. The neighborhood consensus
however, was that park quality and recreation opportunities are lacking around the Sedgwick Houses.
One public official explained that the community district in which Sedgwick is located (Bronx
Community District 5) has among the fewest parks and green spaces of all community districts.
Residents rated the quality of their parks fairly highly but also noted that they had various drawbacks
and sometimes posed dangers.
The central courtyard at the Sedgwick Houses is flanked by benches on two sides and houses a
playground similar in size and equipment variety to those on other NYCHA campuses. The research
team rarely saw children playing on the equipment, which all had some chipped and peeling paint.
Some days a single man would be doing pull-ups on the bars adjacent to the playground. More often
the team observed children playing in the apparently newer parks at the back of the NYCHA campus
complex and this was the only park where our community partner takes the children who attend its
nearby day care. This park has newer-style structures made of hollow pipes painted red, yellow, and](https://image.slidesharecdn.com/finalreportrevised050615plusresponse-150522154705-lva1-app6892/85/The-Effects-of-Neighborhood-Change-on-New-York-City-Housing-Authority-Residents-61-320.jpg)
![RAPID ETHNOGRAPHIC ASSESSMENTS
Abt Associates Final Report (Draft) ▌pg. 43
blue. The floor of this park was also soft black tar providing extra protection for the children who
play in it, as well as a tall fence. Right next to the park there were handball and basketball courts,
which young adults use frequently. Regarding other facilities, residents generally agreed that parks
need updating and improvement.
Residents varied in the ways they use the parks, largely based on whether they felt safe or perceived
themselves as having other options. In the daytime, site staff and residents gathered on the benches in
the courtyard to rest or socialize. In the afternoons and evenings, teenagers and young adults hang out
in this park. They felt that it was becoming harder for them to hang out in the park because of the rule
that adults must accompany a child—and because they knew people who got in trouble for hanging
out in the park—but that there was “nowhere [else] to go.”44
Several residents, both senior citizens
and parents of young children, felt strongly about avoiding the parks. These residents did not feel that
the parks were safe; in particular, one parent was very concerned about taking her child there because
people sometimes use drugs in the park. It was important to many parents to keep their children out of
the parks so they would not end up using or selling drugs.
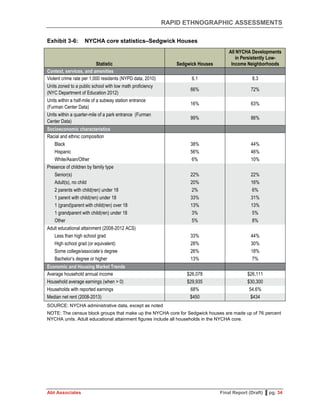
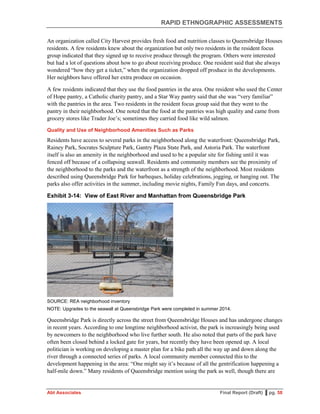
About a five-minute walk away, a new park was finishing
construction during our fieldwork. Through the efforts of the
DreamYard project, Hayden Lord Park was in the final stages
of installing tile mosaics on nearly every surface—entrance
columns, sidewalk, and the long wall flanking the block-long
playground. Located on property owned by an affordable
housing developer, the park is gated but open to the public
during specific hours. Stakeholders and our community partner were very excited about this project
but residents did not seem aware of it, possibly since it was not yet open.
Stakeholders we interviewed agreed that Roberto Clemente State Park has many desirable amenities,
including a pool that “everyone” uses in the summer. It is also, however, a dangerous trouble spot for
young people from Sedgwick to visit. Myriad people, including stakeholders and our community
partner staff, explained that there are relatively frequent shootings in the summer in Roberto
Clemente Park because of drug dealing and turf wars among gangs. One stakeholder explained that
the turf wars in the larger area prevent young people from taking full advantage of the recreational
opportunities in the neighborhood because there is “no safe passage” from the east to the west sides of
the neighborhood. Interestingly, no residents described problems in this park.
Crime and Safety
One of the most remarkable changes in the neighborhood, according to our respondents, is the
improvement in public safety over the last quarter century. During one of the research team’s
neighborhood walks, a local business owner gave us a tongue-in-cheek “history lesson” on how the
neighborhood had changed: “You’re not wearing a bulletproof vest!” This story is not meant to be a
substitute for historical facts about crime levels but rather to illustrate the powerful and prevalent
storytelling about the neighborhood’s reputation. One six-year resident, who considered herself a
44
A sign listing park rules was posted on a playground fence but residents also described knowing the rule
through word of mouth and past experience. Young adults were often in the park during fieldwork.
Key Finding
Morris Heights was
reported to be remarkably
safer than 25 years ago.
Certain places and times of
day feel less safe, but
Sedgwick is generally felt
to be a quiet development.](https://image.slidesharecdn.com/finalreportrevised050615plusresponse-150522154705-lva1-app6892/85/The-Effects-of-Neighborhood-Change-on-New-York-City-Housing-Authority-Residents-62-320.jpg)
![RAPID ETHNOGRAPHIC ASSESSMENTS
Abt Associates Final Report (Draft) ▌pg. 44
newcomer to the neighborhood, explained how the development’s history still impacts everyday life
in the development:
Sedgwick resident: “Yeah, the police will come in here first—if something out[side
the development] happens, they'll come in here first. So that must mean that this
place used to be bad. But I just can't say oh yeah, I know it was bad because I wasn't
living here then. And so far, in this little six years that I have been here, it's not been
bad. It's not been bad.”
To the degree this reputation of Sedgwick Houses being dangerous persists, residents felt that it is
unwarranted. They felt that the neighborhood is fairly quiet and low crime, especially compared to the
past and to a state-run middle-income development (a Mitchell-Lama property) called River Park
Towers. This area was universally reputed to be “very bad.” In one of our focus groups, the River
Park Towers came up and everyone responded in unison, “You don’t go there!” These two points of
comparison, neighborhood history and other low-income housing, are what residents point to when
they explain that the neighborhood has gotten “more subtle” and is “not bad” today.
Crime statistics bear out residents’ assessment: the violent crime rate in the Sedgwick neighborhood
is 6 per 1,000 (Exhibit 3-6). This rate is notably lower than the average of 9 per 1,000 that is typical
of low-income neighborhoods citywide. The crime rate around Sedgwick is, in fact, in line with the
rate observed for high-income neighborhoods in the city.
Residents generally felt safe within the grounds of Sedgwick and most agreed that as long as you
know some people in the community, the community is safe and people are looking out for one
another. Most were under the impression that if they kept to themselves, no one bothered them. Most
also believed that if something were to happen, their friends and neighbors would come to help right
away. One NYCHA staff member felt the reason crime was low in Sedgwick was because, “there are
no other NYCHA houses around here,” meaning there were no “turf issues” to start altercations.
There were caveats about how safe residents felt the neighborhood to be. In particular, respondents
noted that although the area is quiet during the day, it gets “rowdier” in the evenings and several
people cautioned the research team to leave the neighborhood before dark. Some residents we
interviewed said they didn’t leave their apartments after a certain time, or thought that more
vulnerable members of their families (senior citizens, children) should stay inside after a certain time.
Residents also described parts of the development that felt unsafe, particularly the basketball courts in
the back of the development. Residents complained that the lights there were never on, and that
without the lights on, “someone will get mugged over there.”
Tenant patrols, in which residents sit in lobbies to deter and report illegal activity, were one tool that
long-term residents felt had kept the community safe in the past, even though they were most active
when the neighborhood was less safe overall. Older residents felt that there was less trouble within
the development when tenant patrols were active. Some residents attributed current issues in the
neighborhood to the lack of foot patrols and fewer “verticals” where two police officers ride the
elevators to the top of the building, then take separate stairways all the way down to the ground floor.
They attributed these changes to reforms made under Mayor Giuliani that combined the NYCHA
police with the NYPD. Although many of those residents had acknowledged that crime had decreased
(which may be why the patrols were no longer active), they felt that the decrease of tenant patrols](https://image.slidesharecdn.com/finalreportrevised050615plusresponse-150522154705-lva1-app6892/85/The-Effects-of-Neighborhood-Change-on-New-York-City-Housing-Authority-Residents-63-320.jpg)
![RAPID ETHNOGRAPHIC ASSESSMENTS
Abt Associates Final Report (Draft) ▌pg. 45
represented less of an effort to look out for one another. On the other hand, some young adults felt
that the tenant patrols were bothersome to young people who had not been doing anything wrong.
A bar located across the street from Sedgwick on University Avenue was almost universally cited as a
problem for the development. According to residents, the club is largely patronized by people who
live outside the neighborhood, and fights from inside the club spill out onto the street and sometimes
onto development property at night. One man explained what he felt was the misperception of
conflating the club outside the development with what goes on inside:
Sedgwick resident: “There's no shootings every day [in Sedgwick]. There's no
robberies like that. Most of that stuff happens outside. It's usually right there where
the club is...certain tenants [are] trying to protest to get them to close the club down
or move it because it's bringing trouble here. I lost a friend last September from that
club. A guy came out that club and shot at the [inaudible]. Shot him in the leg, hit an
artery, and killed him.”
This man was not the only participant to describe violence originating at the club. Despite the
intensity of problems residents blamed on the club and the efforts some have made to get it shut
down, they felt that “we have no one backing us up” and “we try to call in citizens’ arrests but the
cops never come.”
Conclusions
Morris Heights has not changed significantly in terms of income; however, in other ways it is a
neighborhood in flux. After devastating struggles in the 1970s and with the effects of crack in the
1980s, changes to the crime rate, rehabilitation of housing, and increases in retail and amenities are
improving residents’ experiences in their neighborhood. Sedgwick residents generally felt safe in the
development and violent crime in the neighborhood is lower than in other persistently low-income
neighborhoods. Landlords have been working to renovate affordable housing complexes in the
neighborhood since the late 1980s. Though residents seem to appreciate these improvements, the
neighborhood still lacks access to mainstream financial services and, in spite of increasing options, it
also still lacks quality groceries that are also affordable and healthy restaurants. Several residents said
they think these gaps in neighborhood services are because the neighborhood is heavily minority.
Neighborhood residents continue to struggle with unemployment, few job opportunities, and
relatively few strong community-based organizations to help them advocate for their needs. Many
programs were reported to have been defunded, such as the Sedgwick day care center, some
Sedgwick community center services, and other youth development and education programs.
Residents are frustrated that, despite the strong need for and community support of organizations and
programs, they do not expect them to materialize.
Several community members from the NYCHA campus and surrounding neighborhood expressed an
expectation that the changes they are seeing will accelerate and their neighborhood will be the next to
gentrify. Those who expressed this sentiment seemed to feel it was an inevitable development but,
aside from a couple of mentions of fear of displacement, did not express specific ideas about how
such a change would affect them.](https://image.slidesharecdn.com/finalreportrevised050615plusresponse-150522154705-lva1-app6892/85/The-Effects-of-Neighborhood-Change-on-New-York-City-Housing-Authority-Residents-64-320.jpg)


![RAPID ETHNOGRAPHIC ASSESSMENTS
Abt Associates Final Report (Draft) ▌pg. 51
organizations to be geographically somewhat isolated, making that campus also a distinct
environment.
Queensbridge residents we interviewed shared a host of issues about maintenance of the development
that negatively impact their quality of life. These issues were top of mind for most residents when we
asked about life in the neighborhood, reflecting again the profound effect, both positive and negative,
the NYCHA campus has on how residents think about their neighborhoods. Residents were
unanimously unhappy about the scaffolding around their development, which one of our community
ethnographers noted had been around the buildings for more than 10 years. A couple of residents felt
that the scaffolding compromised personal safety.
Additional issues related to the physical quality of the campus emerged frequently in interviews with
residents. A number of residents also said that the developments had a rat problem, especially during
the summer. According to one resident, residents call NYCHA “all the time” about the rat problem
but he felt like their solution to the problem, filling holes with wood chips, was ineffective. Residents
also reported lengthy waiting periods for indoor maintenance, both regarding common spaces and
within apartments. Residents felt there used to be fairly quick responses, but now they describe waits
of up to multiple years to get something like a sink fixed. At times, residents felt they had to take
maintenance matters in their own hands. For example, residents mentioned that residents have fixed
the basketball rim countless times, and they fixed a door damaged in a police raid. A couple of
residents felt that the grounds were maintained but that the insides of the buildings were dirty,
including elevators.
The research found evidence of a sense of community among residents in the Queensbridge Houses.
Several residents spoke about “sticking together” if “something
happened” in the neighborhood. A 17-year resident said
“everybody stands together here…it’s like one whole unit.” He
explained that even if residents did not see or interact with each
other, people would “lend a helping hand” if “something was to
go down,” whether they knew each other or not. Even though
residents don’t know everyone in the large development, they
are familiar with the faces of residents they see on a daily basis.
A young 12-year resident described the community as “very
family oriented,” explaining that families in the developments
support each other “when they’re down.” She added that she
only knew about the area that she lived in because Queensbridge is “a large place.” A lifelong
resident said that generally, people are familiar with the youth in their buildings and they make efforts
to reach out to them if there are any issues.
Queensbridge resident: “Everybody is—I'll tell you, everybody you look [at] in the
building are familiar with your kid, they make sure they're safe. They see any kid
fighting outside; they come out and stop it. They don't fight. They sit down and talk
to him, because every day—you see each other's face every day.”
Although these residents did not describe how the NYCHA community “stuck together” in great
detail, a couple of examples shed light on how the community residents support each other. A
resident said that the Queensbridge community takes care of its seniors and children. She described
how the community came together during the last blackout to “take care of each other,” with residents
Key Finding
While some NYCHA
residents appreciate recent
improvements to the
neighborhood’s parks,
transit, and grocery
options, they feel that
condo residents—and not
NYCHA residents—are the
impetus for the changes.](https://image.slidesharecdn.com/finalreportrevised050615plusresponse-150522154705-lva1-app6892/85/The-Effects-of-Neighborhood-Change-on-New-York-City-Housing-Authority-Residents-70-320.jpg)
![RAPID ETHNOGRAPHIC ASSESSMENTS
Abt Associates Final Report (Draft) ▌pg. 52
congregating in the street for an impromptu gathering to share food and look after the children in the
development. A second-generation resident said that people in her Queensbridge building “look[ed]
out for each other,” informing neighbors about events for children or the wider community, such as
City Harvest events.
An Astoria resident commented on the Queensbridge Houses, saying that she sees a “difference” in
the Queensbridge Houses because they have “a lot of unity, love for each other.” She said she has
observed this aspect of the community growing up in the neighborhood and going to “Queensbridge
schools.” According to the resident, the residents of the Queensbridge Houses are vocal about needs
in their community. She felt that Astoria residents did not rally together to reopen the development’s
community center and thinks it was a “shame” that efforts were spearheaded by an outside
organization rather than the community.
Astoria resident: “Queensbridge speaks up more. [They’re] not afraid to say, ‘We
want this.’ That’s why they have laundromats, community centers, [and a] credit
union. Our community center was closed down…now [a nonprofit] took it over….
The community organization serves [the] Astoria Houses, do things for children [and
provides] summer services for free. Shame that people couldn’t stand up for it, so
someone else had to.”
Reflecting these statements about a vocal, organized community, Queensbridge residents spoke
highly of the development’s tenant association. A second-generation resident said, for example, that
the Queensbridge tenant association president was “very fervent about unity and getting the
community back to where it was—safe [and] clean [with] opportunities for youth.”
Residents also felt that some aspects of their community lacked community connectedness. The
lifelong resident who spoke about adults defusing fights among youth noted that residents generally
“don’t want to get involved” with incidents in the neighborhood, especially if they involve conflict
between neighbors or physical danger:
Queensbridge resident: “Somebody gets shot, or get hurt, it's like they don’t want to
get involved, because they're trying to stay out of it, because they don’t want
anybody to say, oh, you snitched.”
Those who talked the most about intervening, such as breaking up fights or drug activity, or even
rallying kids for basketball, were men who had lived in Queensbridge their whole lives. It seems that
both the length of their tenure and gender gave them a greater sense of safety and ability to intervene
in what they perceive as negative activity in the NYCHA community.
Other residents felt that, despite coming together in emergencies, residents were not unified enough
on an everyday basis. Although a 28-year resident felt that people in the community supported each
other “when something happens,” he said that he didn’t feel there was “enough unity in the
community” because “everyone still fights each other.” Another resident disagreed with a comment
about the “unity” among the Queensbridge Houses residents. Although she felt that she would help
out her neighbors in a time of need, she has observed that disagreements exist between pockets of the
development. A 42-year resident directly challenged the notion that the community stands together on
issues. Although he says that the community frequently complains about issues, he feels that no one
stands up to initiate change. He said “people knock down those who speak up because of personal
vendettas.” He also found it frustrating that in the cases where people have stood up on issues of](https://image.slidesharecdn.com/finalreportrevised050615plusresponse-150522154705-lva1-app6892/85/The-Effects-of-Neighborhood-Change-on-New-York-City-Housing-Authority-Residents-71-320.jpg)
![RAPID ETHNOGRAPHIC ASSESSMENTS
Abt Associates Final Report (Draft) ▌pg. 53
widespread concern, “there’s no follow [through]” and he hasn’t seen any results. In particular, this
resident cited a lack of action to remove the scaffolding around the buildings, ineffective policing that
harassed innocent people but missed criminal activity, and politicians he believed come to
Queensbridge “for a photo op and then we don’t see them [again].”
Another negative aspect of the community has to do with youth getting involved with drugs and other
street activity. According to a lifelong resident, youth in the community see adults “showing off” by
selling drugs and they try to emulate their behavior to “make a couple dollars.” One resident told us
that he took a year off from college, but when he hung out in the neighborhood he “had to look at
drug dealers and stuff like that to let me know I don’t belong here.” That motivated him to recommit
to his studies. One young woman felt that the development can “stunt growth” and that residents often
“get stuck in this area.”
Residents of Queensbridge spoke often about the lack of social programs in the neighborhood,
especially for children and teenagers, and how they believe these resources have decreased over time.
Several long term residents mentioned that in the past they had gotten to know each other through
programs located in the development—one woman mentioned getting to know people when her son
attended day care in the development. A young adult we spoke to mentioned that going to the
community center growing up was how she got to know most of the people in the neighborhoods. She
added, “when you build around [activities] like kids would enjoy doing, like dancing or the arts or
just the sports, if you build around that in the neighborhood, I feel like it would be a better
neighborhood.” This young woman specifically mentioned a positive experience doing a dance
program at a community center that is no longer active. During our fieldwork, residents described
how options like these had greatly dwindled and the negative impact it had on the development. The
woman who danced at the community center described the type discussion that generally occurs
among neighbors about enrichment programs for children:
Queensbridge resident: “I honestly believe that they've cut a lot of programs out of
the Housing Authority…. When I speak to the neighbors and some of the neighbors
who have kids and I ask them what happened to this program and what happened to
that program, they all tell me that they're not around—budget cuts or some issue
where they have cut a lot of the kids’ programs…just activities that they can be
involved in instead of being in the street or at home watching TV or just watching the
wrong things.”
Although she noted that there still is an after-school program, she was among several who reported
believing there had been significant cuts to NYCHA programs and felt the development would be
improved with better programming. In her view, it is vital to have cultural and recreational options
like these in the neighborhood because she believes parents in the developments struggle to pay for
the kinds of activities and lessons they want to give their children; they might even struggle to pay the
$2.50 fare each way for a child to ride the subway to an institution in Manhattan for such a program.
One lifelong resident described there being nothing around for kids now—kids just come home and
play on the basketball courts because there are few organized activities. He and several other “big
brothers” encourage kids to play in informal basketball games. One man recalled that there was a
short-lived basketball program run by an NBA player who grew up in Queensbridge, and he
wondered why it stopped running. While residents did not always specify the exact structure of
programs they were referring to, there was an implication that many of the programs (though not the](https://image.slidesharecdn.com/finalreportrevised050615plusresponse-150522154705-lva1-app6892/85/The-Effects-of-Neighborhood-Change-on-New-York-City-Housing-Authority-Residents-72-320.jpg)

![RAPID ETHNOGRAPHIC ASSESSMENTS
Abt Associates Final Report (Draft) ▌pg. 57
their children or family members attended a charter school in
the area. One resident observed that the “runners and bikers,”
usually meaning higher-income and white residents who use
the park, send their children to charter schools. Residents had
mixed perceptions about the quality of local schools, but many
felt they had improved. A lifelong resident said that when her
parents attended Long Island City High School, they did not have half-day programs that are
available today to allow students to have jobs and internships. A resident of 42 years said that his
former middle school, IS 204, did not have a sports team when he was student. In addition to sports
teams, the school has added academic support via Saturday school, an extra day for students to come
to school for extra help. One of the CEs also said that she heard that the school was “getting better.”
Attending a school in the neighborhood seems to be particularly important in building community ties
among youth. Several residents we interviewed described how they felt they were less a part of the
neighborhood because they had not attended the local schools. In response to an interviewee sharing
that his mother did not send him to schools in the area, one of our community ethnographers said,
“That means you're from the neighborhood, but you're not from the neighborhood.” The resident
agreed with this statement and said that this was the reason he was never involved in community
activities and did not make friends in the area until he was almost out of high school.
Several residents felt that additional educational programs were needed for children in the
community. These programs were proposed as a way either to keep children safe and engaged or to
emphasize the importance of school.
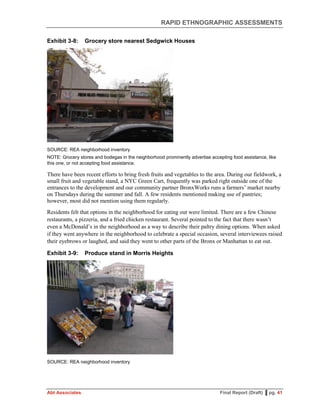
Quality and Cost of Food in Local Stores
Many residents felt the quality of food in their immediate neighborhood is poor and overpriced. In
particular, a few residents pointed out that they never bought
meat at the Associated Supermarket near the Queensbridge
Houses because it was close to rotten. Most residents tend to
venture outside of their immediate neighborhood to buy
groceries. Residents either walk or take the bus or subway for
their grocery shopping. Proximity to a well-connected transit
system allows residents to travel outside of their immediate
neighborhood to find better-quality groceries at a lower cost.
Queensbridge resident: “You got to go a little bit, get on a bus…jump in cab because
we have the availability or the comfortability of the access to the buses, trains…cabs.
So you got to go out of the community to get fresher or better produce.”
In a focus group, several residents noted that it’s more difficult for Astoria Houses residents,
particularly elderly residents, compared to Queensbridge and Ravenswood residents to access quality
groceries because of the lack of transit options. The residents perceive some disparity between the
quality and type of groceries that are immediately available to them versus what is available to the
“runners and bikers” of the neighborhood. An 18-year resident felt that produce was better at the
Associated Supermarket “down 21st
Street” versus the one located near the Queensbridge Houses
“because that Associated is near a lot of those condo buildings and it’s not [near] a lot of us [from
NYCHA].” Additionally, healthier fare and organic produce are available outside of the immediate
neighborhood.
Key Finding
Residents have trouble
finding good-quality
groceries, and notice that
the quality is higher in new
stores catering to new
residents buying condos.
Key Finding
Attending a school in the
neighborhood is important
for building community ties
among youth.](https://image.slidesharecdn.com/finalreportrevised050615plusresponse-150522154705-lva1-app6892/85/The-Effects-of-Neighborhood-Change-on-New-York-City-Housing-Authority-Residents-76-320.jpg)


![RAPID ETHNOGRAPHIC ASSESSMENTS
Abt Associates Final Report (Draft) ▌pg. 66
Residents spoke of connection within the developments, and
frequently noted “the people” in the community as one of its
strengths. Several noted that community connectedness felt
stronger when they first moved to the neighborhood, even as
recently as 2000, saying that, “everybody was looking out for
everybody.” Others, including some who moved in less than 10
years ago, felt that this sense of community remained and that
neighbors are friendly.
The consensus among NYCHA residents was that they feel
very positive about their neighborhood, its amenities, and
usually about their ties to their neighbors. One long-term
resident encapsulated many people’s sentiments about living in the neighborhood.
Exhibit 3-18: Affordable mom-and-pop store in Chelsea
SOURCE: REA neighborhood inventory
NOTE: A popular store for Elliott-Chelsea residents identified by one community ethnographer as “a comforting
environment” where residents call the store by the name of the original owner and his son. NYCHA residents and
neighborhood activists cite affordable stores like this one as being endangered by the real estate boom in
Chelsea.
Elliott-Chelsea resident: “We have Whole Foods, Trader Joe’s as well. I grew up in
uptown. It’s a totally different environment [there]. I feel very safe walking [here] at
every hour…transportation is good…. People go bonkers [when I tell them I live in
Chelsea]…they just love Chelsea…you’re in the middle of everything…. I would
never move out of here.”
The downsides for NYCHA residents in Chelsea, however, are decreasing affordability and the
inconveniences of living in a neighborhood with “too many attractions” for tourists and visitors from
other neighborhoods. Throughout our research, we found a tension between residents’ excitement
about the range of cultural and enrichment opportunities in the neighborhood—especially the High
Key Finding
While NYCHA residents
appreciate many of
Chelsea’s amenities, there
is an undercurrent of fear
of being displaced. Even if
their rents remain
affordable, rising costs of
everything around them
can feel like pressure to
leave the neighborhood.](https://image.slidesharecdn.com/finalreportrevised050615plusresponse-150522154705-lva1-app6892/85/The-Effects-of-Neighborhood-Change-on-New-York-City-Housing-Authority-Residents-85-320.jpg)
![RAPID ETHNOGRAPHIC ASSESSMENTS
Abt Associates Final Report (Draft) ▌pg. 67
Line, discussed below—and a sense of displacement within their own neighborhood as it is rapidly
changing to serve tourists and very wealthy new residents. In addition to tensions felt by NYCHA
residents, stakeholders spoke of the important role of the Penn South cooperative and its residents as
standing up for the need to keep Chelsea affordable for moderate-income New Yorkers.
NYCHA residents spoke very differently about the “neighborhood” within the development and the
larger surrounding neighborhood. As the neighborhood has undergone significant changes in recent
decades, this division seemed to have become sharper. Many NYCHA residents noted that with the
increasing new development in the neighborhood, the physical landscape has changed, and the new
businesses are not seen as being places for local residents. In particular, the closure of mom-and-pop
establishments that catered to NYCHA residents—such as laundromats, Chinese restaurants, and
delis—due to rising commercial rents and their replacement with art galleries was a major theme in
how residents experienced the turnover in the neighborhood’s character.
As one eight-year Fulton resident put it, “with them removing a lot of the familiar businesses…and
putting in these new high-end stores…and these useless art galleries, a lot of people in our community
feel like there’s less options around them as far as being able to go out,” and “interact with other
people in the community that are outside our development.” In part, this may be due to trepidation
and misinformation about galleries. One resident of nearly 20 years had only gone into a
neighborhood art gallery for the first time the week we interviewed her because “my daughter needed
to do like a photography project from the school. We need to pay, I’m afraid. [Inaudible] $50. But no.
We went in and it was for free. And I said, they should let us know that it's free so we get to come
more.”
Some residents clarified that they do not generally oppose art galleries; however, the sentiment that
galleries are “useless” points out that they are replacing businesses that served everyday needs. One
resident in a focus group voiced her feeling this way: “There’s a gallery on every block of
Chelsea…they’re everywhere…. It’s nice art and we get it but why like 25…. Let’s put things in that
the community needs. We don’t need galleries. There used to be a deli…. The people who used to
make it affordable for us.” Our CEs and partners also pointed out on neighborhood tours one
shuttered laundromat and another one that had lost half its machines to allow a restaurant next door to
expand.
Instead of stores that serve locals’ needs, residents felt that establishments in the neighborhood are
geared toward outsiders. One 14-year resident of Fulton Houses described her frustration with the
influx of tourists.
Fulton resident: “Chelsea Market, they [are] taking over the world so they got people
come from all over the world and when they come, they get off these big buses that
emit all kinds of just ugliness up in our windows…. And they just stumble off the bus
and bump right into you. They don't see you especially if you're black. They really
don't see you and they just walking along into you and they'll stop dead in front of
you and they start back. Oh, my goodness, I'm like, ‘let me in my house, please.’”
As the growth of tourist-attracting developments in Chelsea continue “taking over the world,” this
resident and others who contributed to our research feel increasingly isolated from their neighborhood
even as they appreciate some new aspects of it. Many described the growth of the art and luxury
markets in Chelsea as irrelevant to their lives. Or, as one resident put it in a focus group, “I’m not a
part of [the changes in the neighborhood]…because of my income, I’m not.” NYCHA residents and](https://image.slidesharecdn.com/finalreportrevised050615plusresponse-150522154705-lva1-app6892/85/The-Effects-of-Neighborhood-Change-on-New-York-City-Housing-Authority-Residents-86-320.jpg)
![RAPID ETHNOGRAPHIC ASSESSMENTS
Abt Associates Final Report (Draft) ▌pg. 69
Hudson Guild. Members of the research team and residents who
had moved from other areas contrasted the wealth of Hudson
Guild’s programs—such as its after school program, black box
theater, art gallery, network of successful program alumni, and
connections to local employers—to less robust options in other
neighborhoods where they had previously lived.
Economic Well-Being
Affordability in the neighborhood is a primary concern for many
residents, and NYCHA residents and stakeholders generally do
not feel that economic opportunity has increased as the
neighborhood has become more developed and expensive.
Residents have seen costs for basic needs such as rent and food
go up, and these costs are not matched by an equivalent increase in income or public assistance.
Although housing costs remain fixed as a portion of their income, some residents experienced the
other price increases as a pressure to move out. One senior citizen we interviewed was struggling to
get by on the public assistance she receives because the costs of everything around her have risen.
She reported that the public assistance office denied her an increase because she lives in a “high-
income bracket area,” which to her feels like they were effectively telling her to “get out of here” and
“move.” After describing how laundry costs have increased due to higher rent and utility costs for the
Laundry, one interviewee reflected, “It’s just so weird how people have minimum wage jobs, making
eight dollars an hour but everything else goes up but not the amount of money that you have to live
off of.” Residents have also observed that small business owners have moved out in the past due to
higher rents and other costs. Several spoke about the fact that the neighborhood is changing so fast
that it is hard for them to keep up financially.
The strong economic contrast between NYCHA residents (and some other long-term Chelsea
residents) and their higher-income neighbors came up frequently in our research. On average, a non-
NYCHA resident earns nearly four times as much as an average NYCHA household with income.
Residents often reported feeling that “they” are trying to push lower income residents out, so that the
neighborhood would reach a point where it’s only wealthier residents. Who “they” is varied in
residents and stakeholders’ comments—sometimes residents were referring to NYCHA policies and
the possibility of NYCHA selling or repurposing development land. “They” was used in contrast to
the “we” of the NYCHA resident community. This fear of displacement arose, for example, in an
animated focus group exchange when residents from Fulton and Elliott-Chelsea Houses described a
proposal to “build small apartments in a parking lot and where the dumpster is” that they connected to
“real estate people” who “probably want to break [Fulton Houses] down and privatize it.”
Even with the construction of designated affordable housing in Chelsea, several NYCHA residents
felt excluded from those developments because their incomes are not high enough to meet the
minimum threshold for affordable incomes, especially if they work in minimum wage jobs or if they
have negative events on their credit history.55
Overall, residents were well-informed about the
55
The proposed Chelsea and Fulton Houses infill projects were designed to be middle-income housing, not to
serve low-income tenants. However, its location on the site of the NYCHA developments may have raised
Key Finding
NYCHA residents feel
they do not have other
housing options in the
neighborhood.
Designated affordable
housing in Chelsea was
out of reach because
their incomes were not
high enough to meet the
minimum threshold or
high credit history
standards were a barrier.](https://image.slidesharecdn.com/finalreportrevised050615plusresponse-150522154705-lva1-app6892/85/The-Effects-of-Neighborhood-Change-on-New-York-City-Housing-Authority-Residents-88-320.jpg)
![RAPID ETHNOGRAPHIC ASSESSMENTS
Abt Associates Final Report (Draft) ▌pg. 70
requirements and application process but felt they were too restrictive. Among those residents was a
mother of three who worked full-time for $11 an hour. She described how the tensions between her
housing needs, her income, and the qualification standards for low-income housing disqualified her
from private housing options in the neighborhood. A community ethnographer asked if the woman
had considered applying for a low-income studio apartment, since she would have the best chance of
qualifying for it financially.
Fulton Houses resident: “[I] can't [apply for a studio] because I have to put my kids
on it…I might qualify for a three bedroom…. My income still doesn't meet what they
want for somebody with—the number amount of people that's going to be in an
apartment for that size of an apartment for the income that they want in between the
brackets. The income the brackets they have, I still don't even qualify.
Community ethnographer: “Also, because I think there has to be some apartments
out there.”
Fulton Houses resident: “Yeah. But then I don't want to move all the way to the
Bronx. I know nothing about the Bronx…. And another bad thing on my issue is that
my credit is bad. I don't have…evictions or nothing like that, but I had a couple of
credit cards that I didn't pay off. And I think that's another thing, too. You have to
have decent credit. So I guess that messes up—I messed up myself for that. But then
I think about it, too. Just because I didn't pay a credit card, why am I not going to pay
my rent? I don't want to be homeless. So if you mess up a couple of credit cards
when you was 18…you're really telling me I can't live here?”
Although some NYCHA residents were interested in the affordable units in the area and well-
informed about the process, they encountered multiple barriers, including the lottery application and
the income restrictions. Residents who were interested in moving felt that their only options were to
win the lottery for an affordable unit in the neighborhood if they met the narrow criteria, or to move
to outer boroughs with lower rents; neither option seemed appealing to those who discussed them.
While many residents did speak about the challenge of affordability in the neighborhood, and some
were stressed by rent increases, others felt that rent was proportional to what they earn and
appreciated that rent was scaled to their incomes. One mother we interviewed represents this
viewpoint.
Elliott-Chelsea resident: “The fact that [NYCHA] only charges me 30 percent of my
income for rent, that is a big thing. That's a huge thing because that's, like I said
earlier, a lot of people don't have that opportunity. A lot of people aren't pocket to
mouth. It's not—they…don't have that little window where they could put some
money away and save up for not even just a rainy day, but God forbid a death in the
family or something. They have that. People can't save up for those things easy. Not
regular working people.”
hopes and expectations. Residents also discussed the development of 80/20 buildings in Chelsea where 20
percent of units are designated as affordable and assigned by lottery.](https://image.slidesharecdn.com/finalreportrevised050615plusresponse-150522154705-lva1-app6892/85/The-Effects-of-Neighborhood-Change-on-New-York-City-Housing-Authority-Residents-89-320.jpg)

![RAPID ETHNOGRAPHIC ASSESSMENTS
Abt Associates Final Report (Draft) ▌pg. 73
some neighborhood residents to have “turned around,” in part because of the influx of higher income
families in the neighborhood. Specifically, the school has more of a “mix” of students now and
stricter academic policies.
Some residents commented that they appreciated the schools’ diversity, but others felt that staff
favored higher-income neighborhood residents. Some residents both within and outside of NYCHA
have expressed concern that with increasing numbers of families moving to the area, there is a need
for more schools.
The neighborhood also has several middle schools located nearby that serve students from across the
city. One is the NYC Lab School for Collaborative Studies, which is a screened school, meaning that
students have to meet admissions criteria based on the school’s focus and academic standards. It is
well regarded by some parents in the community, but not many students from the neighborhood
attend the school. The other is the Museum School, which is seen as getting better in recent years. A
stakeholder active in local politics explained that the middle and high schools are less connected to
the neighborhood than elementary schools because they are usually not based within the
neighborhood. Due to this, the stakeholder has observed that middle school students may attend
schools all over the city for which they compete for spots. This stakeholder feels, therefore, that both
the dispersion and competition undermine the sense of community between middle school students
and parents. Few other participants had reflections to share about secondary schools in the
neighborhood, which echoes the feeling that middle schools are less neighborhood-based. An
employee of one of the middle schools explained that she works to encourage more parents of color
and parents living in NYCHA to apply to help the school live up to its commitment to diversity. She
reported having to combat the discouragement that parents had experienced when applying to other
schools.
School employee: “A lot of your schools tell them not to apply. That’s an issue too.
Parents tell me that. I tell them, ‘I don’t care what your school told you, apply for the
school regardless. You have a right to apply no matter what your school tells you.’”
Moderator: “What do the schools tell them?”
School employee: “Some of the schools tell them that your child’s not, that you
shouldn’t apply for that school ‘cause your child will probably not get in. You don’t
tell anyone that, that’s your right as a parent. You can apply for any school you’d like
as long as you’re within this district…. I don’t think we have that many kids in
Chelsea [Houses] that go to [our school]. We have a few. We have some kids that
come from P.S. 11 and P.S. 33. And I’m ecstatic when I see them. Cause I know
what I’m going to be receiving. I want the school to look like New York City.”
Avenues: The World School, a private school that opened in 2012 across from the Elliott-Chelsea
Houses has garnered a lot of attention in the NYCHA community. The school’s mission is to create
an integrated “learning community” of 20 campuses in major cities around the world. Nearly
everyone interviewed was familiar with the school and its tuition, almost universally reported to be
over $40,000 per year. That tuition seemed especially stark to some residents because the school
abuts the Elliott-Chelsea complex across 10th Avenue. One resident also noted that the school brings
a lot of “different…richer” people to the neighborhood in the morning. Several key stakeholders
described conversations with Avenues officials, whom they felt were very good about trying to](https://image.slidesharecdn.com/finalreportrevised050615plusresponse-150522154705-lva1-app6892/85/The-Effects-of-Neighborhood-Change-on-New-York-City-Housing-Authority-Residents-92-320.jpg)

![RAPID ETHNOGRAPHIC ASSESSMENTS
Abt Associates Final Report (Draft) ▌pg. 75
been renovated. More often, residents felt that the local public parks were in average condition but in
need of updating, often using phrases like “I wouldn’t say that park was clean but it wasn’t
necessarily dirty either” or “It's a regular city park. It's not anything fancy, but it's not run down and
dilapidated.” Parents of young children, in particular, mentioned the need for safety updates—for
example, removing concrete and putting in padding under play equipment. Several residents
mentioned that they are afraid a basketball court used by teens will be taken away “to turn it into a
parking lot for the new condominiums they're putting up” as part of the larger push against low-
income residents in the neighborhood.
Most residents we interviewed reported making extensive use of the parks, especially the parents of
young and school-aged children. A mother of a four-year old described how important the park
outside her building is not only for her daughter but also for her to get to know her neighbors.
Fulton resident: “Well, on a regular day after school, I bring her home. She'll usually
play in the park by her building. Yesterday, we were behind the park that they want
to rip out and we were there yesterday. And they were running around and we just
hung out. I was talking to my friends. Well, another one of the children that goes to
her classroom”
Community ethnographer: “Parents?”
Fulton resident: Yeah. “Parents. We were hanging out and talking and the kids were
playing. It was a nice day and that's what we did yesterday.”
One parent, however, felt uncomfortable taking her children to the parks because she feels that is
where “grown people [are] not doing what they’re supposed to do in front of the housing
development. No. And I think maybe a year ago, a boy got killed right in front of there.”
As noted, Chelsea Piers is located a short walk from the Fulton and Elliott-Chelsea Houses. The
complex offers a wide range of facilities, including a driving range, ice skating rink, field house,
bowling, and gymnastics. Two long-term non-NYCHA residents pinpointed the start of the
neighborhood’s change to an affluent area with the redevelopment of Chelsea Piers complex in the
mid-1990s. NYCHA residents we interviewed had mixed feelings about Chelsea Piers. Several talked
about using the facilities at Chelsea Piers but almost as often noted that the area is expensive. One
mother’s description captures well the conflicting feelings of truly enjoying the facilities but finding it
difficult that they are expensive.
Elliott-Chelsea resident: “I wish they had some kind of discount—‘you live in
NYCHA, you only pay 50 percent’ or something. Chelsea Pier, oh my goodness. I
tried years ago for ice skating for my youngest daughter when she was, I think, 14.
Five hundred dollars like for three months. That would be fantastic…. And summer
camp, it's like $500 too [inaudible] when my daughters were younger. So we had all
of these nice places, but we cannot send our kids.”
For these parents, whose experiences were echoed in more general comments by others, there is a
tension between excitement about all the opportunities that exist in Chelsea but are not necessarily
accessible and affordable to NYCHA residents. One 14-year resident believed that the Police Athletic
League (PAL) has stopped operating in Chelsea, limiting the number of free sports opportunities in
the neighborhood.](https://image.slidesharecdn.com/finalreportrevised050615plusresponse-150522154705-lva1-app6892/85/The-Effects-of-Neighborhood-Change-on-New-York-City-Housing-Authority-Residents-94-320.jpg)

![RAPID ETHNOGRAPHIC ASSESSMENTS
Abt Associates Final Report (Draft) ▌pg. 77
residents of the two houses, and that some residents did not feel comfortable venturing into the other
development’s territory. Some of those we spoke to said that this “line” was less of an issue now, and
that they felt comfortable throughout both developments, but others say that this division persists.
Several residents said they felt safe in the developments because no one bothers them if they mind
their own business. At the same time, some local leaders attribute the development’s relatively low
crime rate to the fact that it is a close-knit community, and that when there is an occasional shooting
residents are engaged and well-organized in their response.
Some NYCHA residents tied the decrease in crime to the neighborhood’s gentrification. One five-
year resident said that she had heard Chelsea had more problems with crime in the past “and it’s
getting better because I guess the condos and co-ops they’re building around. So I guess that has a
different impact, too, on the community because it’s new people moving in. They [are] trying to
better, I guess, the community.” A few residents noted that when some mom-and-pop stores across
from the Fulton Houses closed, crime related to loitering decreased. However, other neighborhood
residents felt that in the context of the surrounding higher-income neighborhoods, the developments
were unfairly blamed for crime, which they said often originated at nearby nightclubs.
Conclusions
Chelsea has undergone tremendous changes in the last few decades. In addition to incomes rising
dramatically, the type of development in the neighborhood has made it more of a destination than a
place NYCHA residents perceive as catering to their needs. Many local establishments like
laundromats and corner delis that made the neighborhood affordable to NYCHA residents have
closed; even new affordable housing is out of reach to residents we interviewed making NYCHA
housing the only viable option for them in the area. Many NYCHA residents appreciate some of the
changes but do not feel fully integrated into the changing community, for example, disturbed by
crowds of tourists or unsure about visiting new establishments.
NYCHA residents do not feel they are benefitting economically from the neighborhood’s increasing
development, and are very concerned about affordability. There are well-organized efforts by Hudson
Guild, the tenants’ associations, and long-term residents to petition for community benefit agreements
and concessions from developers to keep the neighborhood more affordable. Despite these efforts,
there are no mechanisms to help affordable mom-and-pop establishments stay in business and few
jobs seem to materialize for residents in new establishments.
3.4 Conclusions from REAs
This section has presented findings from REAs in neighborhoods that illustrate the income trends
described in Chapter 2 of this report. Morris Heights, Long Island City, and Chelsea each have their
own unique history; however, we note similarities across the REA neighborhoods and trends
observable across the different settings. We also suggest that, given the careful selection of
neighborhoods for the REAs, these dynamics would be similar in other neighborhoods with similar
characteristics.
While the REAs sought to understand how NYCHA residents engage with their neighborhoods,
including areas surrounding the NYCHA development, in all three neighborhoods, the NYCHA
campus itself is residents’ primary reference point when asked about what their “community” is.
Researchers’ frequent need to ask residents about both “the neighborhood” (i.e., the development)](https://image.slidesharecdn.com/finalreportrevised050615plusresponse-150522154705-lva1-app6892/85/The-Effects-of-Neighborhood-Change-on-New-York-City-Housing-Authority-Residents-96-320.jpg)


![APPENDIX: STUDY DESIGN
Abt Associates Final Report (Draft) ▌pg. 97
applicable, such as a topless bar listed in one inventory as both a “place I avoid” and something “my
neighborhood needs less of.”
Public space observation and on-the spot-interviews
During both the neighborhood tours and neighborhood amenities inventory, as well as at other points
throughout the data collection period, CEs observed the public spaces on the inventory list using
observation protocols developed by the Abt researchers (see Appendix B). CEs also engaged a total
of 42 people in the public spaces in on-the-spot interviews using a short guide. Neighborhood
residents were asked what area they consider to be their neighborhood, how long they had lived in the
area and how it had changed in that time, what institutions they use in the neighborhood (such as
schools, parks, banks, and community centers), the community’s strengths and weaknesses, and basic
demographics. Non-residents were asked what brought them to the neighborhood that day, how long
they had been coming to the neighborhood and how it had changed in that time, how they would
describe the neighborhood to others who do not live there, and basic demographic questions.
Respondents to the on-the-spot interviews were hesitant to provide some demographic information,
usually about their approximate income and their household structure; these were also questions CEs
were less comfortable with and informed us were less appropriate to ask in their community. These
issues were also present to a lesser degree in household interviews.
Household interviews
Community ethnographers and Abt staff interviewed 23 residents from the target developments—8 in
Morris Heights, 7 in Long Island City, and 8 in Chelsea—about their experiences with neighborhood
over time. Residents lived in households with a variety of compositions including single- and dual
parent-headed, intergenerational, seniors, and young adults. All households were recruited
purposively through the connections of our CBO partners and CEs. We sought to interview household
with school-aged children, but this was not always possible. Residents ranged in their tenure in in the
specific development under study, from less than one year to over 40 years, giving us a varied and
deep view of neighborhood changes over time. Some had moved into their current neighborhood from
other NYCHA developments and were able to contrast their experiences from the old to the new
neighborhood, providing valuable perspectives on the specific role of the neighborhood in
individuals’ experiences and opportunities. Residents came from a variety of racial and ethnic
backgrounds, however all interviews were conducted in English due to the qualifications of the
research team, possibly limiting the representation of non-English speaking populations.
The interviews focused on the tenants’ connections to the community; work history and options for
economic advancement; and perceptions of the local schools, public and recreational spaces, food
outlets, and public safety. Questions included, for example:
“Tell me about when you moved into [House Name]. What was the neighborhood like?”
“How has [Neighborhood] changed since you moved in?”
“Tell me about jobs you’ve had since you’ve lived here.”
“Talk to me about crime in the neighborhood since you’ve lived here.”
“Where do you spend most of your time?”
The full interview protocol is included in Appendix D.](https://image.slidesharecdn.com/finalreportrevised050615plusresponse-150522154705-lva1-app6892/85/The-Effects-of-Neighborhood-Change-on-New-York-City-Housing-Authority-Residents-116-320.jpg)


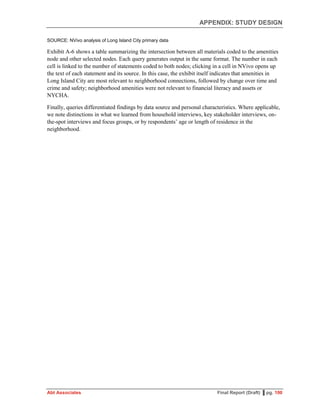


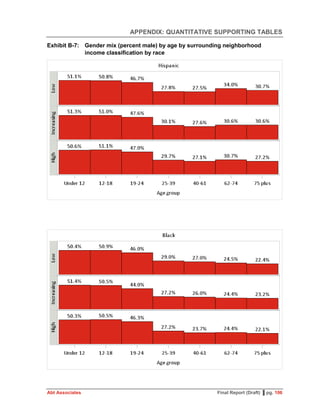


![REA RESEARCH INSTRUMENTS
Abt Associates Inc. December 3, 2013 ▌pg. 109
Appendix C: Research Instruments Used in Rapid Ethnographic
Assessments
Neighborhood Amenities Inventory On-the-Spot Interview Guide
Neighborhood Maps Used for REA Data Collection
Key Stakeholder Interview Guide
Household Interview Guide
Focus Group Discussion Guide
Neighborhood Amenities Inventory
Instructions to community ethnographers:
Spend up to 10 hours taking photos, writing notes, and uploading to the FTP site. Cover as many
categories as you can before you add additional photos in a category—for example, we prefer to have
2 photos in each category rather than 10 photos in one or two categories.
Please use the map of your neighborhood with the boundaries marked as your point of reference. For
all categories, take photos when it’s practical to do so. For each place photographed, mark it off on
the checklist and the map with a number. Write a brief note, description, or explanation about the
photo either while you’re out or after you get back. When you can’t photograph a place, please write
a note about it—what and where is the place and why you can’t photograph it.
Other Tips for Notes and Observations
In general terms, who is present in the public spaces (race/ethnicity/nationality, age, language, how
long people have lived there [if you know])? Who are they with? Do people seem to already know
each other? What activities are people doing? In general terms or with key phrases, what issues are
discussed? Who is not there?
When there are people in your pictures,
a) Try to get general scenes where the individuals aren’t easily identifiable. For example, avoid
taking pictures of people’s faces and other distinguishing features. (This protects their
privacy, even when they are in a public space.) OR
b) Get someone’s permission to take their photo for the study. (Some people may want to pose
for photos, or show you “the best thing about the neighborhood” or other things on your list.)
When you do this, tell the person what the study is, give them a Study Information Slip, tell
them it might be used in a focus group or a report, and get their permission to take the
picture. Show them the photo on your camera screen before leaving.
As appropriate, strike up conversations with people about what they’re doing and the neighborhood.
Use the guide below for on-the-spot interviews.
With any questions, problems, or need to talk about the process, contact Deena or Anna any time.](https://image.slidesharecdn.com/finalreportrevised050615plusresponse-150522154705-lva1-app6892/85/The-Effects-of-Neighborhood-Change-on-New-York-City-Housing-Authority-Residents-128-320.jpg)


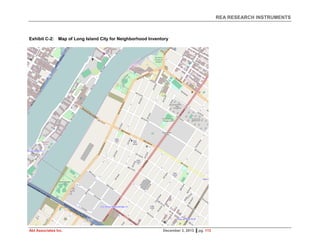

![REA RESEARCH INSTRUMENTS
Abt Associates Inc. December 3, 2013 ▌pg. 115
On-the-Spot Interviews During Neighborhood Inventory
Note: this protocol is adapted from Low, Taplin, and Lamb (2005) to fit this project’s research
objectives.
Intro: Do you live in this neighborhood?
Explain Project: I’m working on a research project for the City’s Center for Economic Opportunity
about how people use their neighborhoods. Can I ask you a few questions? It should take less than 5
minutes. Your answers can help the City understand the experiences of residents in
[NEIGHBORHOOD/DEVELOPMENT] and identify ways to serve the community. Your
information will stay private as we will not collect your name or identifying information about you.
And you don’t have to answer any question you don’t want to.
If no: alright; take care.
If yes:
Great—thanks! Here’s a sheet that explains our project and tells you who you can call if you have
any questions.
I’m working with [Hudson Guild/Urban Upbound/BronxWorks] and a research company called
Abt Associates to find out how this neighborhood has changed over time, how people use the
neighborhood, and how that affects life for residents, both those who live in public housing and in
other parts of the neighborhood. We’ll submit a report of our findings to the Center for Economic
Opportunity and NYCHA/New York City Housing Authority and on the neighborhood’s issues
and the experiences of residents.
If no, don’t live in the neighborhood:
1. What brings you to the neighborhood?
2. How long have you been coming to this neighborhood? Has it changed since you
started coming? If yes, ask how.
3. How would you describe this community to someone who doesn’t live here?
a. What are this community’s strengths and weaknesses?
b. What are the main issues facing this community?
c. Are there particular issues for residents of public housing?
4. Demographics:
a. Male or female?
b. How old are you?
c. How many people live in your household? Any children in the house?](https://image.slidesharecdn.com/finalreportrevised050615plusresponse-150522154705-lva1-app6892/85/The-Effects-of-Neighborhood-Change-on-New-York-City-Housing-Authority-Residents-134-320.jpg)


![REA RESEARCH INSTRUMENTS
Abt Associates Inc. December 3, 2013 ▌pg. 118
Key Stakeholder Interview Guides
Thank you and explain project: Thank you again for agreeing to participate in this interview. We are
studying the effect of neighborhood change on New York City Housing Authority residents for the
City’s Center for Economic Opportunity. We are studying have changed over time, how people use
the neighborhood, and how that affects life for public housing residents. We are looking at
neighborhoods where incomes have increased a lot, are currently increasing, or have remained low.
Based on your experience as [INSERT JOB TITLE OR RELEVANT EXPERIENCE] we would like to ask
you about the history of [house name] and [neighborhood]. We will be using this interview to inform
our research on the neighborhood’s history and services that are available to neighborhood residents.
This interview will last 30 to 90 minutes. We will be asking you about how the neighborhood has
changed over time, especially regarding economic opportunities, financial assets, local schools, public
parks, grocery stores, and public safety. Participation involves no significant risks to you. You can
choose not to answer a question at any time. You may also stop an interview at any time.
Your participation is voluntary. If you decide not to participate, it will have no effect on your
relationship with CEO, NYCHA, or any other organizations, including with BronxWorks, Urban
Upbound, or Hudson Guild. We will not share any information about you with anyone outside the
research team. The main risk in participating in this study is the accidental release of personally
identifiable information. However, the risk is small and the study will be taking precautions to
prevent this from occurring.
The information you provide in the interview will be kept confidential. With your permission, we will
take notes and audio record our conversation. Only members of the research team will hear the audio
recording, which will be used to supplement our notes. Your name will not appear in any internal or
published reports from the study. However, we would like to be able to quote you using under a
pseudonym. Would that be acceptable to you? Do you have a preferred pseudonym? If you would like
to be named (or have your experience/organization described), we ask you to sign an informed
consent form that gives us permission to name you.
There is no compensation for this interview and there are no immediate benefits to you. We expect
the results will help design better programs to help people access opportunities and resources in their
neighborhoods.
Would you like to continue with the interview? Great, thanks!
Here’s a sheet that explains our project and tells you who you can call if you have any questions.](https://image.slidesharecdn.com/finalreportrevised050615plusresponse-150522154705-lva1-app6892/85/The-Effects-of-Neighborhood-Change-on-New-York-City-Housing-Authority-Residents-137-320.jpg)
![REA RESEARCH INSTRUMENTS
Abt Associates Inc. December 3, 2013 ▌pg. 119
Background
1. Please tell me about your experience in this neighborhood. When did you first live and/or
work here?
2. Tell me about the jobs or community roles you’ve held in this neighborhood.
3. What do you think the boundaries of the neighborhood are?
Neighborhood History
4. Can you tell me a bit about the history of [neighborhood]?
a. What do you think are some of the key events in this neighborhood’s history?
b. In [House Name’s] history?
5. What have been the most important community groups or institutions over the years?
c. Here’s a list of non-profits working in this area that we were able to obtain from
NYCHA. Which of these organizations do you recognize? Are there any important
organizations missing from this list?
d. Can you tell us approximately when the most important organizations started
working here, and what’s changed in the last few years?
6. How has this neighborhood changed in the past 10-20 years?
e. How are new residents different than long-time residents?
7. How does [House Name] fit into the history of the neighborhood?
Neighborhood Strengths
8. What are the best things about [neighborhood]?
9. Why do people choose to live in [neighborhood]? Is this different for people living in
NYCHA housing and other housing?
10. What do you think [neighborhood] will be like in 5-10 years?
Local Issues
11. What are the most pressing issues facing [neighborhood] residents today?
12. What are the most pressing issues facing residents of [house name] today?
13. Are there any issues that have been particularly divisive in the neighborhood?
14. Are there any issues in which [house name] residents tend to feel differently than other
neighborhood residents?
15. How are the local schools?](https://image.slidesharecdn.com/finalreportrevised050615plusresponse-150522154705-lva1-app6892/85/The-Effects-of-Neighborhood-Change-on-New-York-City-Housing-Authority-Residents-138-320.jpg)
![REA RESEARCH INSTRUMENTS
Abt Associates Inc. December 3, 2013 ▌pg. 120
a. Do residents in the neighborhood tend to send their kids to the public schools? If not,
where do they send them to school? Do you think this is the same for both NYCHA
residents and other residents of the neighborhood?
b. When new people move to the neighborhood, are they generally sending their
children to public schools?
c. Based on your observations, how have the schools changed in the last 10-20 years? Is
there more/less parent involvement? More/less community outreach by the schools?
d. How closely do the schools work with NYCHA and [NAME] Houses? Are there
programs for NYCHA students or more general community programs, such as
tutoring and enrichment?
e. What about relationships between the schools and private groups that provide
enrichment for neighborhood kids?
16. How have crime and safety changed?
f. What do you attribute any changes to—and why? For example, increased policing,
neighborhood watch/resident complaints, better employment options in the
neighborhood, falling crime in general?
17. How have the retail options changed?
g. Who do new retail outlets cater to?
h. How do these changes affect public housing residents?
i. In particular, how have options for groceries, basic necessities, and banking changed?
Neighborhood Dynamics
18. Trying to generalize about the neighborhood, what are people’s relationships like with their
neighbors in [Chelsea/Long Island City/Morris Heights]? What about with the local
businesses, community groups, religious and other organizations?
a. Are any of these things more true for certain residents, like public housing residents,
other residents, parents of public school children, seniors, and so forth?
19. Is there anything in the neighborhood that really helps people form ties to each other or to the
neighborhood? Please tell me about that. (It could be anything, like people meeting to play
games in the park, a parents’ group, a local shop where people can hang out, a farmer’s
market, a festival—whatever helps bring people together.)
b. Now I want to know about the opposite: Is there anything in this neighborhood that
you think gets in the way of people forming ties to each other or to the
neighborhood? (It can be anything, from transit/traffic issues to having a lot of
tourists instead of residents, to bad stereotypes, not enough places to hang out, or
people’s work schedules—whatever makes it harder to build community here.)](https://image.slidesharecdn.com/finalreportrevised050615plusresponse-150522154705-lva1-app6892/85/The-Effects-of-Neighborhood-Change-on-New-York-City-Housing-Authority-Residents-139-320.jpg)
![The Effect of Neighborhood Change on New York City Housing Authority
Residents Evaluation Plan
Abt Associates Inc. December 3, 2013 ▌pg. 122
Household Interview Guide
Thank you again for agreeing to participate in this interview. We are studying the effect of
neighborhood change on New York City Housing Authority residents for the City’s Center for
Economic Opportunity. We are studying have changed over time, how people use the neighborhood,
and how that affects life for public housing residents. We are looking at neighborhoods where
incomes have increased a lot, are currently increasing, or have remained low.
We will be using this interview to document the experiences of residents in [NEIGHBORHOOD] and
[DEVELOPMENT]. You were chosen for this study because you live in a NYCHA apartment in one
of these three types of neighborhood. We would like to ask about how you and other members of your
household use your neighborhood and what you think of any changes in your neighborhood since
you’ve lived here.
This interview may last up to 2 hours. This interview will be one-on-one / conducted with the
individuals that you have chosen to be present (family members, neighbors, etc.). We will be asking
you about your experiences with the neighborhood over time, especially economic opportunities,
financial assets, local schools, public parks, grocery stores, and public safety.
Your participation is voluntary. If you decide not to participate, it will have no effect on your
NYCHA apartment, your relationship with NYCHA, or any other programs and services you
participate in, including with BronxWorks, Urban Upbound, or Hudson Guild. We will not share any
information about you, including your name and address, with anyone outside the research team.
Participation involves no significant risks to you. The main risk in participating in this study is the
accidental release of personally identifiable information. However, the risk is small and the study will
be taking precautions to prevent this from occurring.
You can choose not to answer a question at any time. You may also stop an interview at any time.
The information you provide in the interview will be kept confidential. With your permission, we will
take notes and audio record our conversation to transcribe. Only members of the research team and
the person doing the transcription will hear the audio recording. Your name will be replaced with a
pseudonym in the transcript. Do you have a pseudonym you’d like us to use for you?
Although your name will not appear in any internal or published reports from the study, we would
like to be able to quote you using under a pseudonym. If you agree to allow us to quote you in
publications, please initial the consent form in the appropriate place.
The compensation for this interview is $25.
Would you like to continue with the interview?
Great, thanks!
Here’s a sheet that explains our project and tells you who you can call if you have any questions after
this interview. [Include a copy of the consent form for stakeholders with name of project director,
principal investigator, Abt IRB contact]](https://image.slidesharecdn.com/finalreportrevised050615plusresponse-150522154705-lva1-app6892/85/The-Effects-of-Neighborhood-Change-on-New-York-City-Housing-Authority-Residents-141-320.jpg)
![The Effect of Neighborhood Change on New York City Housing Authority
Residents Evaluation Plan
Abt Associates Inc. December 3, 2013 ▌pg. 123
Thank you and explain project: Thank you again for agreeing to participate in this interview and
signing the consent form. As we mentioned, we’re working on a research project for the City’s Center
for Economic Opportunity about changes in the neighborhoods around public housing and how
people use their neighborhoods We would like to ask about how you and other members of your
household use your neighborhood and what you think of any changes in your neighborhood since
you’ve lived here.
General/Background Questions
1. I’d like to start by having you tell me about when you moved into [House Name].
a. How long have you lived in this apartment? What was [House Name] like when you
moved in?
b. Has the project changed since you moved in? How?
c. Have these changes had an effect on your life? What kind?
d. What do you think of [House Name]? Do you like living here?
2. In this project we’re really interested in learning about the neighborhoods around NYCHA
housing. What do you think of as your neighborhood? (What are the streets or landmarks that
define the boundaries of your neighborhood?)
a. What do you think of [neighborhood]? Do you like living here?
3. One of the things we’re interested in for this project is “neighborhood change.” Do you think
your neighborhood has changed or is changing? How?
a. What was the neighborhood like when you first moved here?
b. Do you feel like any of these changes has affected your life? How?
c. What do you know about this neighborhood’s history?
Community connection
4. What are this community’s strengths and weaknesses?
5. What are the main issues facing this community?
6. Are there particular issues for residents of public housing?
7. Are you aware of any community groups that are especially important in this neighborhood?
Which ones and why?
8. Are you personally involved in any community groups or religious organizations? This could
include being part of a community center program; attending Bingo or meal service at
community centers; doing sports, theater, gardening, or volunteer projects; attending worship
services at a church, mosque, or temple; and more.](https://image.slidesharecdn.com/finalreportrevised050615plusresponse-150522154705-lva1-app6892/85/The-Effects-of-Neighborhood-Change-on-New-York-City-Housing-Authority-Residents-142-320.jpg)
![The Effect of Neighborhood Change on New York City Housing Authority
Residents Evaluation Plan
Abt Associates Inc. December 3, 2013 ▌pg. 124
a. If yes, what are they? Tell me about how you got involved and what you do with
them.
b. If no, why not?
c. Has your involvement with community groups changed over time? If so, why?
Economic advancement
9. Tell me about what you’ve done to make money since you’ve lived here. I want to hear about
official jobs and other things you’ve done to make money.
a. If you haven’t had a job, where have you looked for work? What happened?
i. Have you ever looked for a job in this neighborhood? What happened?
b. What do other people in the neighborhood do to make money?
i. What kind of work can people do inside the neighborhood?
10. Do you feel like work opportunities have changed since you lived here? Did any changes in
the neighborhood affect your opportunities?
a. How has your financial situation changed since you moved into [house name]?
b. Have you ever had a hard time paying your rent on this apartment?
i. When was the last time? What did you do, or how did you get caught up?
11. Where do you get most of your information or advice about financial issues or how to handle
your money?
12. What do you think of the options you have for storing and borrowing money in your
neighborhood? We’re thinking of things like keeping money in a bank, at home or a friend or
family member’s house, a check cashing or pawn shop, or other place.
13. If you’re comfortable telling us, where do you keep your money?
a. Do you keep your money in a local bank?
b. Do you use check-cashing services?
c. Keep at home—yours or someone else’s?
14. Are you saving money now? If not, why not? What keeps you from saving money?
15. What do you do if you come up short to pay your bills one month? Tell me what you did last
time that happened.
16. Since you’ve lived in [House Name], have you changed anything about how you learn about
financial issues or store or borrow money? When and why?](https://image.slidesharecdn.com/finalreportrevised050615plusresponse-150522154705-lva1-app6892/85/The-Effects-of-Neighborhood-Change-on-New-York-City-Housing-Authority-Residents-143-320.jpg)
![The Effect of Neighborhood Change on New York City Housing Authority
Residents Evaluation Plan
Abt Associates Inc. December 3, 2013 ▌pg. 125
Quality of local school [If children live in the household]
17. What school do your children go to? How do you feel about their school?
18. What do you think of the schools in this neighborhood?
19. How have the schools changed since you moved here? What caused any changes in the local
schools?
20. In your opinion, what are the strengths and weaknesses of the schools?
21. Are there particular things that kids living in NYCHA houses need to support them in school?
Quality and cost of food in local stores
22. Tell me about options for food in your neighborhood.
a. Have these changed since you’ve lived here? When they changed, did you change
what you do?
23. Where do you usually get groceries? Why?
a. Where do most people who live in [House Name] get groceries? Is that the same
place or different place than people who don’t live in [House Name]?
b. What are the options for people with food stamps/SNAP?
c. If you didn’t have enough money for groceries, what would you do?
24. What do you think of the quality of grocery stores in this area?
25. What restaurants/fast-food places do you go to? Why? Where else do you go to eat?
26. What grocery stores/restaurants/fast food places don’t you go to? Why?
Quality and use of neighborhood amenities
27. Where do you like to spend free time in your neighborhood? Why?
28. Do you, or your kids, go to parks in this neighborhood? What do you think of them?
29. Do you, or your kids, go to any recreation or community centers? What do you think
of them?
30. Where else do you like to sit, hang out, or go with your family and friends?
31. Please tell me if these have changed while you’ve lived here, and how.
Crime and safety in the neighborhood
32. Now we want to talk about crime and safety in the neighborhood.
33. Do you generally feel safe around here?
34. Are there parts of the neighborhood where you feel more or less safe?](https://image.slidesharecdn.com/finalreportrevised050615plusresponse-150522154705-lva1-app6892/85/The-Effects-of-Neighborhood-Change-on-New-York-City-Housing-Authority-Residents-144-320.jpg)
![The Effect of Neighborhood Change on New York City Housing Authority
Residents Evaluation Plan
Abt Associates Inc. December 3, 2013 ▌pg. 126
35. Are there parts of the neighborhood where you feel more or less comfortable for
other reasons?
36. How has the neighborhood changed from a crime and safety perspective since you’ve lived
here? How have these changes affected your life?
a. Have you or someone in your family been a victim of a crime? Did the crime affect
how you felt about or acted in the neighborhood? (If someone in your family was a
victim, you don’t have to tell me who it was, just that you know someone—we
respect their privacy but we are also interested in learning about what has happened
to people.)
Neighborhood Change
Now that we’ve talked about how the neighborhood has changed and your life while you’ve lived
here, I want to talk a little bit about the future.
37. Do you have ideas about anything NYCHA could do to help [Neighborhood]?
38. What about ideas especially to help [House Name] residents get the most out of their
neighborhoods?
39. What could other groups do to support NYCHA residents?
40. What do you think [neighborhood] will be like in 5-10 years?
a. What do you think would happen if a lot of people with more money moved into this
neighborhood? Are there things helpful things you think NYCHA could do for
[House Name] if that happens?
b. What do you think would happen if a lot of people who are struggling financially
moved into this neighborhood? Are there things helpful things you think NYCHA
could do for [House Name] if that happens?
Demographics
The last thing I want to do in the interview is get some general information about who lives here.
41. How many people live in your household?
a. How many adults? What ages?
b. Any children in the house? If so, what are their ages?
42. Are you male, female, or other sex?
43. What’s your approximate household income?
44. What do you do for work?
45. What’s the highest level of education you’ve finished?
46. How do you identify yourself racially, ethnically, religiously or otherwise?](https://image.slidesharecdn.com/finalreportrevised050615plusresponse-150522154705-lva1-app6892/85/The-Effects-of-Neighborhood-Change-on-New-York-City-Housing-Authority-Residents-145-320.jpg)
![The Effect of Neighborhood Change on New York City Housing Authority
Residents Evaluation Plan
Abt Associates Inc. December 3, 2013 ▌pg. 128
Focus Group Discussion Guide
The Effect of Neighborhood Change on NYCHA Residents
Introduction
Hello, my name is [NAME] and I work for a company called Abt Associates. I am facilitating this
group today as part of a research project for New York City government’s Center for Economic
Opportunity about how socioeconomic change in neighborhoods affects public housing residents.
Thank you for your time today. We want to hear from everyone about your experiences with this
neighborhood, and your thoughts on improving opportunities in it. What you have to say is very
important and will be used to help all kinds of neighborhood residents and institutions connect with
resources in the community.
We are planning on conducting as many as 9 focus groups in 3 boroughs, with up to 100 people. The
information we get from all the discussions will help inform potential citywide and neighborhood-
specific initiatives.
My role as facilitator is to find out your views on some issues and to move the conversation forward
from time to time. As you can see, I have two colleagues here from [PARTNER ORGANIZATION]
to help with note-taking and keeping the discussion flowing. We will also be audio recording this
session and sharing the information with our research partners at NYU. However, none of our internal
or published reports will identify anyone by name. Your name cards have first names only and I will
only know you and refer to you by your first names. Please do not use anyone’s last name in our
discussions if you happen to know them. When we write our report, we will replace your name with a
pseudonym. (If you have a pseudonym you would like to use, you can suggest it to me at the end of
the discussion.)
Your participation in this discussion is voluntary. You do not have to answer any questions you
would prefer not to answer. You can also decide to leave the group at any time if you do not want
to continue.
Also, please know your participation in this group will not affect any benefits you may be receiving
now or will in the future receive from the Center for Economic Opportunity, NYCHA, [PARTNER
ORGANIZATION], or any other agency. In the coming months we will use the information from
today and other focus groups to prepare a report for CEO that will distributed to the public.
Remember, no reports will identify you by name.
The consent form you signed earlier (and were given a copy of) provides contact information for the
study director should you have any questions about the study after leaving today. The consent form
also includes contact information Abt Associates’ Institutional Review Board should you have any
questions about your rights as a study participant.
Does anyone have any questions about today’s focus group?
Does anyone have any questions about this study?
Before we start, we’d like to remind everyone that everything shared in this focus group is
confidential. Please respect the privacy of your fellow participants and do not repeat what you hear](https://image.slidesharecdn.com/finalreportrevised050615plusresponse-150522154705-lva1-app6892/85/The-Effects-of-Neighborhood-Change-on-New-York-City-Housing-Authority-Residents-147-320.jpg)
![The Effect of Neighborhood Change on New York City Housing Authority
Residents Evaluation Plan
Abt Associates Inc. December 3, 2013 ▌pg. 129
today outside of the group. Now, we would like everyone to you introduce themselves, tell us how
long you’ve lived in this neighborhood, and give a sentence or two about why you decided to come to
this focus group.
Neighborhood Change
The big theme we’re interested in for this project is “neighborhood change.” Do you think your
neighborhood has changed or is changing? How? Again, we want to hear from you about what you
think is important. Probes:
1. How has this neighborhood changed in the past 10-20 years?
2. Can you tell me a bit about the history of [neighborhood]? What do you think are some of the
key events in this neighborhood’s history? In [house name’s] history?
3. How have the schools changed?
4. How has crime and safety changed?
5. How have the retail options changed?
6. What have been the most important community groups or institutions over the years? How
has that changed?
7. What do you think [neighborhood] will be like in 5-10 years?
Community connection
1. What are this community’s strengths?
2. What are the main issues facing this community?
3. Are there particular issues for residents of public housing?
4. Are there any issues in which [house name] residents tend to feel differently than other
neighborhood residents?
5. Speaking generally, tell me people’s relationships with their neighbors in this neighborhood.
Economic advancement and employment opportunities
1. What are the options for work in this neighborhood?
2. How well or poorly do those meet the needs of NYCHA residents?
3. What options do you see, as a community, for NYCHA residents to improve their economic
situations?
4. Use photo prompts from Neighborhood Inventory to generate discussion, use
captions/descriptions from community ethnographers. E.g.: “A member of our team said that
lots of people in this neighborhood work at [X]. Is that your sense, too?”](https://image.slidesharecdn.com/finalreportrevised050615plusresponse-150522154705-lva1-app6892/85/The-Effects-of-Neighborhood-Change-on-New-York-City-Housing-Authority-Residents-148-320.jpg)
![The Effect of Neighborhood Change on New York City Housing Authority
Residents Evaluation Plan
Abt Associates Inc. December 3, 2013 ▌pg. 130
Quality of local schools
1. What are the schooling options for children in this neighborhood?
2. What do you think of the schools in this neighborhood?
3. How well or poorly do they meet the needs of NYCHA residents?
4. Have the schools changed in ways that are related to neighborhood change—that is, not
related to city budgets or larger reforms?
Financial literacy and assets
1. Where do people in this neighborhood learn about managing their money?
2. What tools and institutions do people use—bank or credit union branches, check-cashing,
informal lending in the community?
3. What are the barriers for NYCHA residents to get access to the kind of financial services they
need?
Quality and cost of food in local stores
1. Tell me about options for food in your neighborhood.
2. Where do people usually buy groceries? What are the options for people using food
stamps/SNAP?
3. What do you think of the quality of grocery stores in this area?
4. What differences, if any, are there between residents of NYCHA housing and other housing?
a. What do you think accounts for any differences—money, selection, access,
attitudes, etc.?
Quality and use of neighborhood amenities
1. Use photos from Neighborhood Inventory, e.g., “A member of our research team reported
these [show pictures] as the main place to hang out in the neighborhood.
2. Do you go to parks in this neighborhood? What do you think of them?
3. Do you go to any recreation or community centers? What do you think of them?
4. Are there other places you like to sit or do things with your friends/family?
Crime and safety in the neighborhood
1. Talk to me about crime in the neighborhood since you’ve lived here.
2. Do you generally feel safe around here?
3. Are there parts of the neighborhood where you feel more or less safe?](https://image.slidesharecdn.com/finalreportrevised050615plusresponse-150522154705-lva1-app6892/85/The-Effects-of-Neighborhood-Change-on-New-York-City-Housing-Authority-Residents-149-320.jpg)


