Download to read offline


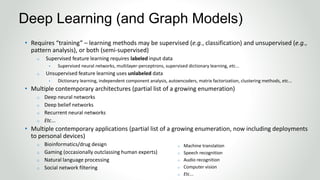
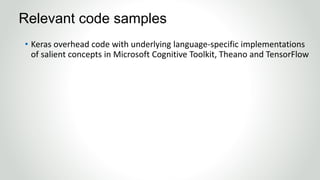


The document outlines a course titled 'Graph Models for Deep Learning' aimed at IT professionals, emphasizing the integration of graph theory with deep learning concepts and applications. It covers essential topics including statistical modeling, traditional methods, and the advantages of deep learning in solving complex 'big data' problems, alongside a practical focus on Python implementations using frameworks like Keras, TensorFlow, and Microsoft Cognitive Toolkit. The course seeks to enhance understanding of deep learning applications across fields such as computer vision, natural language processing, and more, highlighting the flexibility and robustness of graph-based approaches.