Download to read offline

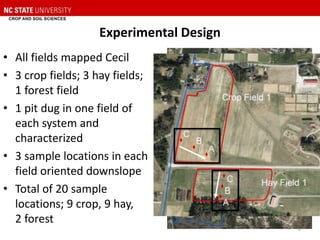
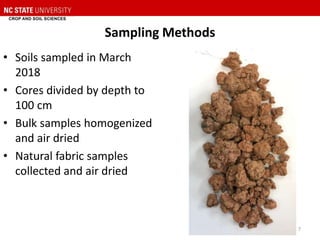
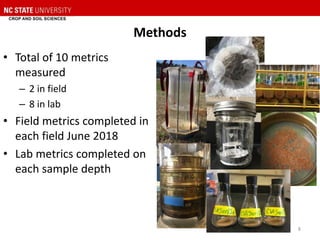
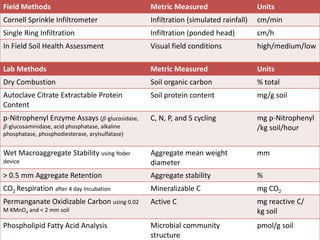
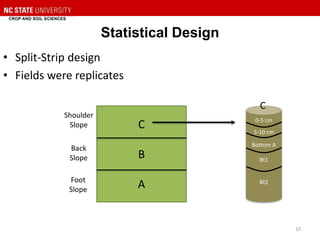
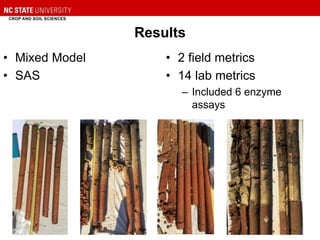
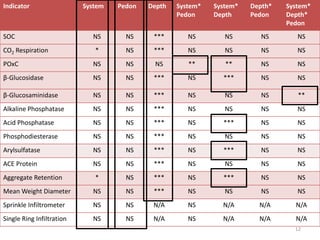
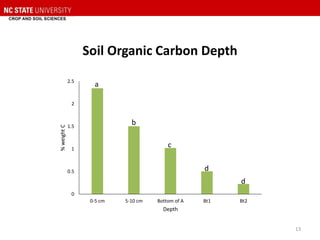
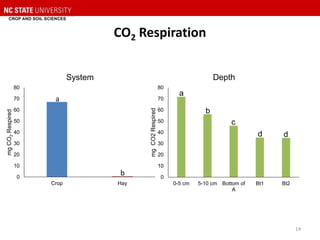
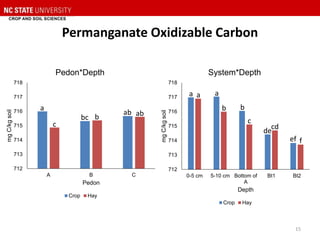
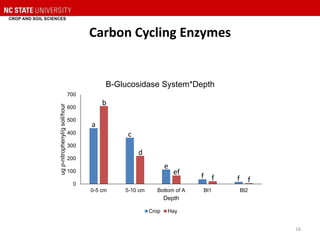

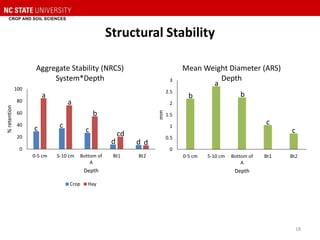
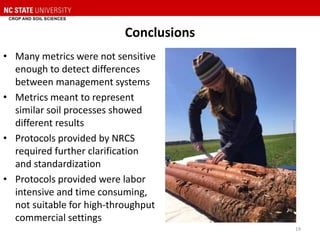

This study assessed soil health metrics across crop and hay fields in the Piedmont region of North Carolina. Soil samples were taken from 3 depths down to 1 meter across fields under different land management systems. Ten metrics were measured in the field and laboratory to evaluate differences between systems. Most metrics did not detect differences between crop and hay fields. Soil organic carbon and respiration rates differed between depths but not systems. Enzyme assays showed differences between depths and an interaction between system and depth. Standardized soil health measurement protocols need further refinement to be practical and effective at distinguishing management impacts.


