Download to read offline
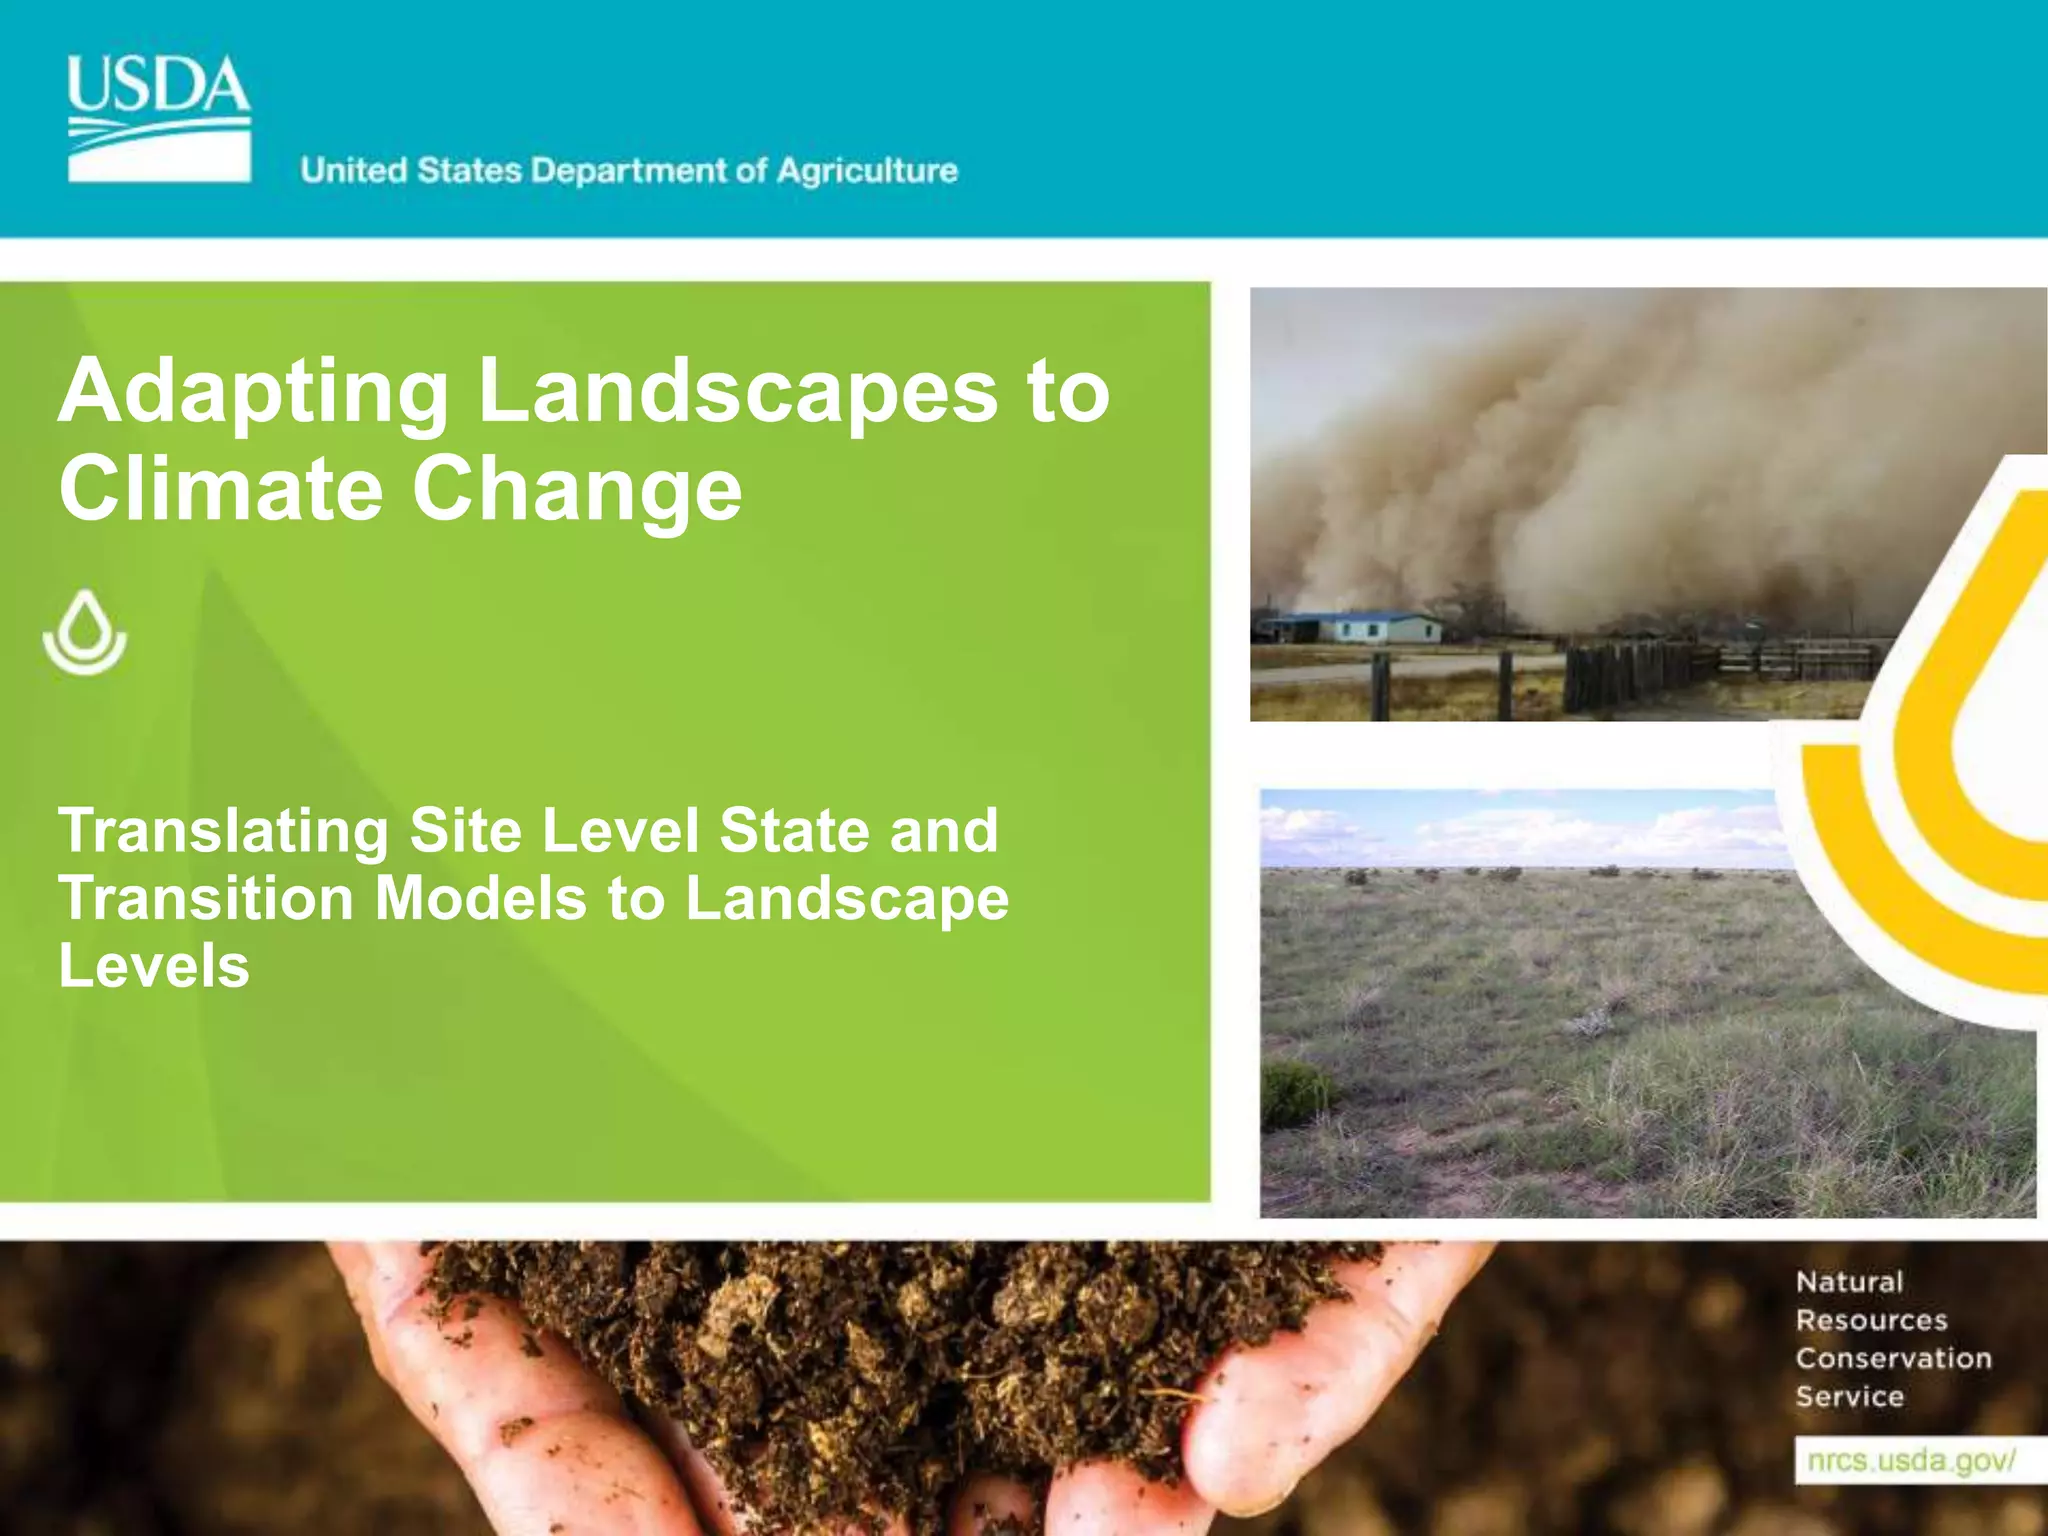
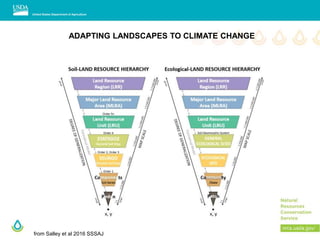
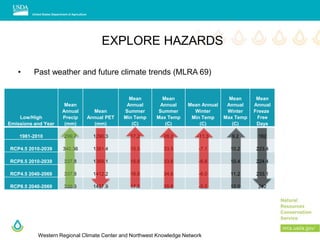
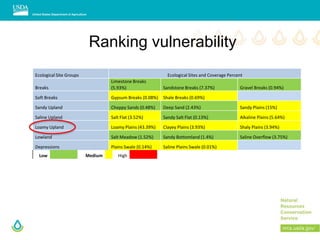
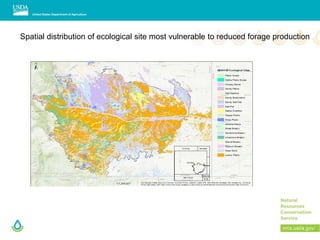
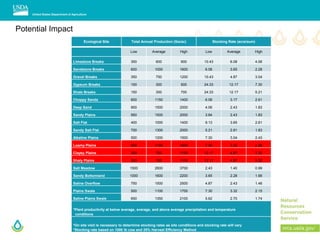
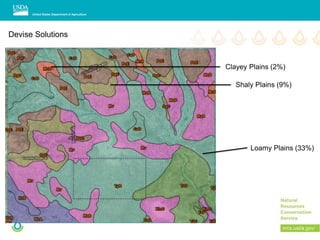
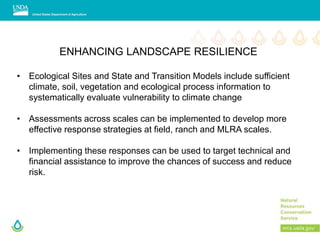

This document discusses adapting landscapes to climate change by translating site-level state and transition models to landscape levels. It provides information on climate trends and vulnerabilities for Major Land Resource Area 69. It explores hazards, assesses vulnerabilities and risks, and investigates options to prioritize and plan actions to enhance landscape resilience to climate change by targeting assistance using ecological site and state and transition model information across scales.


