Download to read offline


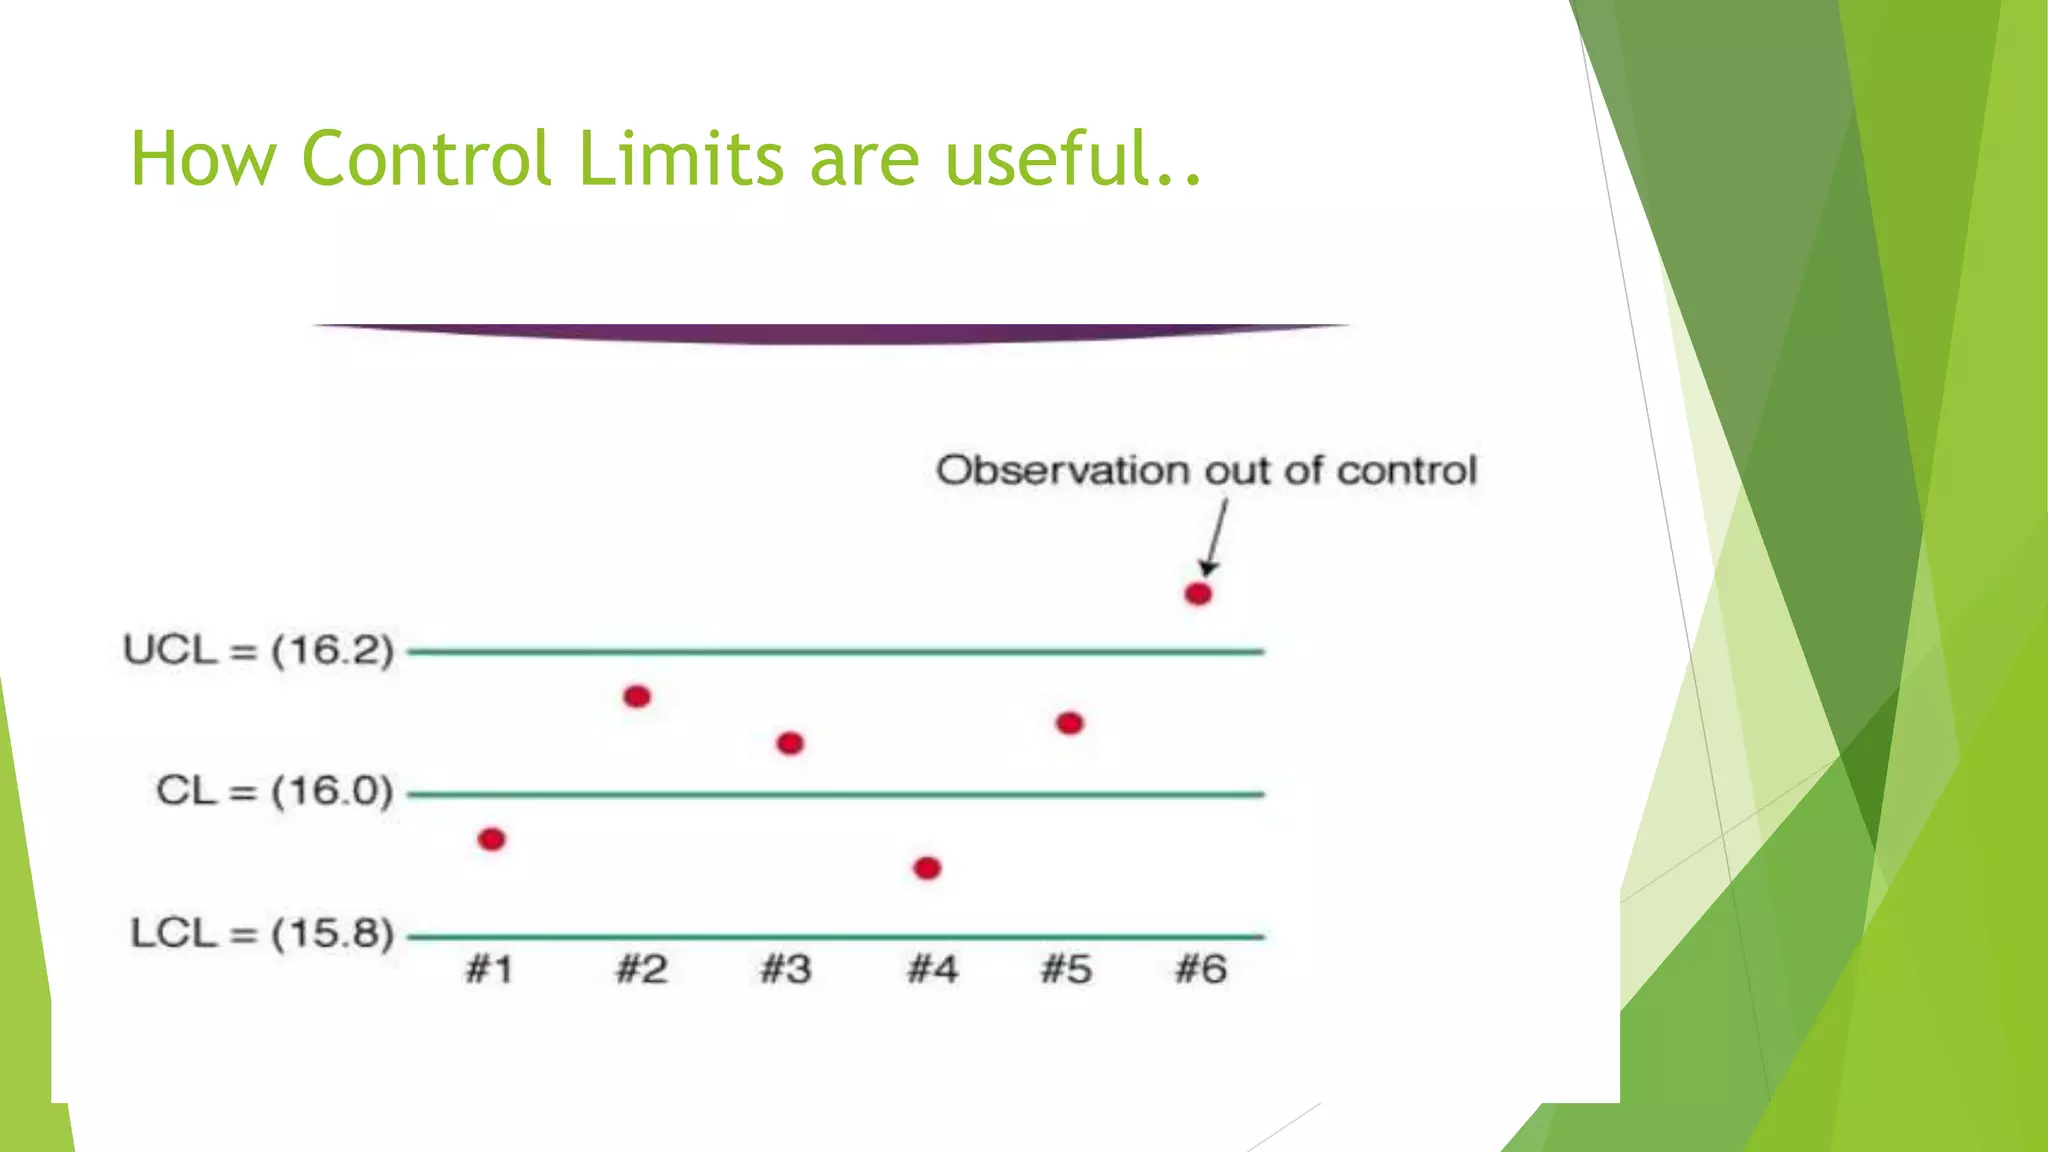
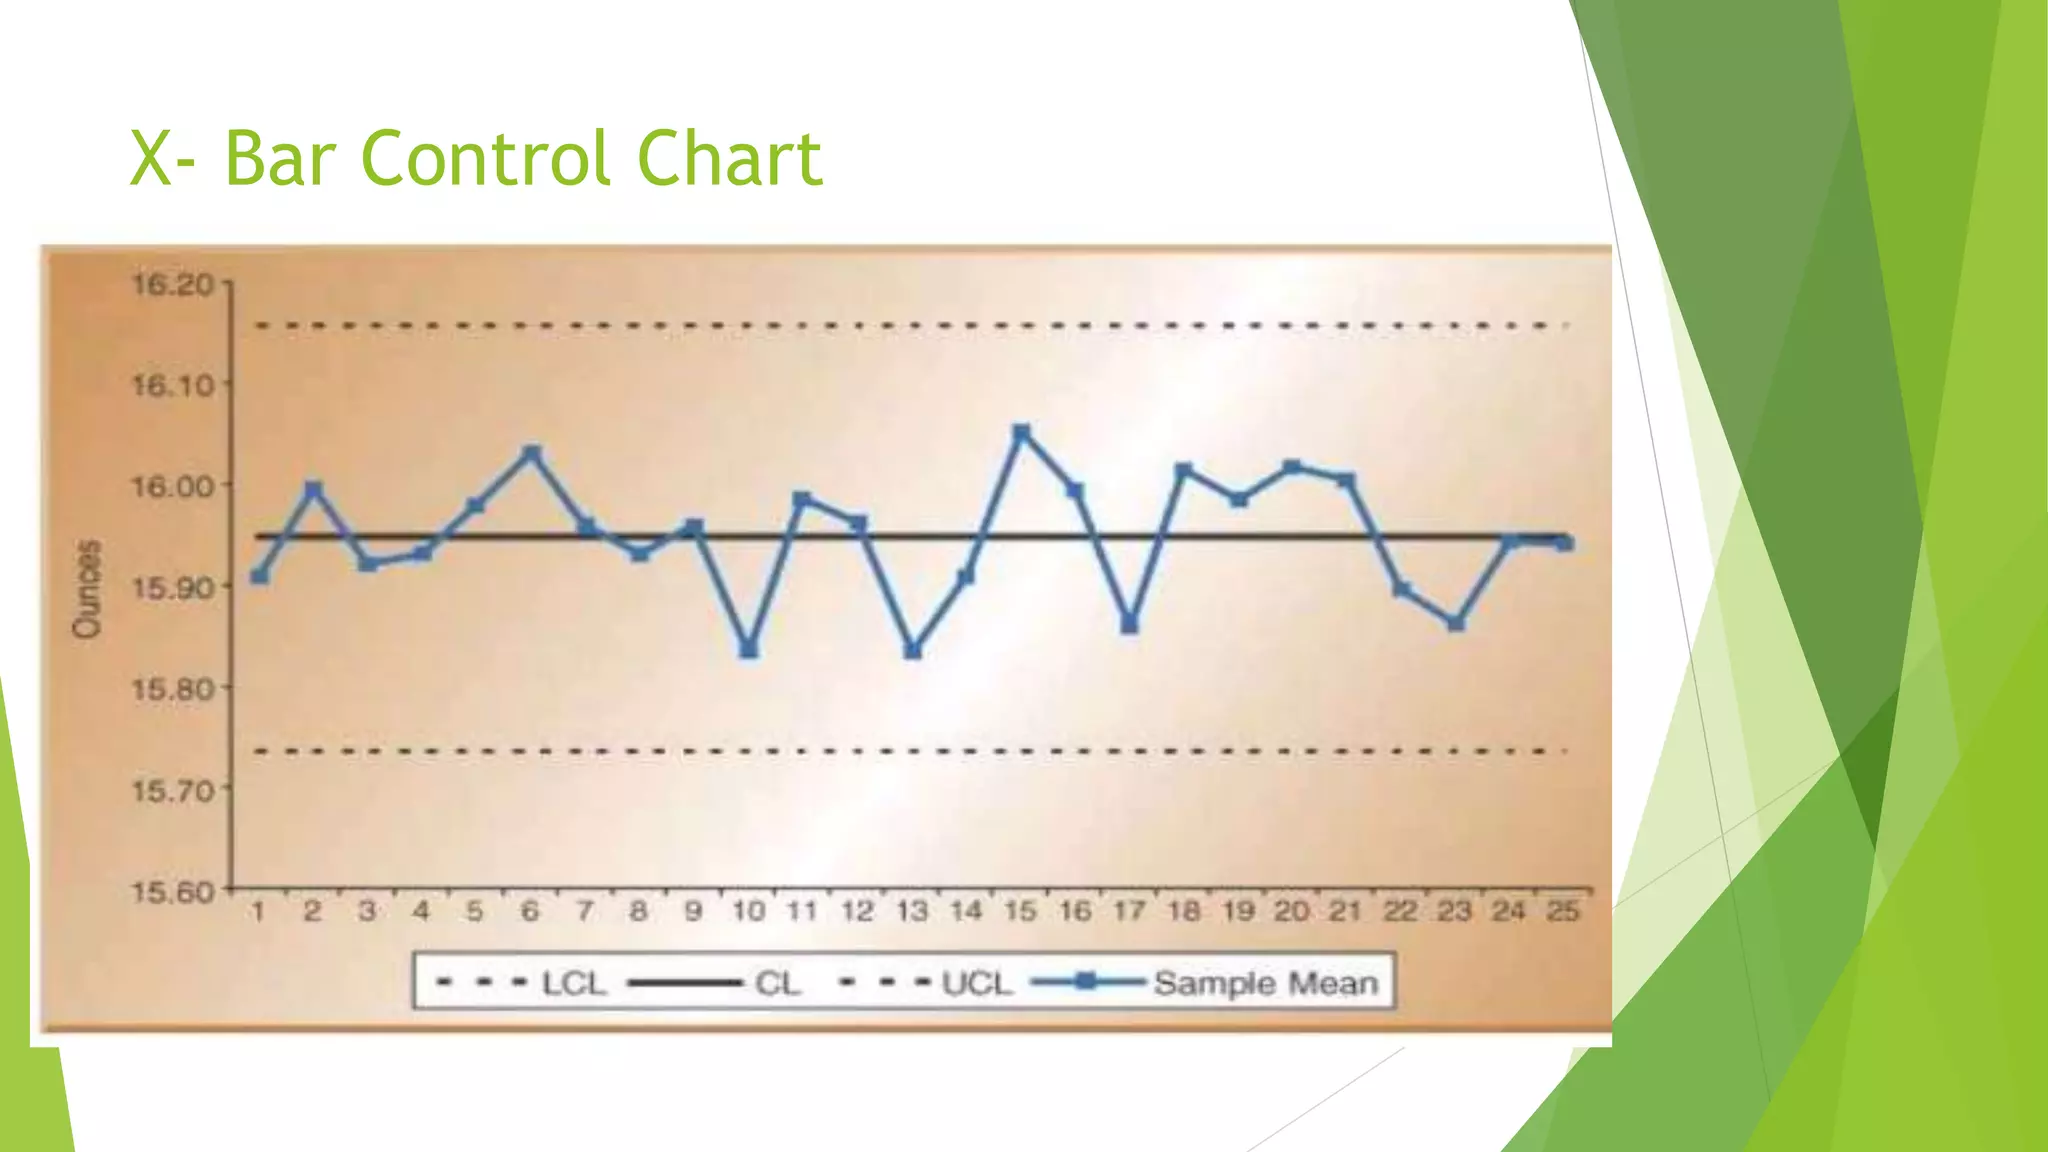


This document discusses joint optimization of statistical process control (SPC) and preventive maintenance. It describes different types of control charts that can be used for SPC, including X-bar charts. Preventive maintenance aims to avoid equipment failures by conducting maintenance activities regularly. The document presents a model to optimize SPC sampling intervals, sample size, control limits and preventive maintenance schedules to minimize total operational costs. The model utilizes information from quality control charts to inform maintenance decisions.


