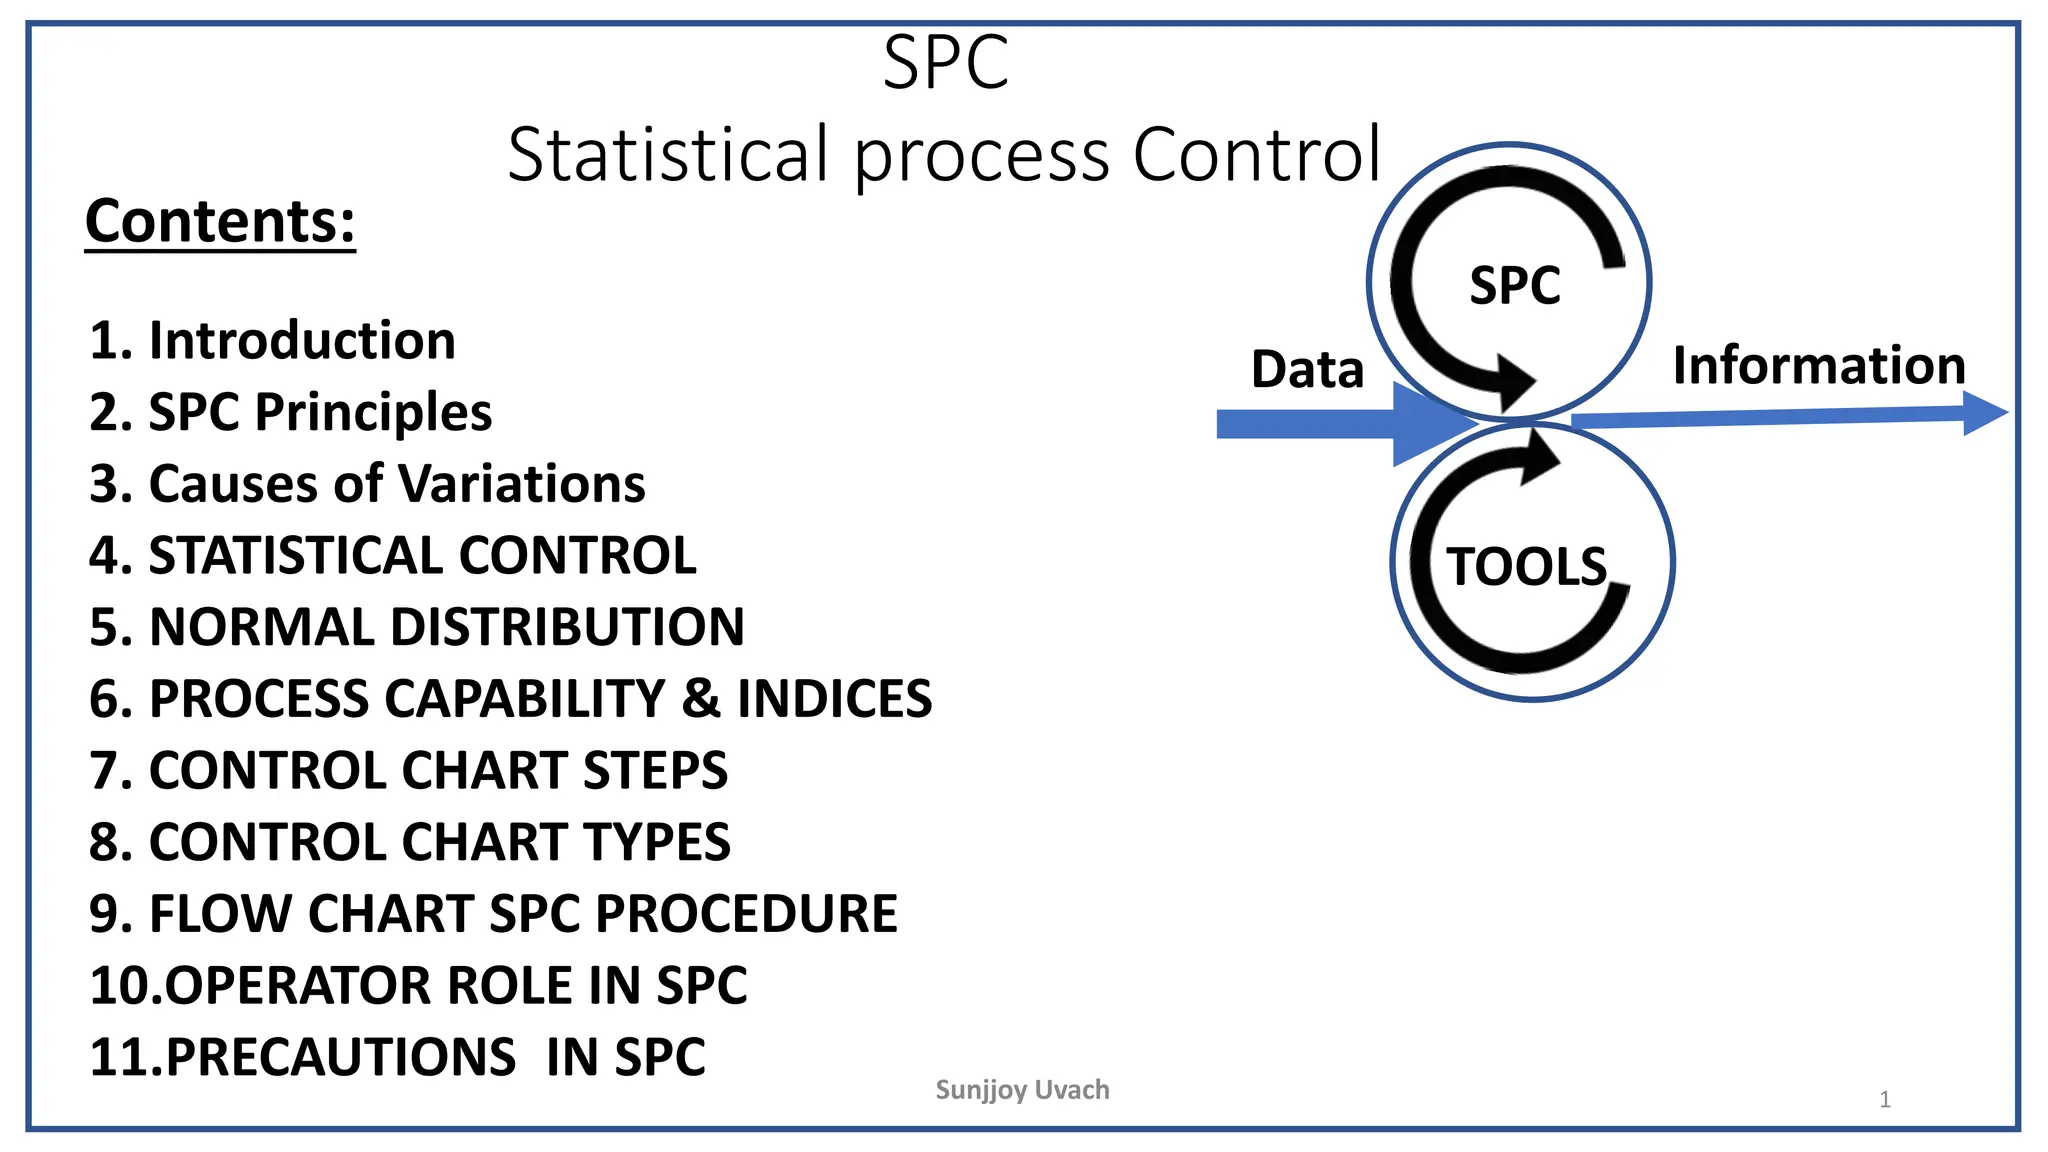
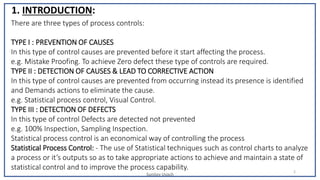
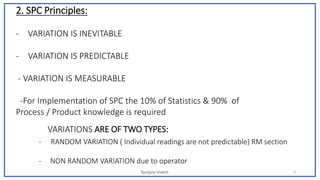
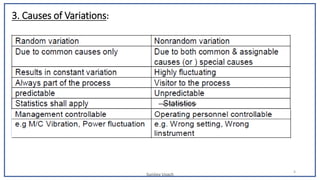
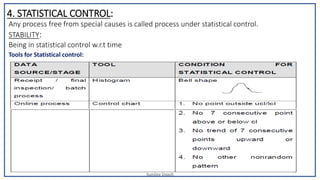
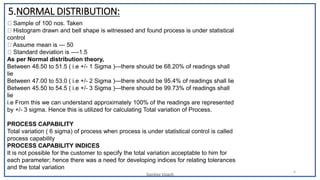
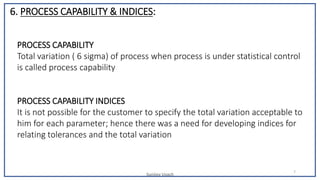
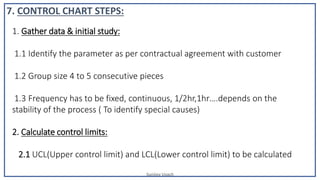
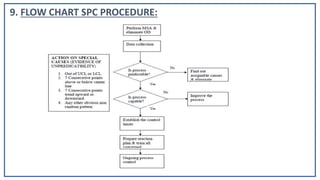
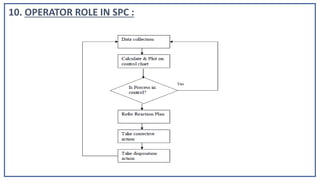
SlideShare a Scribd company logo
1 of 16
SPC
Statistical process Control
Contents:
Sunjjoy Uvach 1
1. Introduction
2. SPC Principles
3. Causes of Variations
4. STATISTICAL CONTROL
5. NORMAL DISTRIBUTION
6. PROCESS CAPABILITY & INDICES
7. CONTROL CHART STEPS
8. CONTROL CHART TYPES
9. FLOW CHART SPC PROCEDURE
10.OPERATOR ROLE IN SPC
11.PRECAUTIONS IN SPC
Data Information
SPC
TOOLS
Sunjjoy Uvach
2
1. INTRODUCTION:
There are three types of process controls:
TYPE I : PREVENTION OF CAUSES
In this type of control causes are prevented before it start affecting the process.
e.g. Mistake Proofing. To achieve Zero defect these type of controls are required.
TYPE II : DETECTION OF CAUSES & LEAD TO CORRECTIVE ACTION
In this type of control causes are prevented from occurring instead its presence is identified
and Demands actions to eliminate the cause.
e.g. Statistical process control, Visual Control.
TYPE III : DETECTION OF DEFECTS
In this type of control Defects are detected not prevented
e.g. 100% Inspection, Sampling Inspection.
Statistical process control is an economical way of controlling the process
Statistical Process Control: - The use of Statistical techniques such as control charts to analyze
a process or it’s outputs so as to take appropriate actions to achieve and maintain a state of
statistical control and to improve the process capability.
Sunjjoy Uvach 3
VARIATIONS ARE OF TWO TYPES:
2. SPC Principles:
- VARIATION IS INEVITABLE
- VARIATION IS PREDICTABLE
- VARIATION IS MEASURABLE
-For Implementation of SPC the 10% of Statistics & 90% of
Process / Product knowledge is required
- RANDOM VARIATION ( Individual readings are not predictable) RM section
- NON RANDOM VARIATION due to operator
Sunjjoy Uvach
4
3. Causes of Variations:
Sunjjoy Uvach
5
4. STATISTICAL CONTROL:
Any process free from special causes is called process under statistical control.
STABILITY:
Being in statistical control w.r.t time
Tools for Statistical control:
Sunjjoy Uvach
6
5.NORMAL DISTRIBUTION:
Sample of 100 nos. Taken
Histogram drawn and bell shape is witnessed and found process is under statistical
control
Assume mean is --- 50
Standard deviation is ----1.5
As per Normal distribution theory,
Between 48.50 to 51.5 ( i.e +/- 1 Sigma )—there should be 68.20% of readings shall
lie
Between 47.00 to 53.0 ( i.e +/- 2 Sigma )—there should be 95.4% of readings shall lie
Between 45.50 to 54.5 ( i.e +/- 3 Sigma )—there should be 99.73% of readings shall
lie
i.e From this we can understand approximately 100% of the readings are represented
by +/- 3 sigma. Hence this is utilized for calculating Total variation of Process.
PROCESS CAPABILITY
Total variation ( 6 sigma) of process when process is under statistical control is called
process capability
PROCESS CAPABILITY INDICES
It is not possible for the customer to specify the total variation acceptable to him for
each parameter; hence there was a need for developing indices for relating tolerances
and the total variation
Sunjjoy Uvach
7
PROCESS CAPABILITY
Total variation ( 6 sigma) of process when process is under statistical control
is called process capability
PROCESS CAPABILITY INDICES
It is not possible for the customer to specify the total variation acceptable to
him for each parameter; hence there was a need for developing indices for
relating tolerances and the total variation
6. PROCESS CAPABILITY & INDICES:
Sunjjoy Uvach
7. CONTROL CHART STEPS:
1. Gather data & initial study:
1.1 Identify the parameter as per contractual agreement with customer
1.2 Group size 4 to 5 consecutive pieces
1.3 Frequency has to be fixed, continuous, 1/2hr,1hr….depends on the
stability of the process ( To identify special causes)
2. Calculate control limits:
2.1 UCL(Upper control limit) and LCL(Lower control limit) to be calculated
3. Interpret for process control :
3.1 If not in control then identify special causes & eliminate.
3.2 Recalculate UCL & LCL
4. Interpret for capability (if in control):
4.1 Calculate standard deviation (sigma) = R bar / d 2.
4.2 Calculate 6 sigma, Cp & Cpk, If Cpk >1.33 then proceed for step 5
4.3 Else initiate corrective action plan to improve Cpk and carryout 100%
inspection.
7. CONTROL CHART STEPS:
5.Ongoing control:
5.1 Provide UCL & LCL calculated for Ongoing control, specify the date of
calculation of UCL / LCL on the chart to be used for ongoing control
5.2 Prepare reaction plan & link it into control plan
5.3 Train the operator on his / her role
5.4 Review periodically for improvement calculate Cp / Cpk & reviewUCL / LCL
if improvement is observed
- Repeat steps 5.1-5.4
7. CONTROL CHART STEPS:
8.1 For Variable data
8.1.1 If N(Samples)<10 then x̄-R chart is the flagship of the control
charts. It is called variable chart because the data to be plotted
result from measurement on a variable or continuous scale
8.1.2 If N(Samples)>10 then x̄-S chart is another variable control
chart. In this chart standard deviation s is used to indicate
dispersion instead of the range.
8.1.3 The ImR ( Individual and moving range)chart is used when
data are expensive or occur at a rate too slow to form rational
subgroups contd…
8. CONTROL CHART TYPES:
8.2 For Attribute data:
8.2.1 If sample size varies then p chart is used
8.2.2 If sample is fixed then np chart is used here full batch is taken into
consideration
8.2.3 If sample is fixed but a part of data is used then c chart is used.
Example: From loan applications approval everyday a fixed no.is cross
checked.
8. CONTROL CHART TYPES:
9. FLOW CHART SPC PROCEDURE:
10. OPERATOR ROLE IN SPC :
11. PRECAUTIONS IN SPC :
NOTE :
1.After Corrective action taken, the Immediate subgroup shall be measured
and plotted.
2.Record in detail the causes, corrective action and disposition action taken for
every out of control condition.
Concept of over adjustment:
- Over adjustment is the practice of treating each deviation from the target as
if it were the result of the action of a special cause of variation of the process.
- If a stable process is adjusted based on the each measurement made, then
the adjustment becomes an additional source of variation.
- Adjust the process only based on the indications of control chart and as
directed by corrective action plan
Engineering Engineers

More Related Content

Similar to 16. SPC.pptx

Statistical Process Control Presentation.pdf
Statistical Process Control Presentation.pdfStatistical Process Control Presentation.pdf
Statistical Process Control Presentation.pdfnewaybeyene5
 
Understanding SPC Charts for Quality Control.pdf
Understanding SPC Charts for Quality Control.pdfUnderstanding SPC Charts for Quality Control.pdf
Understanding SPC Charts for Quality Control.pdfjawadullah25
 
Statistical Process Control
Statistical Process ControlStatistical Process Control
Statistical Process ControlTushar Naik
 
Statistical Process Control Part 1
Statistical Process Control Part 1Statistical Process Control Part 1
Statistical Process Control Part 1Malay Pandya
 
02trainingmaterialformsa (1) 111030062223-phpapp02
02trainingmaterialformsa (1) 111030062223-phpapp0202trainingmaterialformsa (1) 111030062223-phpapp02
02trainingmaterialformsa (1) 111030062223-phpapp02Junelly Grace Catalan-Tecson
 
Use of control charts in laboratory as per ISO 17025:2017
Use of control charts in laboratory as per ISO 17025:2017Use of control charts in laboratory as per ISO 17025:2017
Use of control charts in laboratory as per ISO 17025:2017Rahul Gupta
 
Production & Operation Management Chapter9[1]
Production & Operation Management Chapter9[1]Production & Operation Management Chapter9[1]
Production & Operation Management Chapter9[1]Hariharan Ponnusamy
 
STATISTICAL PROCESS CONTROL(PPT).pptx
STATISTICAL PROCESS CONTROL(PPT).pptxSTATISTICAL PROCESS CONTROL(PPT).pptx
STATISTICAL PROCESS CONTROL(PPT).pptxmayankdubey99
 
aa-automation-apc-complex-industrial-processes
aa-automation-apc-complex-industrial-processesaa-automation-apc-complex-industrial-processes
aa-automation-apc-complex-industrial-processesDavid Lyon
 
Research on a Kind of PLC Based Fuzzy-PID Controller with Adjustable Factor
Research on a Kind of PLC Based Fuzzy-PID Controller with Adjustable FactorResearch on a Kind of PLC Based Fuzzy-PID Controller with Adjustable Factor
Research on a Kind of PLC Based Fuzzy-PID Controller with Adjustable FactorNooria Sukmaningtyas
 
Management quality management Lec 4
Management quality management Lec 4Management quality management Lec 4
Management quality management Lec 4cairo university
 
Statistical Process Control (SPC) - QMS.pptx
Statistical Process Control (SPC) - QMS.pptxStatistical Process Control (SPC) - QMS.pptx
Statistical Process Control (SPC) - QMS.pptxARUN KUMAR
 

Similar to 16. SPC.pptx (20)

Spc material
Spc materialSpc material
Spc material
 
Chapter 1 spc
Chapter 1   spcChapter 1   spc
Chapter 1 spc
 
405chapter5.ppt
405chapter5.ppt405chapter5.ppt
405chapter5.ppt
 
Statistical Process Control Presentation.pdf
Statistical Process Control Presentation.pdfStatistical Process Control Presentation.pdf
Statistical Process Control Presentation.pdf
 
Understanding SPC Charts for Quality Control.pdf
Understanding SPC Charts for Quality Control.pdfUnderstanding SPC Charts for Quality Control.pdf
Understanding SPC Charts for Quality Control.pdf
 
BBA504.pptx
BBA504.pptxBBA504.pptx
BBA504.pptx
 
Spc
SpcSpc
Spc
 
Statistical Process Control
Statistical Process ControlStatistical Process Control
Statistical Process Control
 
Statistical Process Control Part 1
Statistical Process Control Part 1Statistical Process Control Part 1
Statistical Process Control Part 1
 
Methods and Philosophy of SPC
Methods and Philosophy of SPCMethods and Philosophy of SPC
Methods and Philosophy of SPC
 
02trainingmaterialformsa (1) 111030062223-phpapp02
02trainingmaterialformsa (1) 111030062223-phpapp0202trainingmaterialformsa (1) 111030062223-phpapp02
02trainingmaterialformsa (1) 111030062223-phpapp02
 
Use of control charts in laboratory as per ISO 17025:2017
Use of control charts in laboratory as per ISO 17025:2017Use of control charts in laboratory as per ISO 17025:2017
Use of control charts in laboratory as per ISO 17025:2017
 
Production & Operation Management Chapter9[1]
Production & Operation Management Chapter9[1]Production & Operation Management Chapter9[1]
Production & Operation Management Chapter9[1]
 
Chapter9[1]
Chapter9[1]Chapter9[1]
Chapter9[1]
 
TQM
TQMTQM
TQM
 
STATISTICAL PROCESS CONTROL(PPT).pptx
STATISTICAL PROCESS CONTROL(PPT).pptxSTATISTICAL PROCESS CONTROL(PPT).pptx
STATISTICAL PROCESS CONTROL(PPT).pptx
 
aa-automation-apc-complex-industrial-processes
aa-automation-apc-complex-industrial-processesaa-automation-apc-complex-industrial-processes
aa-automation-apc-complex-industrial-processes
 
Research on a Kind of PLC Based Fuzzy-PID Controller with Adjustable Factor
Research on a Kind of PLC Based Fuzzy-PID Controller with Adjustable FactorResearch on a Kind of PLC Based Fuzzy-PID Controller with Adjustable Factor
Research on a Kind of PLC Based Fuzzy-PID Controller with Adjustable Factor
 
Management quality management Lec 4
Management quality management Lec 4Management quality management Lec 4
Management quality management Lec 4
 
Statistical Process Control (SPC) - QMS.pptx
Statistical Process Control (SPC) - QMS.pptxStatistical Process Control (SPC) - QMS.pptx
Statistical Process Control (SPC) - QMS.pptx
 

Recently uploaded

Microscopic Analysis of Ceramic Materials.pptx
Microscopic Analysis of Ceramic Materials.pptxMicroscopic Analysis of Ceramic Materials.pptx
Microscopic Analysis of Ceramic Materials.pptxpurnimasatapathy1234
 
Model Call Girl in Narela Delhi reach out to us at 🔝8264348440🔝
Model Call Girl in Narela Delhi reach out to us at 🔝8264348440🔝Model Call Girl in Narela Delhi reach out to us at 🔝8264348440🔝
Model Call Girl in Narela Delhi reach out to us at 🔝8264348440🔝soniya singh
 
MANUFACTURING PROCESS-II UNIT-5 NC MACHINE TOOLS
MANUFACTURING PROCESS-II UNIT-5 NC MACHINE TOOLSMANUFACTURING PROCESS-II UNIT-5 NC MACHINE TOOLS
MANUFACTURING PROCESS-II UNIT-5 NC MACHINE TOOLSSIVASHANKAR N
 
OSVC_Meta-Data based Simulation Automation to overcome Verification Challenge...
OSVC_Meta-Data based Simulation Automation to overcome Verification Challenge...OSVC_Meta-Data based Simulation Automation to overcome Verification Challenge...
OSVC_Meta-Data based Simulation Automation to overcome Verification Challenge...Soham Mondal
 
(MEERA) Dapodi Call Girls Just Call 7001035870 [ Cash on Delivery ] Pune Escorts
(MEERA) Dapodi Call Girls Just Call 7001035870 [ Cash on Delivery ] Pune Escorts(MEERA) Dapodi Call Girls Just Call 7001035870 [ Cash on Delivery ] Pune Escorts
(MEERA) Dapodi Call Girls Just Call 7001035870 [ Cash on Delivery ] Pune Escortsranjana rawat
 
UNIT-III FMM. DIMENSIONAL ANALYSIS
UNIT-III FMM.        DIMENSIONAL ANALYSISUNIT-III FMM.        DIMENSIONAL ANALYSIS
UNIT-III FMM. DIMENSIONAL ANALYSISrknatarajan
 
Introduction and different types of Ethernet.pptx
Introduction and different types of Ethernet.pptxIntroduction and different types of Ethernet.pptx
Introduction and different types of Ethernet.pptxupamatechverse
 
The Most Attractive Pune Call Girls Budhwar Peth 8250192130 Will You Miss Thi...
The Most Attractive Pune Call Girls Budhwar Peth 8250192130 Will You Miss Thi...The Most Attractive Pune Call Girls Budhwar Peth 8250192130 Will You Miss Thi...
The Most Attractive Pune Call Girls Budhwar Peth 8250192130 Will You Miss Thi...ranjana rawat
 
Booking open Available Pune Call Girls Koregaon Park 6297143586 Call Hot Ind...
Booking open Available Pune Call Girls Koregaon Park  6297143586 Call Hot Ind...Booking open Available Pune Call Girls Koregaon Park  6297143586 Call Hot Ind...
Booking open Available Pune Call Girls Koregaon Park 6297143586 Call Hot Ind...Call Girls in Nagpur High Profile
 
HARMONY IN THE NATURE AND EXISTENCE - Unit-IV
HARMONY IN THE NATURE AND EXISTENCE - Unit-IVHARMONY IN THE NATURE AND EXISTENCE - Unit-IV
HARMONY IN THE NATURE AND EXISTENCE - Unit-IVRajaP95
 
Decoding Kotlin - Your guide to solving the mysterious in Kotlin.pptx
Decoding Kotlin - Your guide to solving the mysterious in Kotlin.pptxDecoding Kotlin - Your guide to solving the mysterious in Kotlin.pptx
Decoding Kotlin - Your guide to solving the mysterious in Kotlin.pptxJoão Esperancinha
 
Structural Analysis and Design of Foundations: A Comprehensive Handbook for S...
Structural Analysis and Design of Foundations: A Comprehensive Handbook for S...Structural Analysis and Design of Foundations: A Comprehensive Handbook for S...
Structural Analysis and Design of Foundations: A Comprehensive Handbook for S...Dr.Costas Sachpazis
 
(TARA) Talegaon Dabhade Call Girls Just Call 7001035870 [ Cash on Delivery ] ...
(TARA) Talegaon Dabhade Call Girls Just Call 7001035870 [ Cash on Delivery ] ...(TARA) Talegaon Dabhade Call Girls Just Call 7001035870 [ Cash on Delivery ] ...
(TARA) Talegaon Dabhade Call Girls Just Call 7001035870 [ Cash on Delivery ] ...ranjana rawat
 
SPICE PARK APR2024 ( 6,793 SPICE Models )
SPICE PARK APR2024 ( 6,793 SPICE Models )SPICE PARK APR2024 ( 6,793 SPICE Models )
SPICE PARK APR2024 ( 6,793 SPICE Models )Tsuyoshi Horigome
 
Call for Papers - African Journal of Biological Sciences, E-ISSN: 2663-2187, ...
Call for Papers - African Journal of Biological Sciences, E-ISSN: 2663-2187, ...Call for Papers - African Journal of Biological Sciences, E-ISSN: 2663-2187, ...
Call for Papers - African Journal of Biological Sciences, E-ISSN: 2663-2187, ...Christo Ananth
 
(RIA) Call Girls Bhosari ( 7001035870 ) HI-Fi Pune Escorts Service
(RIA) Call Girls Bhosari ( 7001035870 ) HI-Fi Pune Escorts Service(RIA) Call Girls Bhosari ( 7001035870 ) HI-Fi Pune Escorts Service
(RIA) Call Girls Bhosari ( 7001035870 ) HI-Fi Pune Escorts Serviceranjana rawat
 
IMPLICATIONS OF THE ABOVE HOLISTIC UNDERSTANDING OF HARMONY ON PROFESSIONAL E...
IMPLICATIONS OF THE ABOVE HOLISTIC UNDERSTANDING OF HARMONY ON PROFESSIONAL E...IMPLICATIONS OF THE ABOVE HOLISTIC UNDERSTANDING OF HARMONY ON PROFESSIONAL E...
IMPLICATIONS OF THE ABOVE HOLISTIC UNDERSTANDING OF HARMONY ON PROFESSIONAL E...RajaP95
 

Recently uploaded (20)

DJARUM4D - SLOT GACOR ONLINE | SLOT DEMO ONLINE
DJARUM4D - SLOT GACOR ONLINE | SLOT DEMO ONLINEDJARUM4D - SLOT GACOR ONLINE | SLOT DEMO ONLINE
DJARUM4D - SLOT GACOR ONLINE | SLOT DEMO ONLINE
 
Microscopic Analysis of Ceramic Materials.pptx
Microscopic Analysis of Ceramic Materials.pptxMicroscopic Analysis of Ceramic Materials.pptx
Microscopic Analysis of Ceramic Materials.pptx
 
Model Call Girl in Narela Delhi reach out to us at 🔝8264348440🔝
Model Call Girl in Narela Delhi reach out to us at 🔝8264348440🔝Model Call Girl in Narela Delhi reach out to us at 🔝8264348440🔝
Model Call Girl in Narela Delhi reach out to us at 🔝8264348440🔝
 
MANUFACTURING PROCESS-II UNIT-5 NC MACHINE TOOLS
MANUFACTURING PROCESS-II UNIT-5 NC MACHINE TOOLSMANUFACTURING PROCESS-II UNIT-5 NC MACHINE TOOLS
MANUFACTURING PROCESS-II UNIT-5 NC MACHINE TOOLS
 
OSVC_Meta-Data based Simulation Automation to overcome Verification Challenge...
OSVC_Meta-Data based Simulation Automation to overcome Verification Challenge...OSVC_Meta-Data based Simulation Automation to overcome Verification Challenge...
OSVC_Meta-Data based Simulation Automation to overcome Verification Challenge...
 
Roadmap to Membership of RICS - Pathways and Routes
Roadmap to Membership of RICS - Pathways and RoutesRoadmap to Membership of RICS - Pathways and Routes
Roadmap to Membership of RICS - Pathways and Routes
 
(MEERA) Dapodi Call Girls Just Call 7001035870 [ Cash on Delivery ] Pune Escorts
(MEERA) Dapodi Call Girls Just Call 7001035870 [ Cash on Delivery ] Pune Escorts(MEERA) Dapodi Call Girls Just Call 7001035870 [ Cash on Delivery ] Pune Escorts
(MEERA) Dapodi Call Girls Just Call 7001035870 [ Cash on Delivery ] Pune Escorts
 
UNIT-III FMM. DIMENSIONAL ANALYSIS
UNIT-III FMM.        DIMENSIONAL ANALYSISUNIT-III FMM.        DIMENSIONAL ANALYSIS
UNIT-III FMM. DIMENSIONAL ANALYSIS
 
Introduction and different types of Ethernet.pptx
Introduction and different types of Ethernet.pptxIntroduction and different types of Ethernet.pptx
Introduction and different types of Ethernet.pptx
 
9953056974 Call Girls In South Ex, Escorts (Delhi) NCR.pdf
9953056974 Call Girls In South Ex, Escorts (Delhi) NCR.pdf9953056974 Call Girls In South Ex, Escorts (Delhi) NCR.pdf
9953056974 Call Girls In South Ex, Escorts (Delhi) NCR.pdf
 
The Most Attractive Pune Call Girls Budhwar Peth 8250192130 Will You Miss Thi...
The Most Attractive Pune Call Girls Budhwar Peth 8250192130 Will You Miss Thi...The Most Attractive Pune Call Girls Budhwar Peth 8250192130 Will You Miss Thi...
The Most Attractive Pune Call Girls Budhwar Peth 8250192130 Will You Miss Thi...
 
Booking open Available Pune Call Girls Koregaon Park 6297143586 Call Hot Ind...
Booking open Available Pune Call Girls Koregaon Park  6297143586 Call Hot Ind...Booking open Available Pune Call Girls Koregaon Park  6297143586 Call Hot Ind...
Booking open Available Pune Call Girls Koregaon Park 6297143586 Call Hot Ind...
 
HARMONY IN THE NATURE AND EXISTENCE - Unit-IV
HARMONY IN THE NATURE AND EXISTENCE - Unit-IVHARMONY IN THE NATURE AND EXISTENCE - Unit-IV
HARMONY IN THE NATURE AND EXISTENCE - Unit-IV
 
Decoding Kotlin - Your guide to solving the mysterious in Kotlin.pptx
Decoding Kotlin - Your guide to solving the mysterious in Kotlin.pptxDecoding Kotlin - Your guide to solving the mysterious in Kotlin.pptx
Decoding Kotlin - Your guide to solving the mysterious in Kotlin.pptx
 
Structural Analysis and Design of Foundations: A Comprehensive Handbook for S...
Structural Analysis and Design of Foundations: A Comprehensive Handbook for S...Structural Analysis and Design of Foundations: A Comprehensive Handbook for S...
Structural Analysis and Design of Foundations: A Comprehensive Handbook for S...
 
(TARA) Talegaon Dabhade Call Girls Just Call 7001035870 [ Cash on Delivery ] ...
(TARA) Talegaon Dabhade Call Girls Just Call 7001035870 [ Cash on Delivery ] ...(TARA) Talegaon Dabhade Call Girls Just Call 7001035870 [ Cash on Delivery ] ...
(TARA) Talegaon Dabhade Call Girls Just Call 7001035870 [ Cash on Delivery ] ...
 
SPICE PARK APR2024 ( 6,793 SPICE Models )
SPICE PARK APR2024 ( 6,793 SPICE Models )SPICE PARK APR2024 ( 6,793 SPICE Models )
SPICE PARK APR2024 ( 6,793 SPICE Models )
 
Call for Papers - African Journal of Biological Sciences, E-ISSN: 2663-2187, ...
Call for Papers - African Journal of Biological Sciences, E-ISSN: 2663-2187, ...Call for Papers - African Journal of Biological Sciences, E-ISSN: 2663-2187, ...
Call for Papers - African Journal of Biological Sciences, E-ISSN: 2663-2187, ...
 
(RIA) Call Girls Bhosari ( 7001035870 ) HI-Fi Pune Escorts Service
(RIA) Call Girls Bhosari ( 7001035870 ) HI-Fi Pune Escorts Service(RIA) Call Girls Bhosari ( 7001035870 ) HI-Fi Pune Escorts Service
(RIA) Call Girls Bhosari ( 7001035870 ) HI-Fi Pune Escorts Service
 
IMPLICATIONS OF THE ABOVE HOLISTIC UNDERSTANDING OF HARMONY ON PROFESSIONAL E...
IMPLICATIONS OF THE ABOVE HOLISTIC UNDERSTANDING OF HARMONY ON PROFESSIONAL E...IMPLICATIONS OF THE ABOVE HOLISTIC UNDERSTANDING OF HARMONY ON PROFESSIONAL E...
IMPLICATIONS OF THE ABOVE HOLISTIC UNDERSTANDING OF HARMONY ON PROFESSIONAL E...
 

16. SPC.pptx

  • 1. SPC Statistical process Control Contents: Sunjjoy Uvach 1 1. Introduction 2. SPC Principles 3. Causes of Variations 4. STATISTICAL CONTROL 5. NORMAL DISTRIBUTION 6. PROCESS CAPABILITY & INDICES 7. CONTROL CHART STEPS 8. CONTROL CHART TYPES 9. FLOW CHART SPC PROCEDURE 10.OPERATOR ROLE IN SPC 11.PRECAUTIONS IN SPC Data Information SPC TOOLS
  • 2. Sunjjoy Uvach 2 1. INTRODUCTION: There are three types of process controls: TYPE I : PREVENTION OF CAUSES In this type of control causes are prevented before it start affecting the process. e.g. Mistake Proofing. To achieve Zero defect these type of controls are required. TYPE II : DETECTION OF CAUSES & LEAD TO CORRECTIVE ACTION In this type of control causes are prevented from occurring instead its presence is identified and Demands actions to eliminate the cause. e.g. Statistical process control, Visual Control. TYPE III : DETECTION OF DEFECTS In this type of control Defects are detected not prevented e.g. 100% Inspection, Sampling Inspection. Statistical process control is an economical way of controlling the process Statistical Process Control: - The use of Statistical techniques such as control charts to analyze a process or it’s outputs so as to take appropriate actions to achieve and maintain a state of statistical control and to improve the process capability.
  • 3. Sunjjoy Uvach 3 VARIATIONS ARE OF TWO TYPES: 2. SPC Principles: - VARIATION IS INEVITABLE - VARIATION IS PREDICTABLE - VARIATION IS MEASURABLE -For Implementation of SPC the 10% of Statistics & 90% of Process / Product knowledge is required - RANDOM VARIATION ( Individual readings are not predictable) RM section - NON RANDOM VARIATION due to operator
  • 4. Sunjjoy Uvach 4 3. Causes of Variations:
  • 5. Sunjjoy Uvach 5 4. STATISTICAL CONTROL: Any process free from special causes is called process under statistical control. STABILITY: Being in statistical control w.r.t time Tools for Statistical control:
  • 6. Sunjjoy Uvach 6 5.NORMAL DISTRIBUTION: Sample of 100 nos. Taken Histogram drawn and bell shape is witnessed and found process is under statistical control Assume mean is --- 50 Standard deviation is ----1.5 As per Normal distribution theory, Between 48.50 to 51.5 ( i.e +/- 1 Sigma )—there should be 68.20% of readings shall lie Between 47.00 to 53.0 ( i.e +/- 2 Sigma )—there should be 95.4% of readings shall lie Between 45.50 to 54.5 ( i.e +/- 3 Sigma )—there should be 99.73% of readings shall lie i.e From this we can understand approximately 100% of the readings are represented by +/- 3 sigma. Hence this is utilized for calculating Total variation of Process. PROCESS CAPABILITY Total variation ( 6 sigma) of process when process is under statistical control is called process capability PROCESS CAPABILITY INDICES It is not possible for the customer to specify the total variation acceptable to him for each parameter; hence there was a need for developing indices for relating tolerances and the total variation
  • 7. Sunjjoy Uvach 7 PROCESS CAPABILITY Total variation ( 6 sigma) of process when process is under statistical control is called process capability PROCESS CAPABILITY INDICES It is not possible for the customer to specify the total variation acceptable to him for each parameter; hence there was a need for developing indices for relating tolerances and the total variation 6. PROCESS CAPABILITY & INDICES:
  • 8. Sunjjoy Uvach 7. CONTROL CHART STEPS: 1. Gather data & initial study: 1.1 Identify the parameter as per contractual agreement with customer 1.2 Group size 4 to 5 consecutive pieces 1.3 Frequency has to be fixed, continuous, 1/2hr,1hr….depends on the stability of the process ( To identify special causes) 2. Calculate control limits: 2.1 UCL(Upper control limit) and LCL(Lower control limit) to be calculated
  • 9. 3. Interpret for process control : 3.1 If not in control then identify special causes & eliminate. 3.2 Recalculate UCL & LCL 4. Interpret for capability (if in control): 4.1 Calculate standard deviation (sigma) = R bar / d 2. 4.2 Calculate 6 sigma, Cp & Cpk, If Cpk >1.33 then proceed for step 5 4.3 Else initiate corrective action plan to improve Cpk and carryout 100% inspection. 7. CONTROL CHART STEPS:
  • 10. 5.Ongoing control: 5.1 Provide UCL & LCL calculated for Ongoing control, specify the date of calculation of UCL / LCL on the chart to be used for ongoing control 5.2 Prepare reaction plan & link it into control plan 5.3 Train the operator on his / her role 5.4 Review periodically for improvement calculate Cp / Cpk & reviewUCL / LCL if improvement is observed - Repeat steps 5.1-5.4 7. CONTROL CHART STEPS:
  • 11. 8.1 For Variable data 8.1.1 If N(Samples)<10 then x̄-R chart is the flagship of the control charts. It is called variable chart because the data to be plotted result from measurement on a variable or continuous scale 8.1.2 If N(Samples)>10 then x̄-S chart is another variable control chart. In this chart standard deviation s is used to indicate dispersion instead of the range. 8.1.3 The ImR ( Individual and moving range)chart is used when data are expensive or occur at a rate too slow to form rational subgroups contd… 8. CONTROL CHART TYPES:
  • 12. 8.2 For Attribute data: 8.2.1 If sample size varies then p chart is used 8.2.2 If sample is fixed then np chart is used here full batch is taken into consideration 8.2.3 If sample is fixed but a part of data is used then c chart is used. Example: From loan applications approval everyday a fixed no.is cross checked. 8. CONTROL CHART TYPES:
  • 13. 9. FLOW CHART SPC PROCEDURE:
  • 14. 10. OPERATOR ROLE IN SPC :
  • 15. 11. PRECAUTIONS IN SPC : NOTE : 1.After Corrective action taken, the Immediate subgroup shall be measured and plotted. 2.Record in detail the causes, corrective action and disposition action taken for every out of control condition. Concept of over adjustment: - Over adjustment is the practice of treating each deviation from the target as if it were the result of the action of a special cause of variation of the process. - If a stable process is adjusted based on the each measurement made, then the adjustment becomes an additional source of variation. - Adjust the process only based on the indications of control chart and as directed by corrective action plan