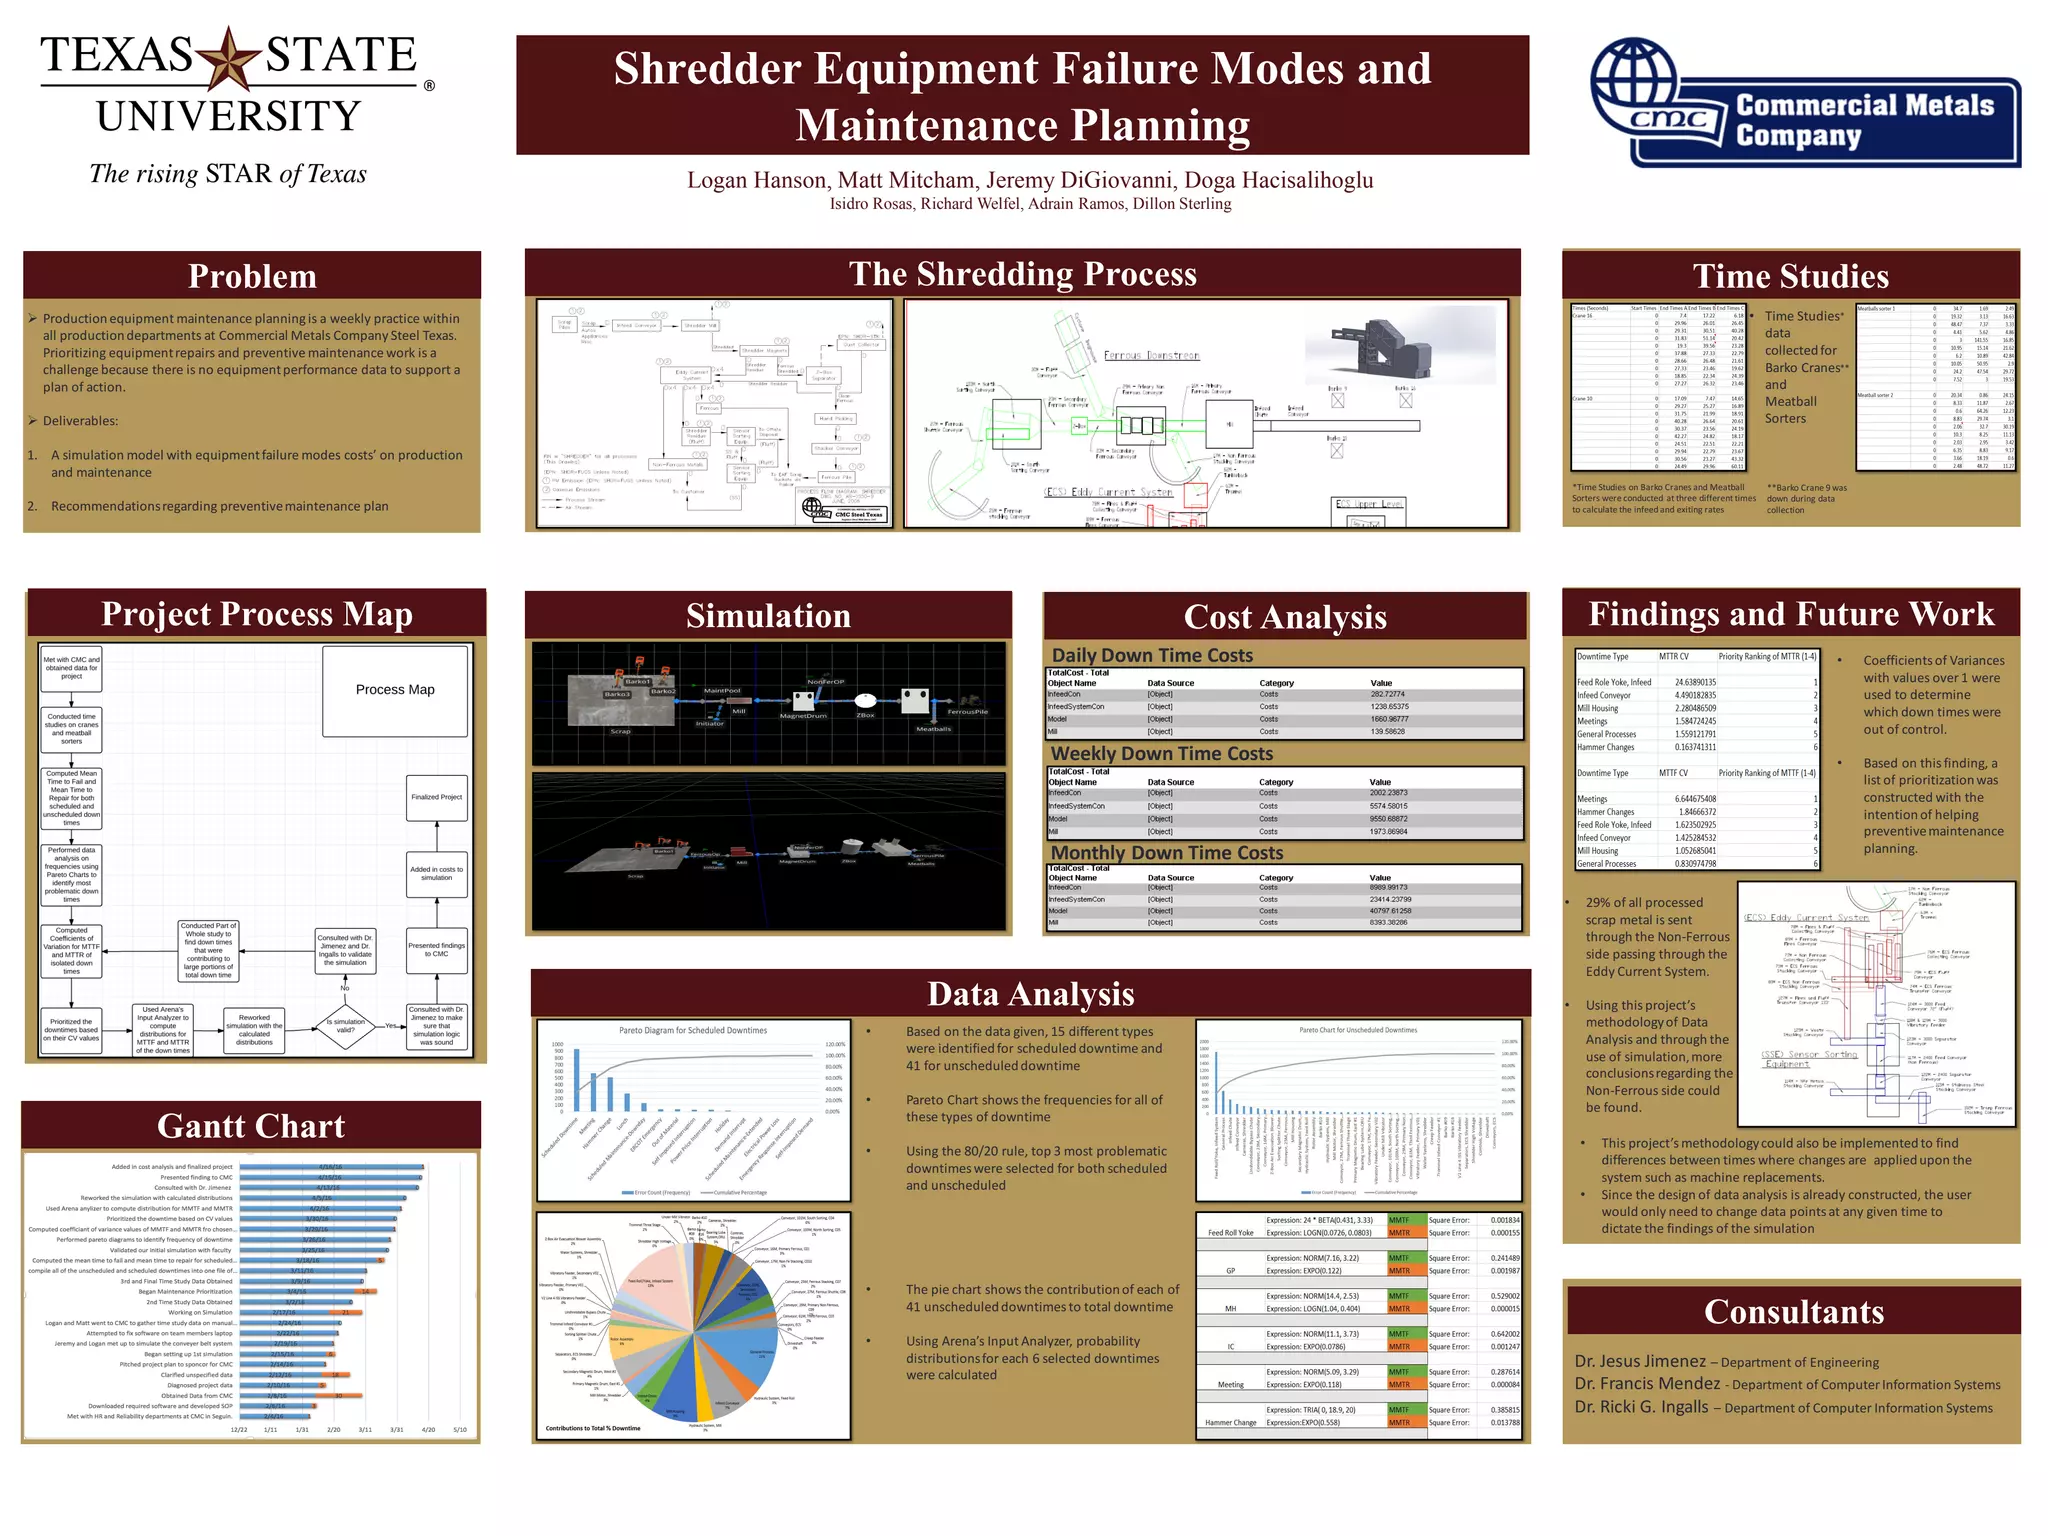
Production equipment maintenance planning at Commercial Metals Company Steel Texas is currently done weekly without the benefit of equipment performance data. A group of consultants was tasked with 1) creating a simulation model of the shredding process that incorporates equipment failure modes and costs of downtime and 2) providing recommendations for preventive maintenance planning. The consultants analyzed downtime data, identified the most frequent and problematic sources of scheduled and unscheduled downtimes, and used this information to construct a prioritization plan intended to help with preventive maintenance planning and reduce costs from equipment failures.