
Downloaded 119 times


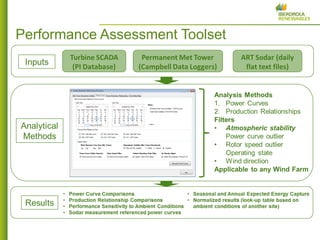

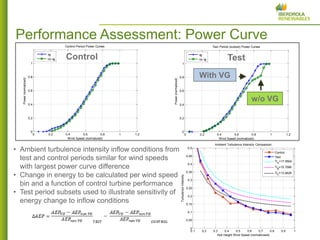
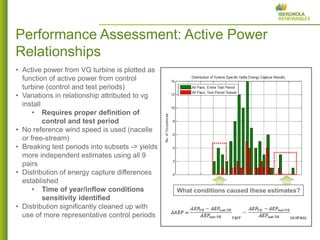
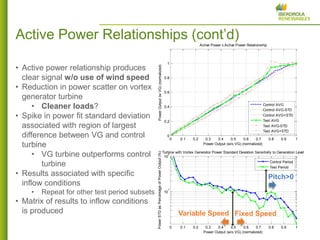
This document discusses challenges and solutions for measuring the performance of vortex generators on wind turbines. It outlines two methods for assessing performance: 1) comparing power curves with and without vortex generators, and 2) comparing the active power relationship between a test turbine using vortex generators and a control turbine. The analysis seeks to closely match the inflow conditions for test and control periods to isolate the effects of the vortex generators while accounting for seasonal and turbulence intensity variations. Preliminary results suggest a potential 1-2% increase in energy capture with vortex generators.


