Download as PDF, PPTX


![Head/tail breaks
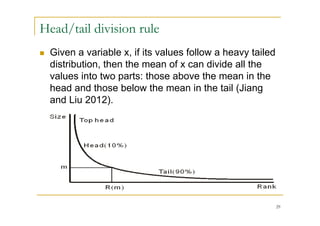
Iteratively apply the head/tail division rule to
dataset with a heavy tailed distribution, untill the
data in head is no longer heavy tailed
distributed, or specifically, the number in the
head is no longer a minority (e.g., < 40%).
Both the number of classes and class intervals
are automatically or naturally determined.
For example, four classes: [min, m1), [m1, m2),
[m2, m3), [m3, max].
Head/tail breaks is more natural than natural
breaks.
31](https://image.slidesharecdn.com/imageofcity2pdf2-120517132753-phpapp01/85/Jiang-INPUT2012-31-320.jpg)
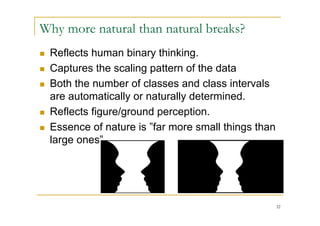
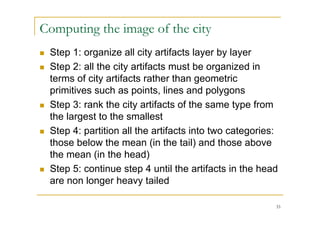
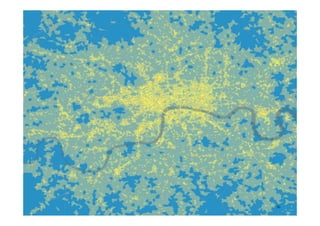
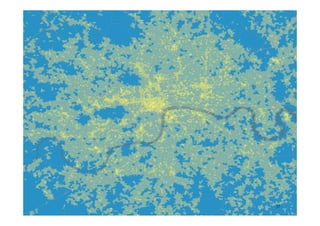


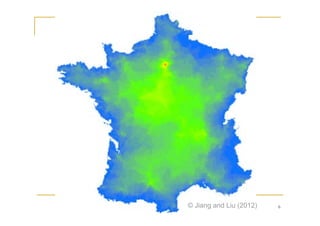
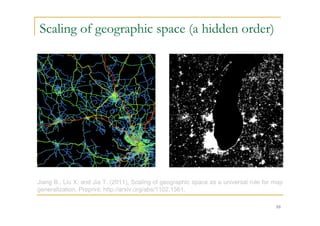
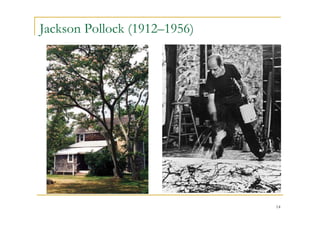
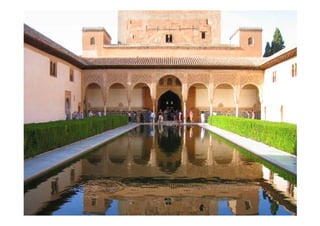
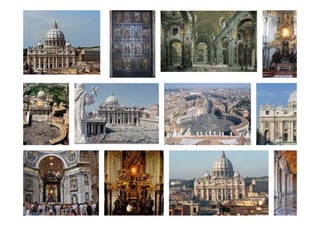
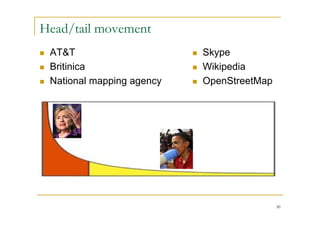
This document proposes a quantitative approach to computing the image of a city. It begins by discussing how the image of a city is traditionally obtained through qualitative interviews. It then introduces concepts like legibility and imageability that contribute to a city's mental image. The core of the proposal is a multi-step process: 1) organizing city artifacts into layers, 2) ranking artifacts by size, 3) partitioning artifacts into "head" and "tail" groups using the mean size as the threshold, and 4) iteratively applying this partitioning until the distribution of large artifacts is no longer heavy-tailed. This process aims to capture the underlying "scaling pattern" common to cities where there are far more small artifacts than large ones. The


![Introto geography[1]](https://cdn.slidesharecdn.com/ss_thumbnails/introtogeography1-130411124640-phpapp02-thumbnail.jpg?width=640&height=640&fit=bounds)


