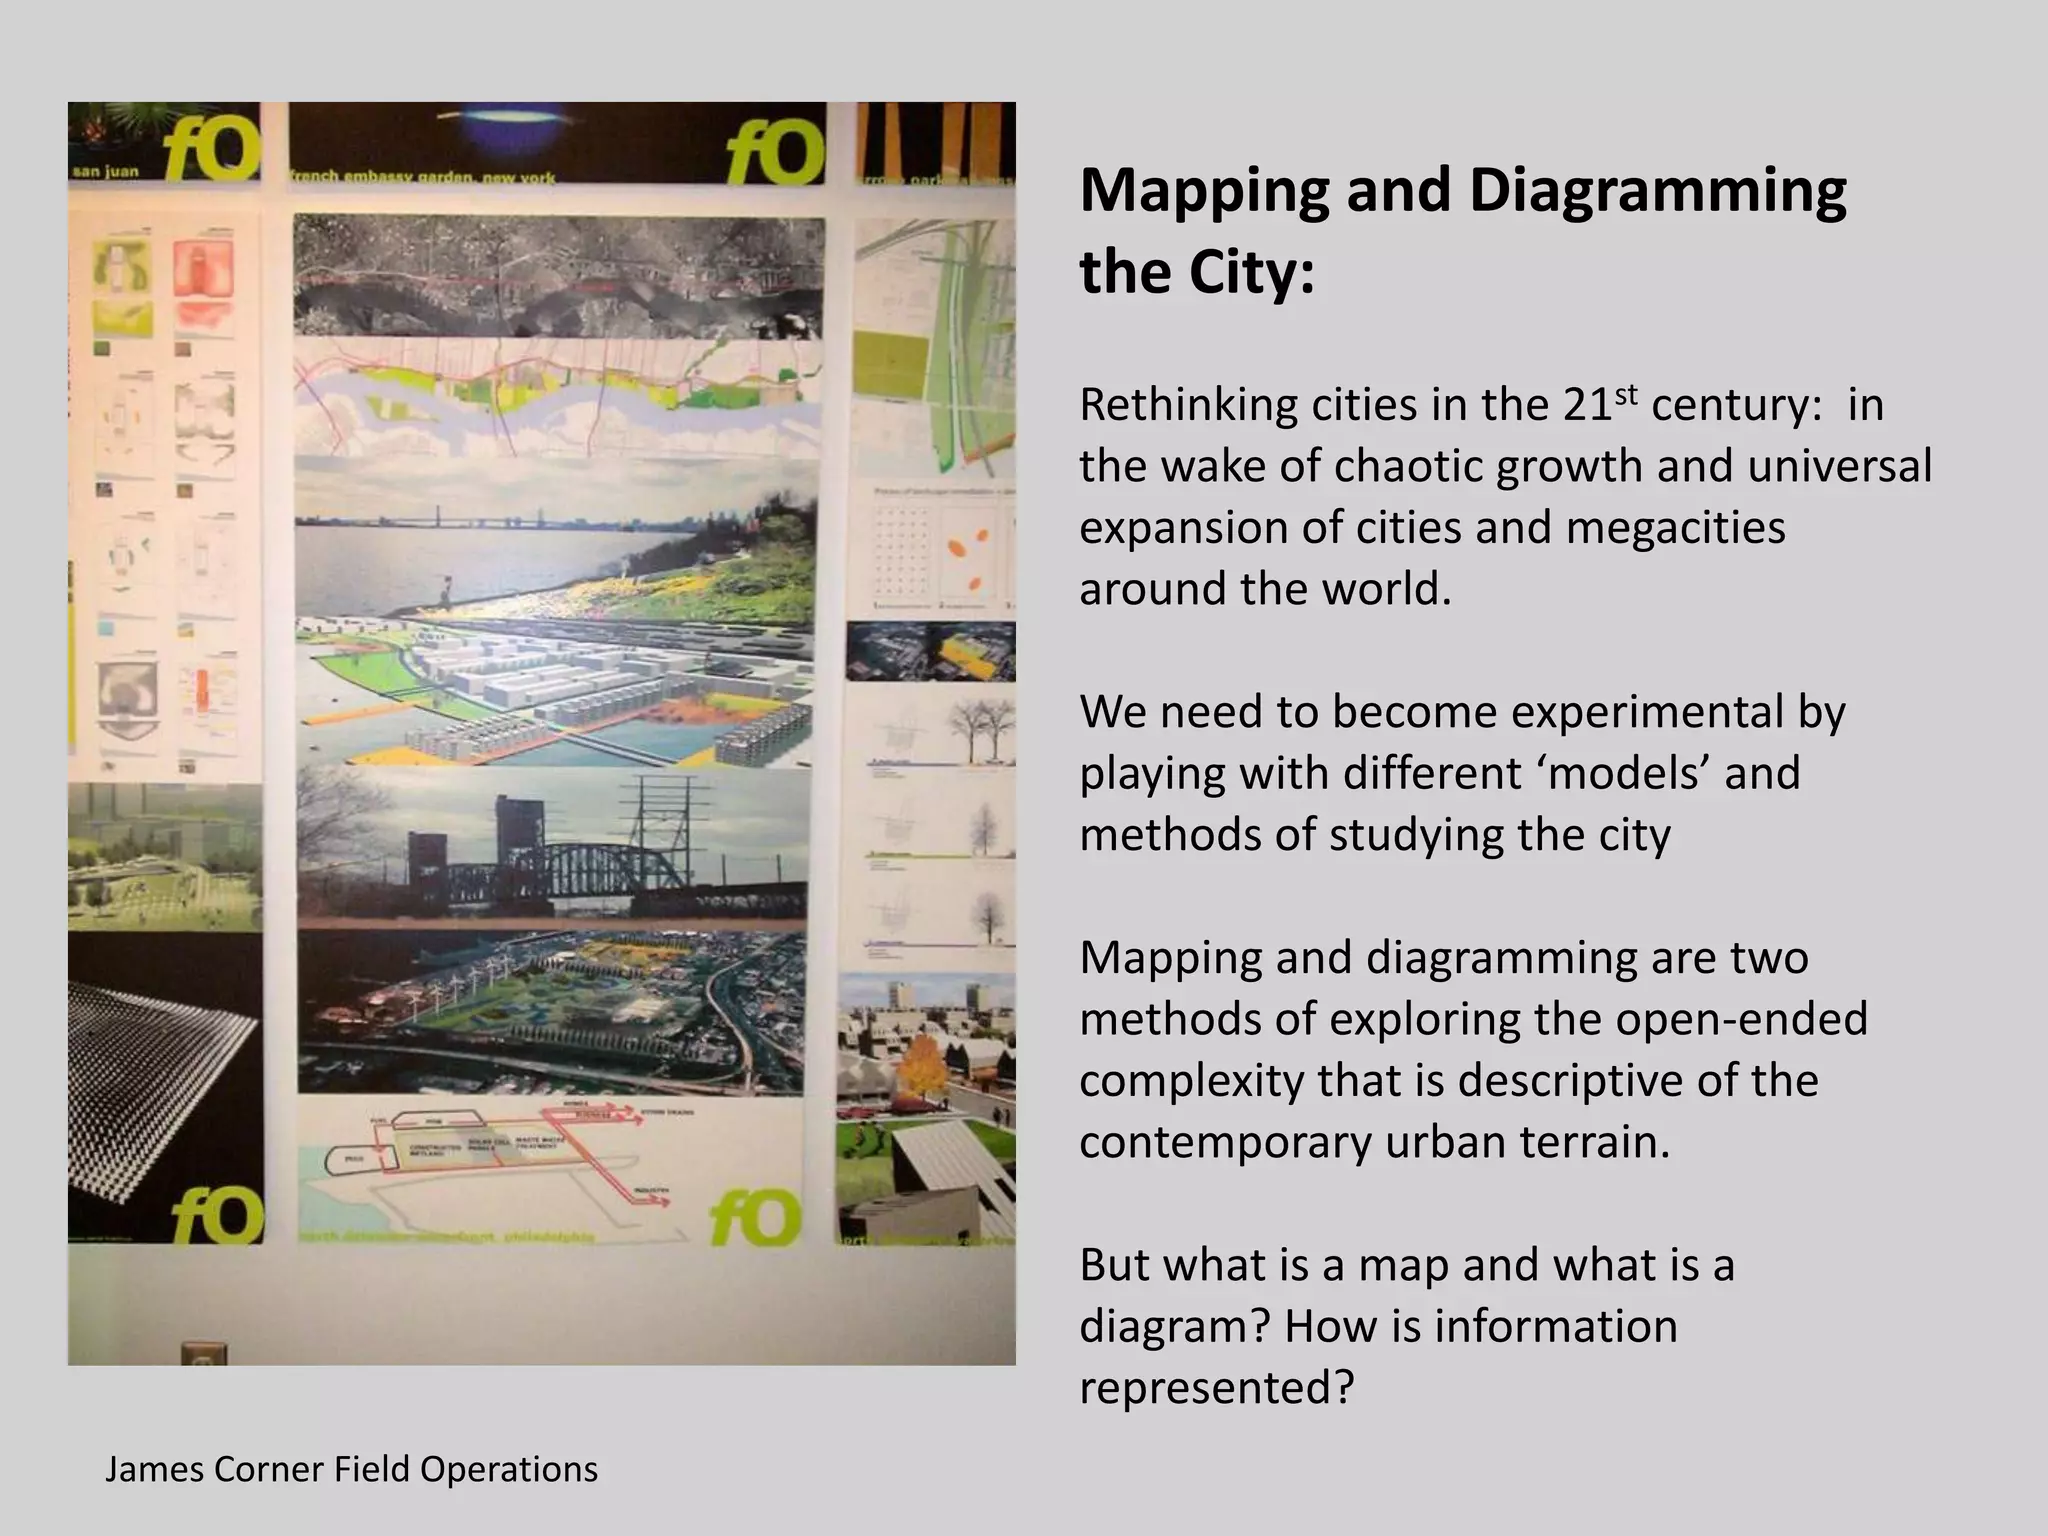
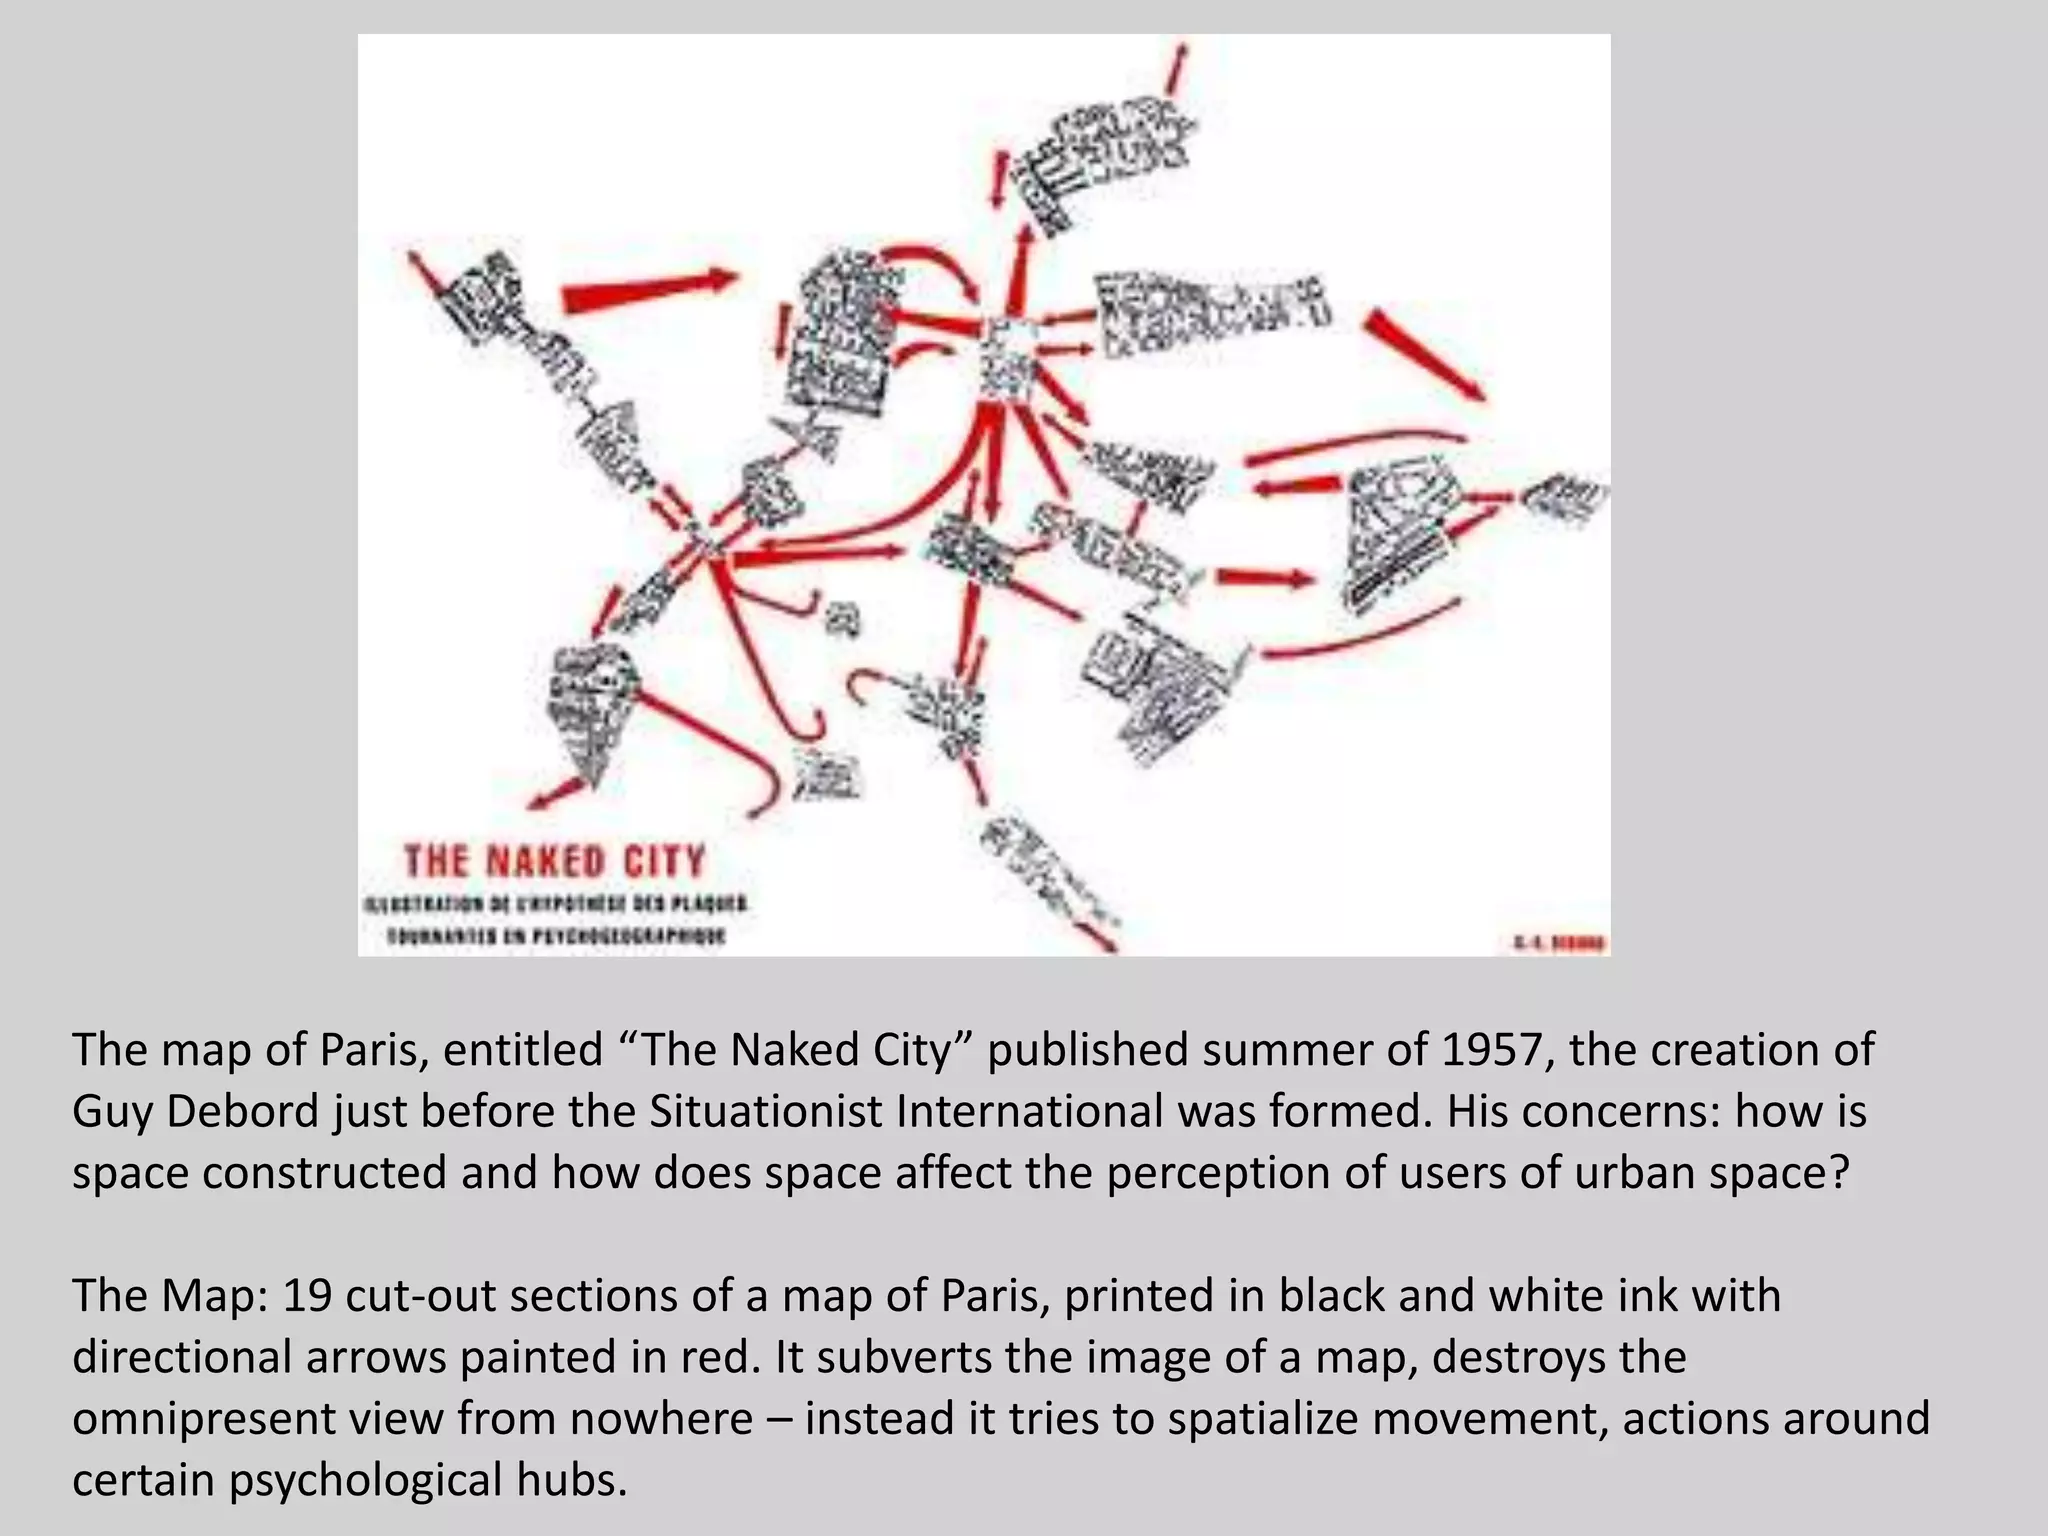
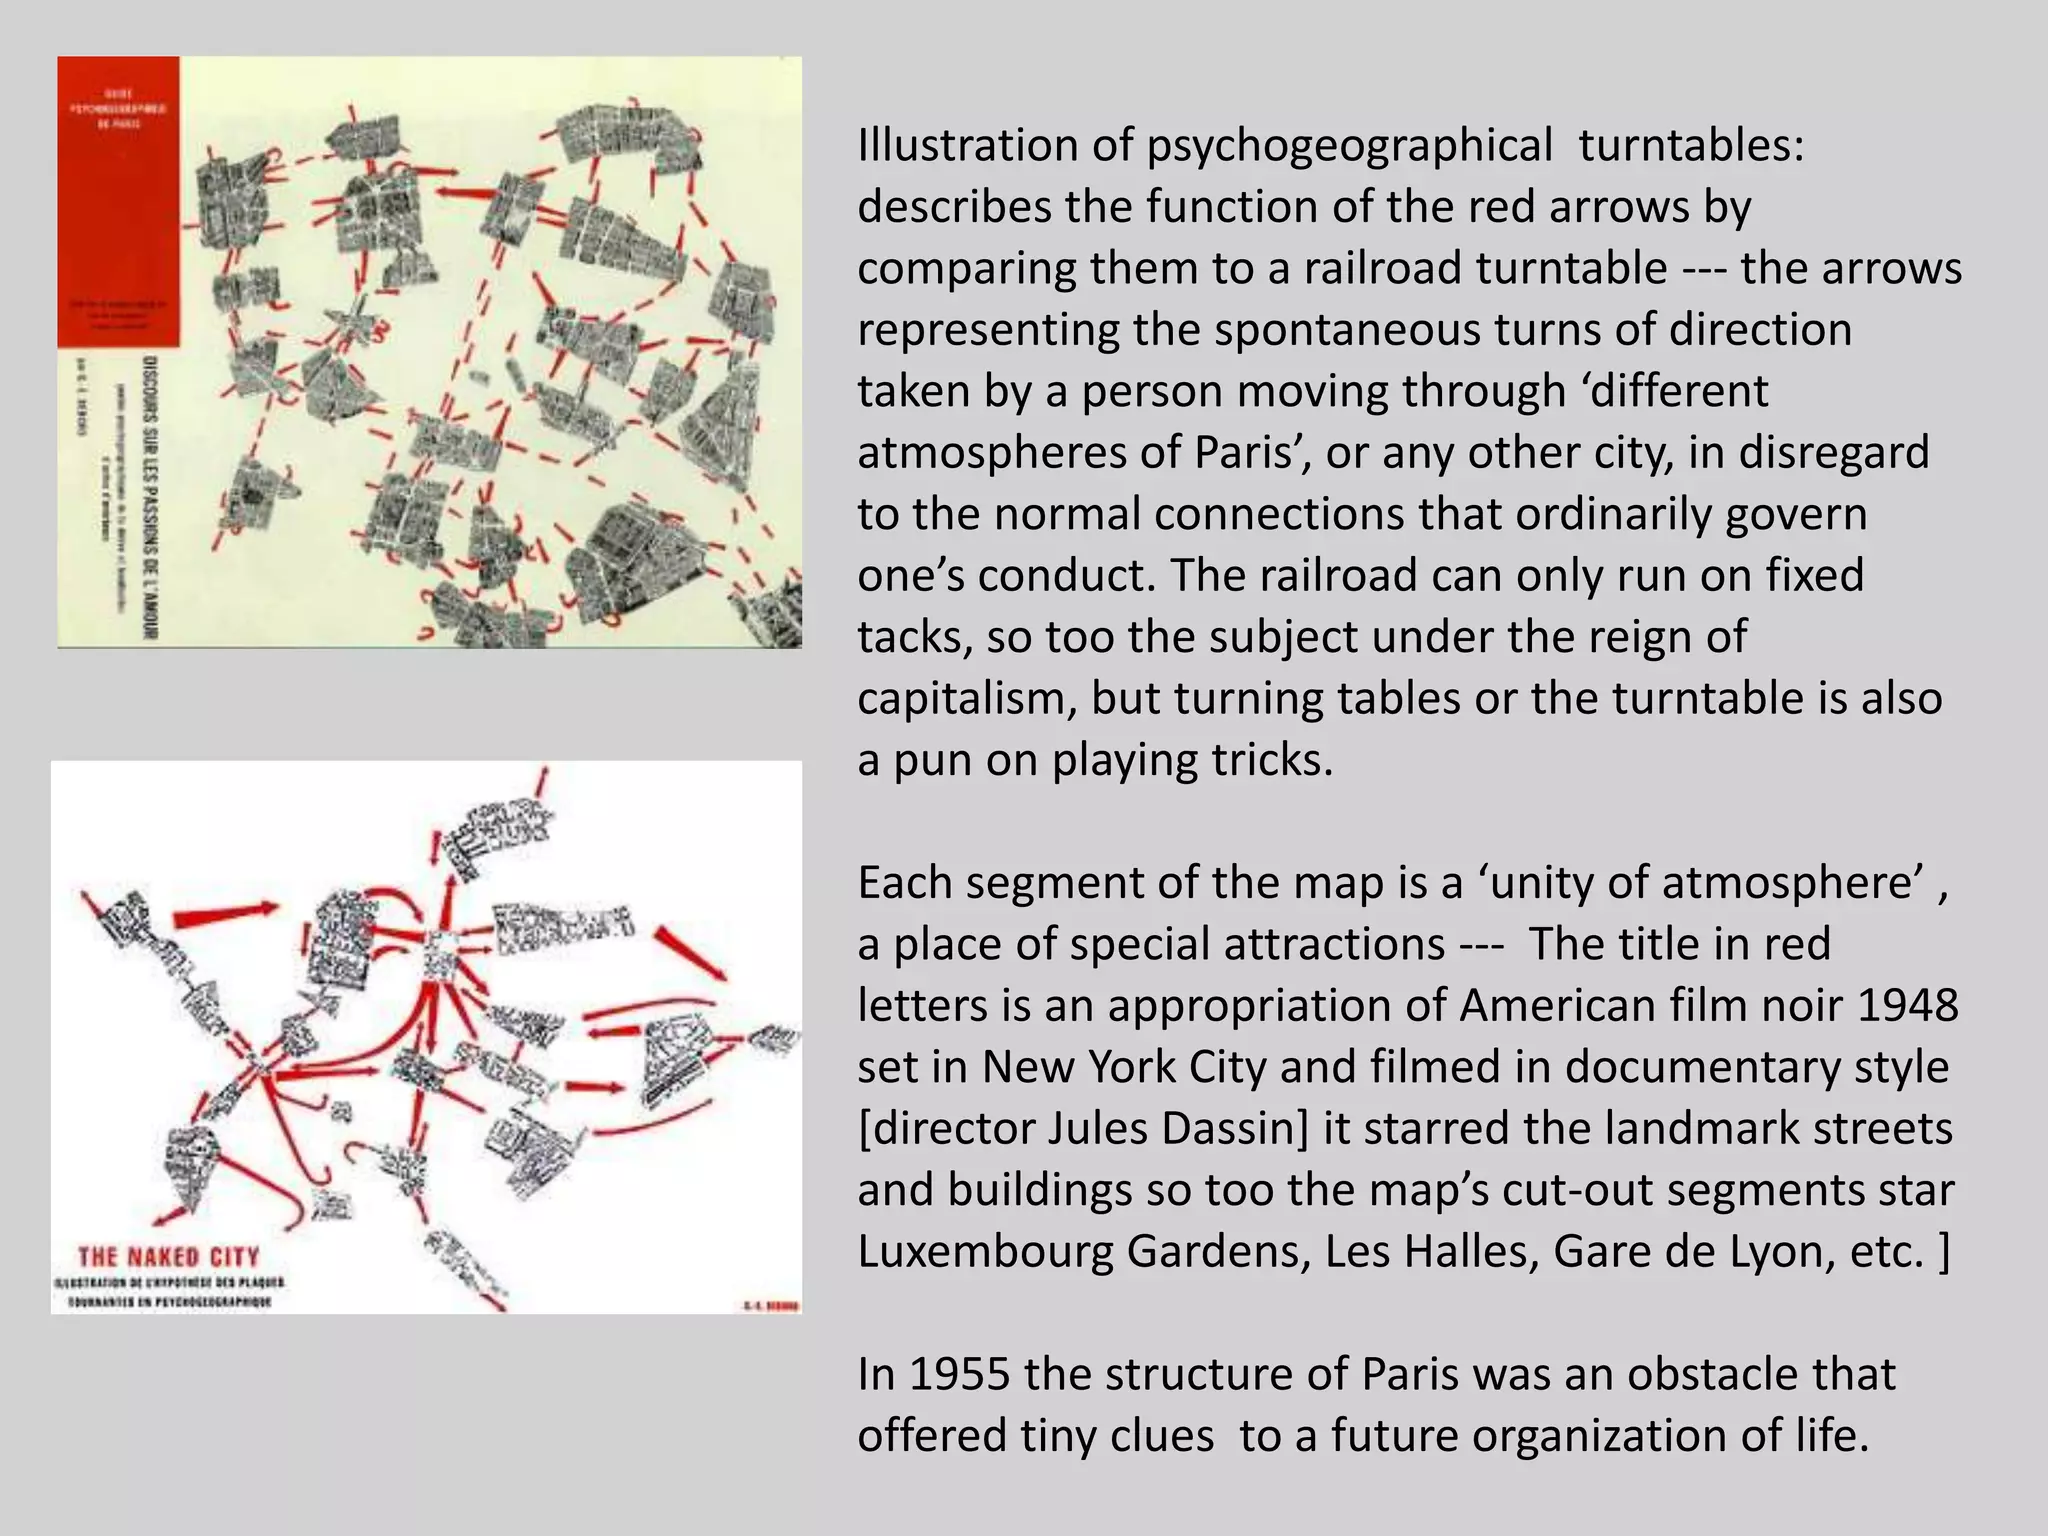
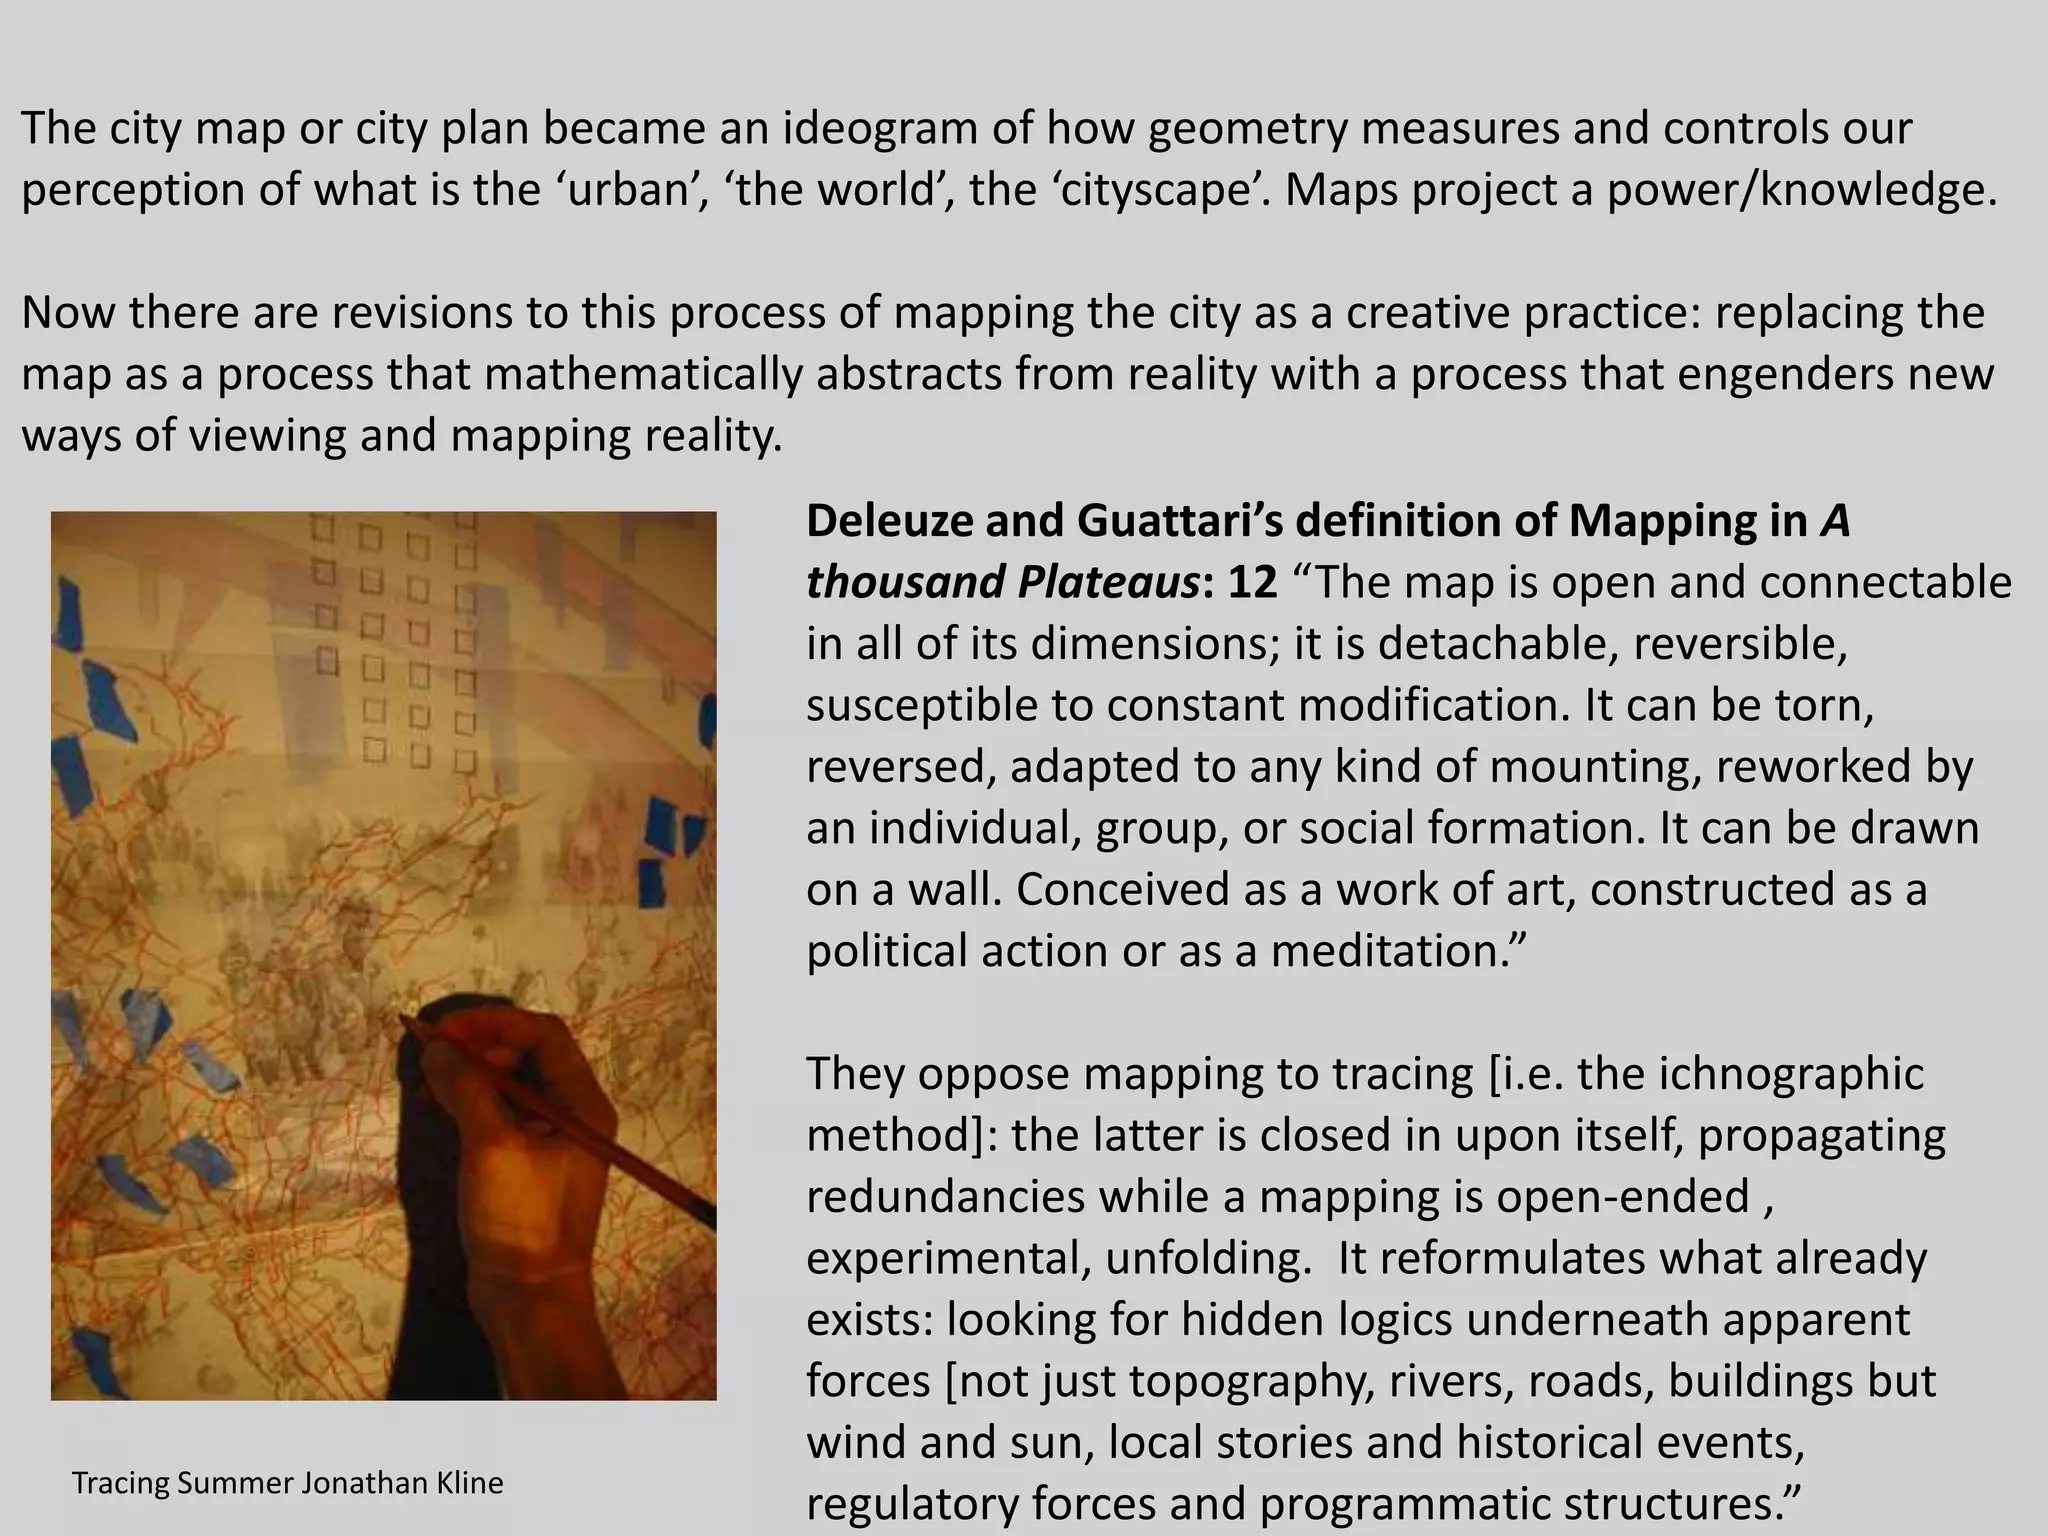
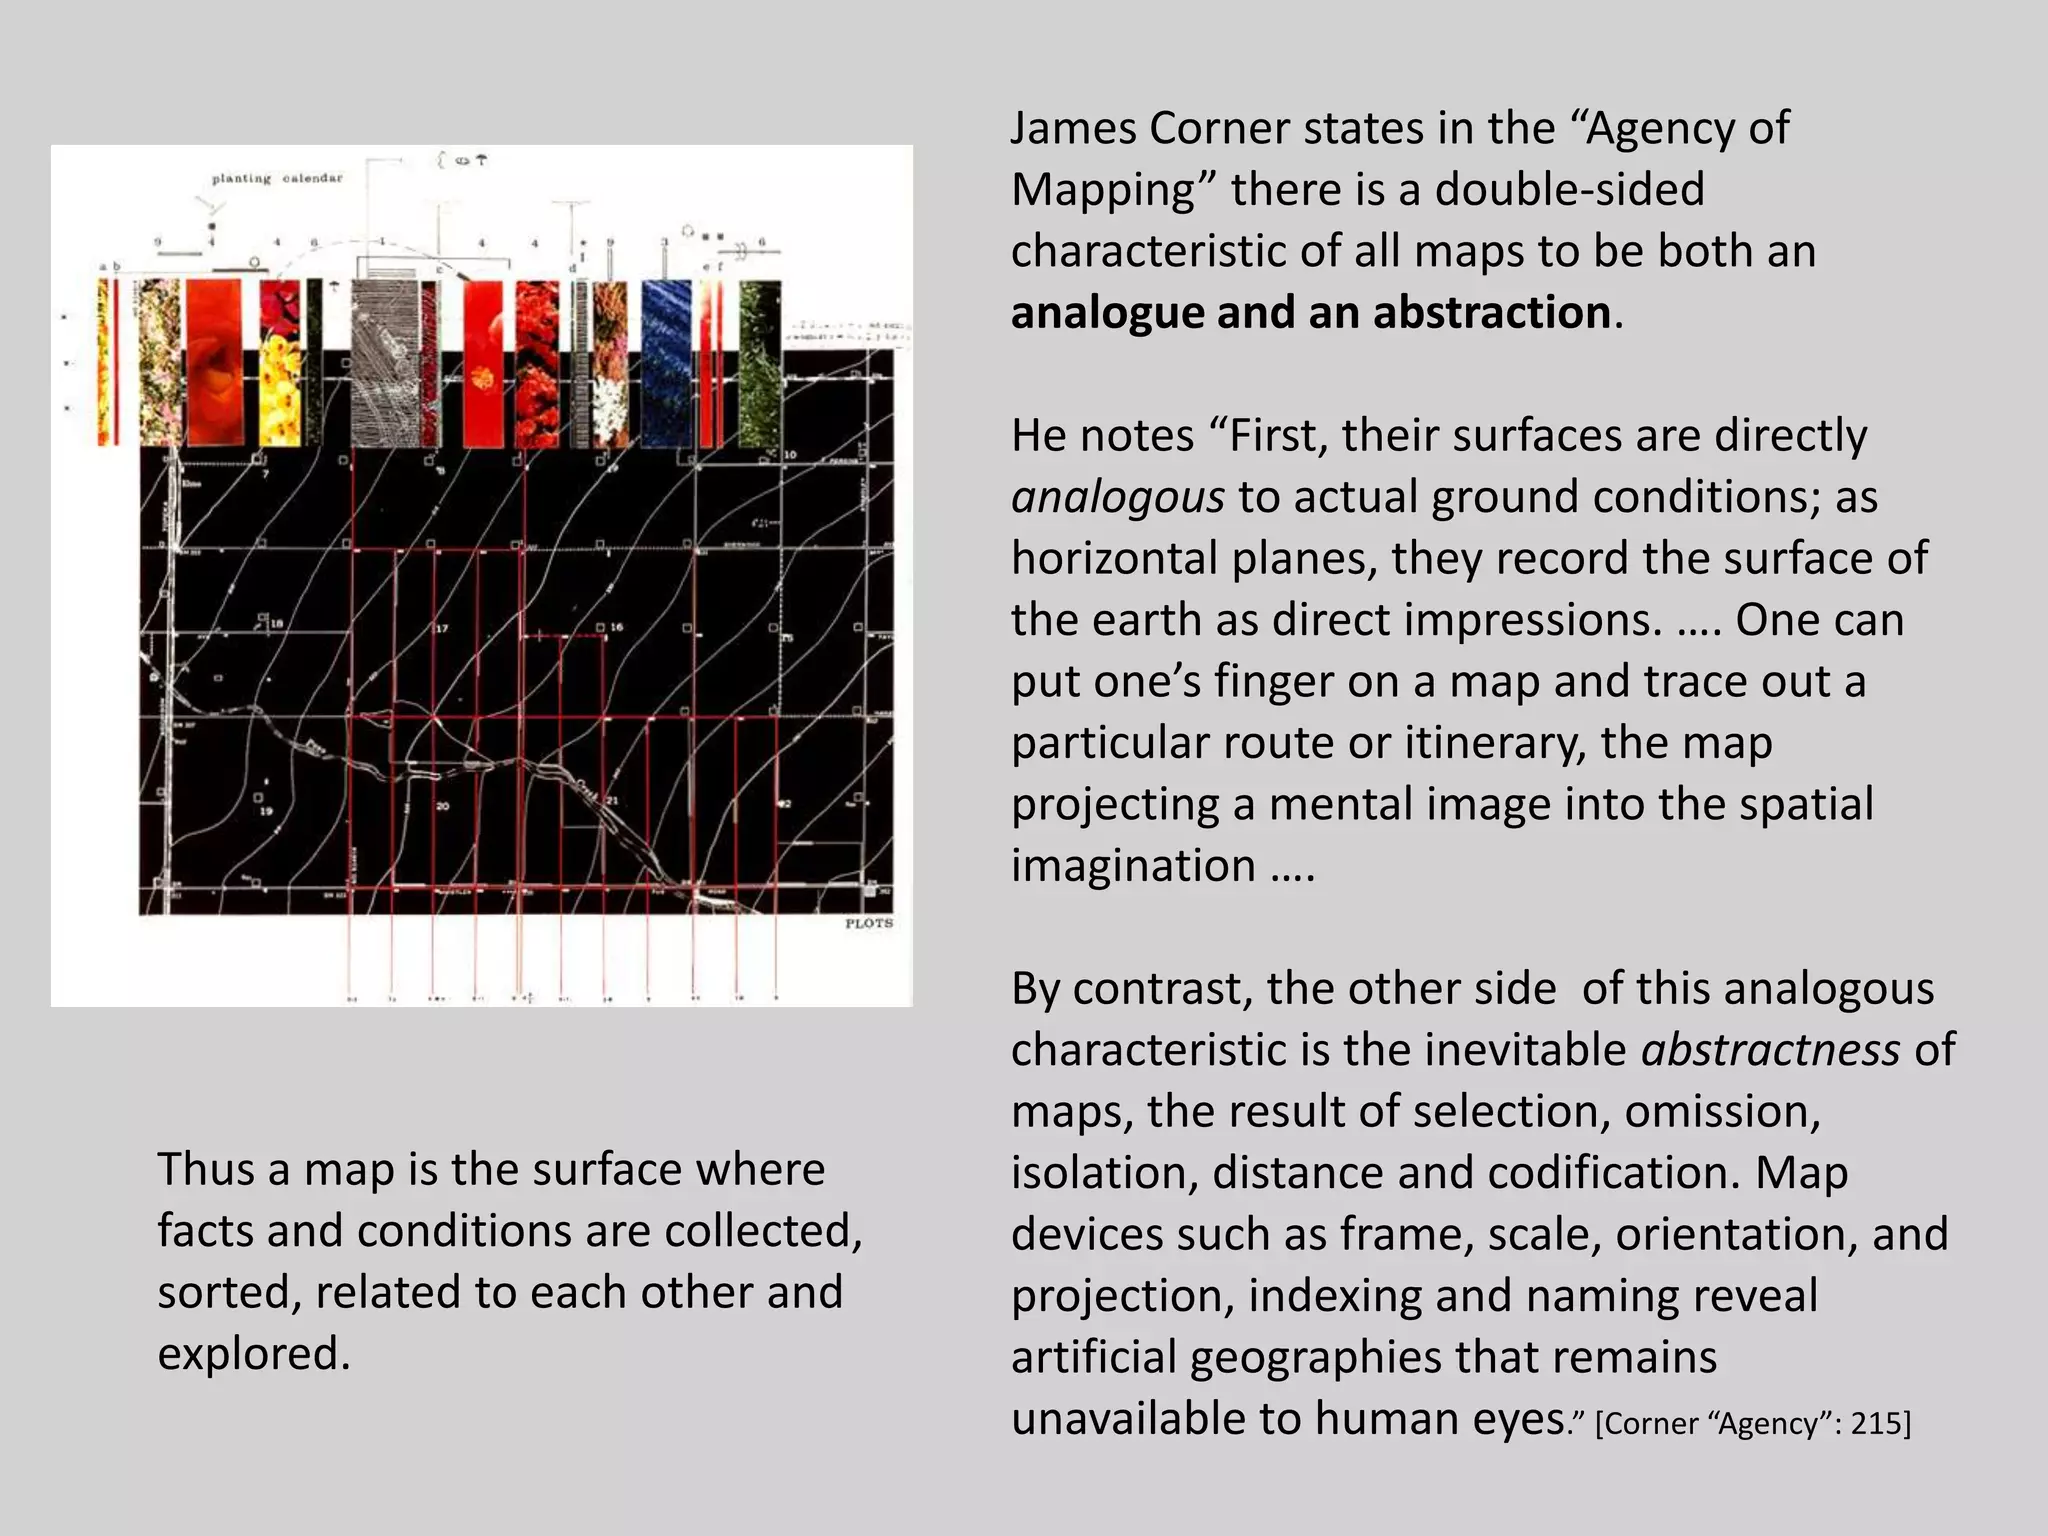
This document discusses various methods of mapping and diagramming cities to understand their complexity. It begins by looking at mapping and diagramming as experimental methods for studying 21st century cities and megacities. It then discusses the differences between maps and diagrams, and how they represent information. A number of examples of historical and conceptual maps and diagrams are provided, ranging from flow charts to psychogeographical maps. These examples illustrate different ways of mapping networks, movements, social classes, and urban atmospheres. The document argues that maps are both analogues of reality but also abstractions, and that new forms of mapping are needed to understand the layered complexity of contemporary cities.
The document discusses the use of lines and traces in spatial planning and urban design. It defines soft lines as joining different perspectives and horizons through synesthesia, while hard or trace lines contain the weight and materiality of places. Traces reflect light and shadows and call to viewers like prints. The document also examines how lines are used in artistic drawings, architectural plans, and spatial experiences to analyze space and represent the necessary exposure of humans in urbanism.
This article is talking about the importance of maps. It tells us the history and usage of map. After reading the map, you will learn how important the maps is in our daily life. It brings us much convenience.
This document provides an overview of cartography. It begins with definitions of cartography and discusses the importance and history of maps. The history section outlines some of the earliest maps from ancient civilizations like Babylonia, Egypt, and Greece. It also describes important contributions from figures like Ptolemy, including his world map and map projections. The document emphasizes that cartography has progressed from early conceptual maps to more accurate representations incorporating scientific principles.
The document discusses map reading and interpretation. It covers relief representation using contour lines on maps, drainage patterns, and human-made features. Students will learn about contour lines, how they represent 3D relief on 2D maps, and how to draw contour lines and cross sections. Contour lines connect points of equal elevation and come in three types: index lines with elevation numbers every fifth line, intermediate lines between the index lines, and supplementary dashed lines for half-interval changes in elevation.
Gives details about maps, projections,their uses and also about data presentation. Made for students for 11th and 12th standard. Also helpful for competitive examinations. This file is made from NCERT books of class 11th and 12th books titled "Practical work in Geography"
A map is a symbolic depiction emphasizing relationships between elements of some space, such as objects, regions, or themes. Many maps are static, fixed to paper or some other durable medium, while others are dynamic or interactive.
Map is a drawn or printed representation of the physical features of the Earth.
It is the best tool to show, understand and analyse the features of an area. Cartography is the art and science of making maps. This module highlights many information on maps, types and their uses.
The document provides an overview of cartography and the key elements involved in mapmaking. It discusses important concepts like map projections, datums, geographic coordinates, and the common elements of maps such as titles, legends, scales, and directional indicators. It also examines different types of map projections including conic, cylindrical, and planar projections; and factors to consider in map design like the target audience, level of detail to include, appropriate use of symbols, colors and labeling. In the end, it shares some examples of excellent maps created by cartographers and acknowledges the sources of information.
Notations are written symbols that represent elements like numbers, music, or mathematics. They are instrumental tools rather than ends in themselves. Diagrams are illustrations that express abstract ideas and concepts. They belong to space and organization, while notations belong to time. Architecture is both autographic, having value in the original, and allographic, being capable of reproduction through notation. Diagrams are used to communicate form and structure or specify relationships between activity and form.
Cartography is the science and art of map making. Maps are representations of areas of the earth on a flat surface and include titles, scales, legends, and source statements. Scale expresses the ratio between distances on a map and in real life using statements of scale, representative fractions, and linear scales. There are different units of measurement for distances and scales can be small, showing larger areas with less detail, or large, showing smaller areas with more detail. Maps are also classified based on their communicative objectives like reference maps or thematic maps, and by their subject matter and function like cadastral, topographic, soil, weather, and population maps.
This document provides an overview of maps, atlases, and globes. It defines maps as pictures of the earth's topography drawn to scale, dividing them into general maps showing features like mountains and cities, and thematic maps focused on specific topics. Maps are also classified by their shape, such as relief maps recreating the land's surface, flat maps on paper, and digital maps viewed electronically. Atlases are compilations of maps bound together in a book, with requirements like a title, publication date, and table of contents. Globes are miniature representations of the entire earth.
This document provides an introduction to maps, including what maps are, why they are made, and how to read them. It discusses that maps are generalized views of areas seen from above that represent spatial relationships in a concise manner. It also covers map scales, symbols, projections, and how topographic maps specifically show both 2D and 3D features through the use of contour lines.
The document discusses the concept of "autocartography", which is creating a map-like composition to write one's autobiography. It provides examples of medieval "mappae mundi", or maps of the world, as models for autocartography since they incorporated personal and cultural elements rather than just geography. The document then summarizes several specific medieval maps and their features, and provides questions to help structure an individual's autocartography process by reflecting on important people, places, stories and histories from their life.
A thematic map is a type of map that focuses on displaying information about a single theme or topic within a geographic area. Thematic maps emphasize specific distributions of phenomena, such as climate, population density, or other social, economic, or agricultural aspects. They show variations and relationships of geographic elements by using symbols instead of focusing on base map details. The purpose is to tell a story about places by mapping spatial patterns rather than just showing where locations are.
Art and math- 6. ISTITUTO DI ISTRUZIONE SUPERIORE "G.LAPIRA"- Mihaela Ursachi
Â
This document discusses the connections between math and art. It explores how concepts from math like perspective and the golden ratio are incorporated into artworks. Perspective involves representing 3D objects in 2D and was pioneered by Filippo Brunelleschi in 1415 using similar triangles. Leonardo Da Vinci also used linear perspective and incorporated the golden ratio in works like the Vitruvian Man. Astronomy has also inspired many artists, and modern artists now create representations of astronomical discoveries like the TRAPPIST-1 exoplanet system.
1. Maps, globes, sketches, plans, diagrams and aerial photographs are used to represent various features of the Earth.
2. Maps show selected features on a flat surface using symbols and colors, making them easy to interpret but some distortion occurs.
3. Globes most accurately show the spherical shape and spatial relationships of Earth's features and lines, but only a portion is visible at once.
4. Different map types, such as political, physical and thematic maps, show boundaries, terrain or climate information respectively.
Continuing Our Look At Primary And Secondary Dataguest2137aa
Â
The document discusses different types of maps and data presentation methods used in geography, including their purposes, characteristics, and limitations. Scatter plots show relationships between two data sets, with the dependent variable on the x-axis. Line graphs show changes over time with all points connected. Maps are important geographical tools that can locate study areas, show spatial patterns, and compare changes over time. Different map types include choropleth, dot, topological, isoline, and sketch maps. Selecting the appropriate map scale and being aware of maps' limitations, like being snapshots in time, are important considerations.
This document provides summaries of 18 influential books related to the development of urban planning as a field from 1909 to 1962. It describes the key ideas and impacts of each book, including foundational works on city planning techniques, the rise of suburbs, new conceptual approaches to urban design, and the growth of planning as a professional discipline and area of academic study. Many of the books discussed still shape planning practice and thinking today.
Maps have evolved over time to become more accurate representations of the world. Early maps from 4000 BC showed where people lived and tax boundaries, while Ptolemy created the first world map in 150 AD using Greek and Roman cartography. In the Middle Ages, maps reflected cultural beliefs and guided pilgrims. Modern technology like GPS and GIS has led to highly accurate digital maps through satellite imagery and data analysis.
Paper presented in the research methodology workshop. The error if any is regretted and suggestions most welcome. Good for students and researchers alike, enjoy.
The document discusses a city map. A city map provides an overview of streets, landmarks, and transportation options in an urban area. It allows people to visualize locations within a city and plan routes to navigate between different points of interest efficiently.
1) Maps are essential tools for military planning and operations as they show terrain features, routes, and other details that cannot be directly observed.
2) Users must understand how to read, interpret, care for, and securely handle maps. Proper map reading skills allow the user to visualize locations and plan movements.
3) Maps contain marginal information to guide the reader, such as the scale, edition number, legend, grids, and coordinates which are used to accurately reference locations. Military symbols overlay tactical information.
This geography assignment asks students to draw a map of their "Dream Island" that includes key map elements. Students should sketch the island first, then add main features in pencil before finer details. The map should have a border, orientation, legend, title, and both linear and ratio scales to receive full marks. Creativity, symbols used, neatness, accuracy, and inclusion of all BOLTS elements will be assessed.
Maps represent the three-dimensional Earth on a two-dimensional surface, inevitably introducing some distortion. Different map projections attempt to minimize this distortion in different ways, prioritizing accuracy of shapes, areas, or distances depending on the projection. No single projection can accurately depict the entire globe without compromising some property of geographic accuracy.
The earliest known maps date back 16,500 BCE and were found on cave walls in France, mapping out parts of the night sky. Ancient Babylonians created clay tablet maps around 700 BCE showing cities and geographic features. Greeks like Hecataeus and Ptolemy greatly advanced cartography, with Ptolemy creating one of the first world atlases in the 2nd century CE. Modern mapping has been driven by exploration, war, science and technology, with innovations like satellite imagery, GIS systems, Google Earth, and mobile GPS mapping.
The document discusses different types of world maps and map projections. It begins by defining what a map is and providing a brief history of mapmaking. It then explains several famous historical maps, such as Ptolemy's map of the world and the 15th century map of Toscanelli. The document also covers different types of map projections like Mercator, azimuthal, and Lambert projections. It concludes by listing some common themes of world maps, such as physical, climate, and travel maps.
The document discusses different types of world maps and map projections. It begins by defining what a map is and providing a brief history of mapmaking. It then explains several classic map projections like Mercator, azimuthal, and gnomonic. The document also covers common world map themes like political, physical, climate and economy maps. It identifies key parts of maps like compass roses and legends. Overall, the document provides a comprehensive overview of world maps and map projections.
Basic geography (graphic presentation of the earth)Dane Bacasno
Â
Maps and globes are valuable tools for geography that show the shapes, sizes, locations, and patterns of distribution of natural and human features on Earth's surface. A map is a graphical representation of all or part of the Earth on a flat surface that presents information about the world, such as population patterns or rainfall. One of the earliest known maps dates back 4,000 years to Mesopotamia, and the art of cartography or mapmaking is believed to have originated from ancient Greece, where scholars like Eratosthenes and Ptolemy developed early maps and theories about the size and shape of Earth. Modern cartography has been enhanced by technologies like air photography, computing, and satellite imagery.
Stephen graham lucy hewitt cities and verticality pptStephen Graham
Â
The document discusses the need for critical urban research to adopt a more three-dimensional, "vertical" perspective in line with the radical vertical extensions of modern built environments. It highlights four main themes: 1) the cultural politics of the aerial view in urban planning, 2) the vertical dimensions of building up and down through structures like skyscrapers and underground complexes, 3) the new "military urbanism" dominated by vertical surveillance technologies, and 4) possibilities for vertical forms of counterpolitics and democratic urbanism. The document calls for connecting analyses of the vertical dimensions of cities to broader social, political, and ecological contexts of urban life.
This document provides background information on Urbano Monte, a 16th century Italian cartographer, and his remarkable 60-sheet manuscript world map from 1587. It discusses Monte's family and upbringing in Milan, his scholarly interests in geography later in life, and his ambition to publish his geographic treatise and planisphere. The map, which is over 3 meters in diameter, is one of the largest maps from the 16th century. It provides insight into geographic knowledge and cartographic techniques of the late Renaissance period. The document also notes the map's recent acquisition and digitization, allowing it to now be studied in depth for the first time.
This document outlines the history of data visualization from early cave drawings to modern interactive dashboards and data discovery tools. It describes some key developments such as the first maps created by ancient civilizations to plot star movements and plan cities, early statistical line graphs in the 1600s, and the emergence of interactive visualizations and cartographic data tools in the late 20th century enabled by new software and publicly available data on the internet. The history shows how data visualization has advanced from simple depictions to sophisticated ways of visually representing large amounts of information.
This document provides an overview of maps, atlases, and globes. It defines maps as pictures of the earth's topography drawn to scale, dividing them into general maps showing features like mountains and cities, and thematic maps focused on specific topics. Maps are also classified by their shape as relief maps, flat maps, or digital maps. The document outlines key requirements for good maps including equivalence, equidistance, and clarity. It also discusses the history of early maps and modern mapping technologies. Atlases are defined as compilations of maps in a book, with requirements including a title, publication date, and table of contents. Globes are defined as miniature representations of the earth.
Copy copy copy | Psychology of communications conference | 28 June 2018CharityComms
Â
Mark Earls, pioneering and award-winning writer and consultant on marketing, communications and behaviour change
Visit the CharityComms website to view slides from past events, see what events we have coming up and to check out what else we do: www.charitycomms.org.uk
The document discusses six students' analyses of Liverpool and Barcelona using various urban theorists, including Kevin Lynch, Jane Jacobs, Gordon Cullen, and Christopher Alexander.
Natalia Kaminska analyzes three districts in Liverpool (Liverpool One, Ropewalks, and The Waterfront) using Kevin Lynch's theory of paths, nodes, edges, districts, and landmarks to understand how people navigate the city. She describes each area and applies Lynch's elements to examine individual perception and wayfinding.
The other students will similarly apply theories from Lynch, Jacobs, Cullen, and Alexander to analyze various neighborhoods in Barcelona, examining aspects like safety, movement through space, and formation of public spaces. The goal is to
This document provides an overview of topics to be covered in a class on cities, everyday life, and space as relationships. The topics include:
- Why cities are important in today's world with most people living in cities
- Studying cities and everyday life through various academic lenses
- How space is a social and political construction that reproduces power dynamics
- Different practices of mapping space, from traditional to more creative/experiential approaches
- Analyzing cities through film and how film has both represented and shaped perspectives of urban areas
- An assignment involving collaborative group work to cognitively map an area through non-traditional means.
The document discusses early modern cartography of the borderlands between Croatia and the Ottoman Empire, Venice, and the Habsburg Empire from the 16th to 18th centuries. It analyzes how the three imperial powers approached mapmaking differently based on their needs and priorities, and how their maps reflected geopolitical realities and identities of the time period. Borderlands and identities were complex and multifaceted, as maps from all sides incorporated elements of both reality and imagination according to the mapmaker's context.
A recent Nature article by Meredith Reba et al. has performed a valuable service in spatialising the data provided in Tertius Chandlerâs Four Thousand Years of Urban Growth, and George Modelskiâs World Cities -3000 to 2000. The purpose of this essay is to explore the large scale urbanisation data for Eurasia in graphical form. Beginning with the urban revolution of the third millennium BCE the essay traces the development of large cities through to 1600 CE. The essay demonstrates that large scale urbanisation only began in northern and western Europe under the influence of the Roman Empire and was soon in retreat. Large cities did not appear in Europe again until the Is- lamic Empire extended into Spain. While large scale urbanisation continued elsewhere, urban centres in Europe were overwhelmingly small. When large scale urbanisation finally took off in Europe it was as part of a more general upsurge in urbanisation across Eurasia. Even as late as 1600 CE northern and western Europe lagged behind the eastern end of the Eurasian continent in terms of large scale urbanisation. [corrected version 2019/03/11]
This presentation discusses how maps, diagrams, and timelines can provide inspiration for interactive design. It provides several examples from history:
- Maps like the Peutinger Table and Erhard Etzlaub's Romweg map that visualize networks through link-node diagrams.
- Harry Beck's 1933 London Underground map that distorted space to improve legibility and fit a regular grid.
- Joseph Priestley's invention of the timeline in 1765 to align cultures, categories, and chronology in history and biography.
- Fritz Kahn's "Man as an Industrial Palace" diagram from the 1920s explaining biological processes through mechanical metaphor.
- Modern examples like the Olympics race data visualization using a pool as a data grid
Making Sense of the World through Visual Analysis and Narration.
A brief historical overview over visualization compiled by Prof. Boris MĂŒller and myself at the Interface design programme of the University of Applied Sciences Potsdam.
The document discusses Walter Freeman, a neurologist who performed lobotomies on over 3,500 patients between 1936-1967. Freeman was also an avid photographer who took photos of patients before and after their operations. The presentation details efforts to understand Freeman's photographic practices and how they relate to the visual culture of psychiatry using computer-assisted image analysis. It also discusses concepts of iconography, iconology, and deep mapping in spatial histories.
The document traces the history and development of maps from ancient times to the modern era. It discusses early maps created by Greek cartographers like Hecataeus, who depicted the world as a flat disc centered on Greece. Later maps showed the spherical earth concept accepted by Aristotle. Claudius Ptolemy created the first map to project the spherical earth onto a flat surface. During the medieval period, maps were dominated by religious views and placed Jerusalem at the center. Modern cartography advanced with explorers like Columbus and new mapmaking technologies. The first modern atlas was produced in the early 16th century.
Maps, Diagrams and Timelines, Inspiration for Interactive Design - Webinar 20...Mad*Pow
Â
The map, the diagram and the timeline are an integral part of our interactive design vocabulary. As we confront our next User Experience and Interactive Design assignments, where can we turn for inspiration? What are the information design principles and techniques that great maps and diagrams share? Where did these principles come from? Experience Design Director, Paul Kahn tells all!
Check out the full presentation on Vimeo: bit.ly/OjVsgG
The European Renaissance_History Of Mathematics(Rigino)Rigino Macunay Jr.
Â
The document discusses developments in mathematics during the Renaissance period from the 14th to 17th centuries. Some key points covered include:
- The Renaissance marked a rebirth of interest in ancient Greek and Roman knowledge and culture.
- Important mathematicians like Regiomontanus, Luca Pacioli, and Rafael Bombelli helped establish algebra and made advances in calculating square roots and solving equations.
- Trigonometry advanced through the work of Copernicus, Rheticus, and Regiomontanus, who created early trigonometric tables.
- Other areas of mathematics like geometry, cartography, and applications to fields like mechanics and optics also progressed during this period.
This document discusses the history of satirical maps of Europe between 1845-1945. [1] It describes how in the 17th century, maps depicted peoples and places around the borders in a decorative, symbolic way. [2] In the 19th century, a new genre of political cartoon maps emerged that caricatured individual European nations and reflected contemporary political upheavals. [3] These maps used symbols like Marianne for France or John Bull for Britain to represent national identities in a humorous way.
Skybuffer SAM4U tool for SAP license adoptionTatiana Kojar
Â
Manage and optimize your license adoption and consumption with SAM4U, an SAP free customer software asset management tool.
SAM4U, an SAP complimentary software asset management tool for customers, delivers a detailed and well-structured overview of license inventory and usage with a user-friendly interface. We offer a hosted, cost-effective, and performance-optimized SAM4U setup in the Skybuffer Cloud environment. You retain ownership of the system and data, while we manage the ABAP 7.58 infrastructure, ensuring fixed Total Cost of Ownership (TCO) and exceptional services through the SAP Fiori interface.
Main news related to the CCS TSI 2023 (2023/1695)Jakub Marek
Â
An English đŹđ§ translation of a presentation to the speech I gave about the main changes brought by CCS TSI 2023 at the biggest Czech conference on Communications and signalling systems on Railways, which was held in Clarion Hotel Olomouc from 7th to 9th November 2023 (konferenceszt.cz). Attended by around 500 participants and 200 on-line followers.
The original Czech đšđż version of the presentation can be found here: https://www.slideshare.net/slideshow/hlavni-novinky-souvisejici-s-ccs-tsi-2023-2023-1695/269688092 .
The videorecording (in Czech) from the presentation is available here: https://youtu.be/WzjJWm4IyPk?si=SImb06tuXGb30BEH .
The Microsoft 365 Migration Tutorial For Beginner.pptxoperationspcvita
Â
This presentation will help you understand the power of Microsoft 365. However, we have mentioned every productivity app included in Office 365. Additionally, we have suggested the migration situation related to Office 365 and how we can help you.
You can also read: https://www.systoolsgroup.com/updates/office-365-tenant-to-tenant-migration-step-by-step-complete-guide/
Introduction of Cybersecurity with OSS at Code Europe 2024Hiroshi SHIBATA
Â
I develop the Ruby programming language, RubyGems, and Bundler, which are package managers for Ruby. Today, I will introduce how to enhance the security of your application using open-source software (OSS) examples from Ruby and RubyGems.
The first topic is CVE (Common Vulnerabilities and Exposures). I have published CVEs many times. But what exactly is a CVE? I'll provide a basic understanding of CVEs and explain how to detect and handle vulnerabilities in OSS.
Next, let's discuss package managers. Package managers play a critical role in the OSS ecosystem. I'll explain how to manage library dependencies in your application.
I'll share insights into how the Ruby and RubyGems core team works to keep our ecosystem safe. By the end of this talk, you'll have a better understanding of how to safeguard your code.
Programming Foundation Models with DSPy - Meetup SlidesZilliz
Â
Prompting language models is hard, while programming language models is easy. In this talk, I will discuss the state-of-the-art framework DSPy for programming foundation models with its powerful optimizers and runtime constraint system.
Discover top-tier mobile app development services, offering innovative solutions for iOS and Android. Enhance your business with custom, user-friendly mobile applications.
HCL Notes und Domino Lizenzkostenreduzierung in der Welt von DLAUpanagenda
Â
Webinar Recording: https://www.panagenda.com/webinars/hcl-notes-und-domino-lizenzkostenreduzierung-in-der-welt-von-dlau/
DLAU und die Lizenzen nach dem CCB- und CCX-Modell sind fĂŒr viele in der HCL-Community seit letztem Jahr ein heiĂes Thema. Als Notes- oder Domino-Kunde haben Sie vielleicht mit unerwartet hohen Benutzerzahlen und LizenzgebĂŒhren zu kĂ€mpfen. Sie fragen sich vielleicht, wie diese neue Art der Lizenzierung funktioniert und welchen Nutzen sie Ihnen bringt. Vor allem wollen Sie sicherlich Ihr Budget einhalten und Kosten sparen, wo immer möglich. Das verstehen wir und wir möchten Ihnen dabei helfen!
Wir erklĂ€ren Ihnen, wie Sie hĂ€ufige Konfigurationsprobleme lösen können, die dazu fĂŒhren können, dass mehr Benutzer gezĂ€hlt werden als nötig, und wie Sie ĂŒberflĂŒssige oder ungenutzte Konten identifizieren und entfernen können, um Geld zu sparen. Es gibt auch einige AnsĂ€tze, die zu unnötigen Ausgaben fĂŒhren können, z. B. wenn ein Personendokument anstelle eines Mail-Ins fĂŒr geteilte Mailboxen verwendet wird. Wir zeigen Ihnen solche FĂ€lle und deren Lösungen. Und natĂŒrlich erklĂ€ren wir Ihnen das neue Lizenzmodell.
Nehmen Sie an diesem Webinar teil, bei dem HCL-Ambassador Marc Thomas und Gastredner Franz Walder Ihnen diese neue Welt nĂ€herbringen. Es vermittelt Ihnen die Tools und das Know-how, um den Ăberblick zu bewahren. Sie werden in der Lage sein, Ihre Kosten durch eine optimierte Domino-Konfiguration zu reduzieren und auch in Zukunft gering zu halten.
Diese Themen werden behandelt
- Reduzierung der Lizenzkosten durch Auffinden und Beheben von Fehlkonfigurationen und ĂŒberflĂŒssigen Konten
- Wie funktionieren CCB- und CCX-Lizenzen wirklich?
- Verstehen des DLAU-Tools und wie man es am besten nutzt
- Tipps fĂŒr hĂ€ufige Problembereiche, wie z. B. Team-PostfĂ€cher, Funktions-/Testbenutzer usw.
- Praxisbeispiele und Best Practices zum sofortigen Umsetzen
zkStudyClub - LatticeFold: A Lattice-based Folding Scheme and its Application...Alex Pruden
Â
Folding is a recent technique for building efficient recursive SNARKs. Several elegant folding protocols have been proposed, such as Nova, Supernova, Hypernova, Protostar, and others. However, all of them rely on an additively homomorphic commitment scheme based on discrete log, and are therefore not post-quantum secure. In this work we present LatticeFold, the first lattice-based folding protocol based on the Module SIS problem. This folding protocol naturally leads to an efficient recursive lattice-based SNARK and an efficient PCD scheme. LatticeFold supports folding low-degree relations, such as R1CS, as well as high-degree relations, such as CCS. The key challenge is to construct a secure folding protocol that works with the Ajtai commitment scheme. The difficulty, is ensuring that extracted witnesses are low norm through many rounds of folding. We present a novel technique using the sumcheck protocol to ensure that extracted witnesses are always low norm no matter how many rounds of folding are used. Our evaluation of the final proof system suggests that it is as performant as Hypernova, while providing post-quantum security.
Paper Link: https://eprint.iacr.org/2024/257
Your One-Stop Shop for Python Success: Top 10 US Python Development Providersakankshawande
Â
Simplify your search for a reliable Python development partner! This list presents the top 10 trusted US providers offering comprehensive Python development services, ensuring your project's success from conception to completion.
Have you ever been confused by the myriad of choices offered by AWS for hosting a website or an API?
Lambda, Elastic Beanstalk, Lightsail, Amplify, S3 (and more!) can each host websites + APIs. But which one should we choose?
Which one is cheapest? Which one is fastest? Which one will scale to meet our needs?
Join me in this session as we dive into each AWS hosting service to determine which one is best for your scenario and explain why!
Freshworks Rethinks NoSQL for Rapid Scaling & Cost-EfficiencyScyllaDB
Â
Freshworks creates AI-boosted business software that helps employees work more efficiently and effectively. Managing data across multiple RDBMS and NoSQL databases was already a challenge at their current scale. To prepare for 10X growth, they knew it was time to rethink their database strategy. Learn how they architected a solution that would simplify scaling while keeping costs under control.
Dandelion Hashtable: beyond billion requests per second on a commodity serverAntonios Katsarakis
Â
This slide deck presents DLHT, a concurrent in-memory hashtable. Despite efforts to optimize hashtables, that go as far as sacrificing core functionality, state-of-the-art designs still incur multiple memory accesses per request and block request processing in three cases. First, most hashtables block while waiting for data to be retrieved from memory. Second, open-addressing designs, which represent the current state-of-the-art, either cannot free index slots on deletes or must block all requests to do so. Third, index resizes block every request until all objects are copied to the new index. Defying folklore wisdom, DLHT forgoes open-addressing and adopts a fully-featured and memory-aware closed-addressing design based on bounded cache-line-chaining. This design offers lock-free index operations and deletes that free slots instantly, (2) completes most requests with a single memory access, (3) utilizes software prefetching to hide memory latencies, and (4) employs a novel non-blocking and parallel resizing. In a commodity server and a memory-resident workload, DLHT surpasses 1.6B requests per second and provides 3.5x (12x) the throughput of the state-of-the-art closed-addressing (open-addressing) resizable hashtable on Gets (Deletes).
How to Interpret Trends in the Kalyan Rajdhani Mix Chart.pdfChart Kalyan
Â
A Mix Chart displays historical data of numbers in a graphical or tabular form. The Kalyan Rajdhani Mix Chart specifically shows the results of a sequence of numbers over different periods.
What is an RPA CoE? Session 1 â CoE VisionDianaGray10
Â
In the first session, we will review the organization's vision and how this has an impact on the COE Structure.
Topics covered:
âą The role of a steering committee
âą How do the organizationâs priorities determine CoE Structure?
Speaker:
Chris Bolin, Senior Intelligent Automation Architect Anika Systems
GraphRAG for LifeSciences Hands-On with the Clinical Knowledge Graph
Â
Mapping The City Maps And Plans
1. Mapping and Diagramming
the City:
Rethinking cities in the 21st century: in
the wake of chaotic growth and universal
expansion of cities and megacities
around the world.
We need to become experimental by
playing with different âmodelsâ and
methods of studying the city
Mapping and diagramming are two
methods of exploring the open-ended
complexity that is descriptive of the
contemporary urban terrain.
But what is a map and what is a
diagram? How is information
represented?
James Corner Field Operations
2. Diagrams: visualization can play a key role in the processes of understanding that take
place before form-making begins. *Diagramsâ Visible Language 26, 3 & 4 (Summer/Autumn, 1993): 451 â 73. Vijay K.
Sivasankaran and Charles L. Owen, âData Exploration: Transition Operation in Dynamic +
Tufte made Minardâs âFiguration Map famous in his 1983 book The Visual Display of
Quantitative Information. It shows the successive losses of men in the French army during
the Russian Campaign 1812 â 1813. It took him a long time to assemble the data: city data,
temperature data, the army data [survival, direction of movement, group] simplifying all
events; utilize thickness of lines to represent overall troop size therefore correlating troop
movements with temperature, and survival rates as well as direction of advance or retreat.
3. Flowchart: It was John von Neumann (1903 â 57) who
identified the key components of the computer as an
information processor. (central processing unit,
memory to store information, and an input/output
device for bringing information into and out of the
machine)
He also developed the âflow diagramâ that charts the
course of information transfers and operations
Flow charts are dynamic and narrative: they describe
an actively pursued process with a clear beginning and
-- a sequential progression towards a specified goal.
In a directed graph the relations between points, the
flows of energy or the circulation of things between
points is the issue: be they goods, people, vehicles,
soldiers, or flows of water, energy, messages and
information.
4. Mapping the Urban Network:
One of the oldest flow charts is the
Peutingeriana map laying out roads
between cities --- depicting a Roman
postal system. Rome was the axis of this
entire system of intersections. Only one
level needed since no other system
intersected this one
The Tabula Peutingeriana or Peutinger
Map is a thirteenth-century reproduction
of one of the wonders of Roman
geographical scholarship, a map showing
the world from Morocco, Spain and Thule
(?) in the West to India and Sri Lanka in the
East. The most remarkable part is the
depiction of the main roads of the empire
5. Harry Beckâs map depicts stations, straight line segments connecting them, and the River
Thames; lines ran only vertically, horizontally, or on 45 degree diagonals. To make the map
clearer and to emphasize connections, Beck differentiated between ordinary stations (marked
with tick marks) and interchanges (marked with diamonds). The Underground was initially
skeptical of his proposal â it was an uncommissioned spare-time project, and it was
tentatively introduced to the public in a small pamphlet in 1933
The basic design concepts have been widely adopted for other network maps around the
world, especially that of mapping topologically rather than geographically.
6. Rome of Sixtus V (1585 â 1590)
Medieval Rome was a place of
pilgrimage â not a large city but a city of
disorderly streets and meanderings
ways. Sixtus V ploughed straight new
streets through old neighborhoods and
open countryside to provide links
between the major sections of the city
where the major basilicas lay: to
facilitate the movement of pilgrims
between the major religious sites and to
accommodate the new mode of travel
by coach, and to allow goods and
services to flow more freely through and
about the city,
7. In the Renaissance mathematics begins to rule the figuration of the city â linear perspective
and the grid effect of cartography control the accuracy of the view in this ideal city c 1470
[National Gallery Urbino]
-A perspectival grid and outlines of buildings in minute detail with bilateral symmetry
--A utopian view: an urban order ruled by the principles of linear perspective based on
horizontal lines, vanishing and distance point and the resulting grid of orthogonals and
horizontals.
--the urban environment is given center stage: considered utopian because the idea of
implementation was an unreal expectation, it was merely visionary of what might happen
one day, when perfection could be attained.
8. Leonardo da Vinciâs 1502 Map of Imola:
based on the use of a horizontal surveying
disk which allowed for accurate measuring
of spatial dimensions of land and its objects.
One of the first scaled and accurately
measured maps from the Renaissance.
It is a mathematical abstraction of spatial
reality.
Called ichnographic city plan from Greek
âiknosâ meaning tracing or outlining and
âgrapheinâ to write.
Isotropic space; uniform and continuous in all directions â utilizing a plurality of
hypothetical viewpoints all drawn perpendicular to the surface of the map.
The city plan becomes the mode of cartographic documentation for the
subsequent representation of European cities.
10. These maps accompanied Boothâs Life
and Labour of the People of London
(1899) the first systematic a block by
block investigation.
There appears to be a relative amount
of mixing of classes across the city with
poverty concentrated near the river
Thames and great wealth towards the
West End of London.
London appeared to be unreadable,
everything mixed up.
Charles Boothâs London Map (1899)
color-coding of social classes in London --
yellow is upper middle and upper
classes, red is middle and well-to-do
class, pink is fairly comfortable , good
earners, and blue is poorâŠ. Black is
âcriminal classâ of slum dwellers
11. Maps determine the manner in which we perceive reality and hence influence actions.
Buckminster Fullerâs Dymaxion Airocean World Map of 1943: cuts the earth into triangular
facets that are then unfolded as a flat polyhedron. Both northern and southern poles are
presented frontally and with little distortion. The map can be unfolding and re-oriented in a
number of different ways, Different places and regions are seen in different sets of
relationships [James Corner]
12. Joaquin Torres Garcia Inverted
Map of South America 1943.
Places the south at the top of
the map inverting the
convention of map making
established during the Age of
Discovery, when the center of
the earth shifted from the
Mediterranean and the Holy
Lands to the Atlantic ocean.
This map upsets normal view of
the world map from a Euro-
centric viewpoint.
13. The map of Paris, entitled âThe Naked Cityâ published summer of 1957, the creation of
Guy Debord just before the Situationist International was formed. His concerns: how is
space constructed and how does space affect the perception of users of urban space?
The Map: 19 cut-out sections of a map of Paris, printed in black and white ink with
directional arrows painted in red. It subverts the image of a map, destroys the
omnipresent view from nowhere â instead it tries to spatialize movement, actions around
certain psychological hubs.
14. Illustration of psychogeographical turntables:
describes the function of the red arrows by
comparing them to a railroad turntable --- the arrows
representing the spontaneous turns of direction
taken by a person moving through âdifferent
atmospheres of Parisâ, or any other city, in disregard
to the normal connections that ordinarily govern
oneâs conduct. The railroad can only run on fixed
tacks, so too the subject under the reign of
capitalism, but turning tables or the turntable is also
a pun on playing tricks.
Each segment of the map is a âunity of atmosphereâ ,
a place of special attractions --- The title in red
letters is an appropriation of American film noir 1948
set in New York City and filmed in documentary style
[director Jules Dassin] it starred the landmark streets
and buildings so too the mapâs cut-out segments star
Luxembourg Gardens, Les Halles, Gare de Lyon, etc. ]
In 1955 the structure of Paris was an obstacle that
offered tiny clues to a future organization of life.
15. The city map or city plan became an ideogram of how geometry measures and controls our
perception of what is the âurbanâ, âthe worldâ, the âcityscapeâ. Maps project a power/knowledge.
Now there are revisions to this process of mapping the city as a creative practice: replacing the
map as a process that mathematically abstracts from reality with a process that engenders new
ways of viewing and mapping reality.
Deleuze and Guattariâs definition of Mapping in A
thousand Plateaus: 12 âThe map is open and connectable
in all of its dimensions; it is detachable, reversible,
susceptible to constant modification. It can be torn,
reversed, adapted to any kind of mounting, reworked by
an individual, group, or social formation. It can be drawn
on a wall. Conceived as a work of art, constructed as a
political action or as a meditation.â
They oppose mapping to tracing [i.e. the ichnographic
method]: the latter is closed in upon itself, propagating
redundancies while a mapping is open-ended ,
experimental, unfolding. It reformulates what already
exists: looking for hidden logics underneath apparent
forces [not just topography, rivers, roads, buildings but
wind and sun, local stories and historical events,
Tracing Summer Jonathan Kline
regulatory forces and programmatic structures.â
16. James Corner states in the âAgency of
Mappingâ there is a double-sided
characteristic of all maps to be both an
analogue and an abstraction.
He notes âFirst, their surfaces are directly
analogous to actual ground conditions; as
horizontal planes, they record the surface of
the earth as direct impressions. âŠ. One can
put oneâs finger on a map and trace out a
particular route or itinerary, the map
projecting a mental image into the spatial
imagination âŠ.
By contrast, the other side of this analogous
characteristic is the inevitable abstractness of
maps, the result of selection, omission,
Thus a map is the surface where isolation, distance and codification. Map
facts and conditions are collected, devices such as frame, scale, orientation, and
sorted, related to each other and projection, indexing and naming reveal
explored. artificial geographies that remains
unavailable to human eyes.â *Corner âAgencyâ: 215+
17. FIELD OPERATIONS
Photo: Darrel Ronald
James Corner: operational structures of mapping
The Field:= a continuous surface, the paper on the table, any analogue equivalent of the actual
ground flattened and scaled.
The Graphic System:= the symbols imposed on the field
The Extracts: things and events observed, selected and then drawn on the field
Plotting: drawing out new and latent relationships among the various extracts. âTo plot is to
track, to trace, to set-in-relation, to find and to found.â *James corner âAgencyâ: 230.+
18. Rem Koolhaas indirectly called for a
new mode of mapping in the
âGeneric Cityâ. âThe stronger the
identity [of a city], the more it
imprisons, the more it resists
expansion, interpretation, renewal,
contradiction.âŠâ Koolhaas SMLXL: 1248.
Layering: superimposition of
independent layers of information
constructs a field/ site â in which
notions of centering, bounding,
finished product are gone. Instead
open-endedness, indeterminacy,
complexity allow many different
interpretations.
Each layer has a system of
organization, an array of overlappings
or stacks of these layers creates a
series of interactions or amalgam of
relationships
Rem Koolhaas Yokohama mapping SMLX
19. Raoul Bumschoten and âChora Manifestoâ Daidalos 72 (1999): 42 â
51.
1st skin of earth wraps the earth, shaped
by geological forces
2nd skin of earth are cities: this skin is so
complex that we need a new tool box, a
new practice to construct and manage
cities.
What forces shape the second skin? Need
to understand these proto-urban
conditions that are likened to emotions in
human beings: subliminal conditions that
strongly affect physical states and
behavior.
âLove, life, weather and seasons ripple the
second skin. But new techniques of
knowing and moving create different
ripples, pulses⊠The effect is a fluid
urbanity hard to express through static
models or identities. Increasingly, the cityâs
only definable form, its only clear identity,
can be found in the manner in which its
changes evolve.â
20. The Networked City
âIt is not that networks were not around before or that the structure
of the brain has changed. It is that network has become a common
form that tends to define our ways of understanding the world and
acting in it.â [Hardt and Negri, Multitudes]
21. Rethinking Networks: âToday the Mediterranean is no longer -if ever it was- a large and liquid
quot;lieu de rencontrequot;. It is no longer the generic space of a network of relations that unites distant
peoples linked by a common geographical condition; the quot;cradlequot; of different yet connected
cultures; a mobile and 'soft' area of hybridization, encounter, blending of traditions, cultures and
costumes. The Mediterranean is today a hard, solid space, ploughed by precise routes that move
from equally defined points: from Valona to Brindisi, from Malta to Portopalo, from Algeria to
Marseilles, from Suez to Gibraltar.â *Multiplicities 2002+
22. Solid Sea and Multiplicity: From: quot;Stefano boeriquot; <s.boeri {AT} iol.it> 2002 SOLID SEA
Documenta 11 - Kassel - June 8th until September 15th 2002
With âSolid Seaâ, multiplicity intends to promote research into the new nature of the
Mediterranean, and to draw out an up to date atlas of its landscapes and the turbulence that
crosses it. The research on the âSolid Seaâ starts introducing at Kassel âSolid Sea case 01 ÂŻ the
Ghost Shipâ, the first case of the new research.
Multiplicity invites architects, artists, geographers, anthropologists, film makers to propose
stories and âphenomenaâ about the recent conditions of the Mediterranean and to take part to
the project.
Dear friends, We would like
you to join us for a public
seminar where artists,
geographers, photographers,
thinkers, architects, film
makers, photographers, social
scientists and curators will
discuss at a roundtable the new
conditions of the
Mediterranean Sea. Taking Case
01- The Ghost Ship (produced
on the occasion of Documenta
11) as a starting point, the new
geopolitical asset of the
Mediterranean Sea will be
debated.
Multiplicity: Stefano Boeri
Maddalena Bregani Francisca
Insulza Francesco Jodice
Giovanni La Varra John
Palmesino Palo Vari Maki
Gherzi Giovanni Maria Bellu
23. Identities
âToday, whoever enters into Mediterranean acquires, even if temporarily, a stable identity:
immigrant, fisherman, military, tourist on a cruise, oil derrick worker, seaside tourist ... the
ïżœcostumeïżœ will not be abandoned until the end of the journey across the water. Only
afterwards is it possible to, once again, take up those uncertain, shifting and multiple identities
that today characterise the citizens of the globalised world.
Not in the Mediterranean: you are either a tourist, or you are an immigrant; you either
transport containers, or use dragnets; routes can cross, overlap, yet rarely blend. And if and
when this does occur, it is only by accident: a short circuit that puts the different, yet coexisting,
depths of sea into contact one with each other. Unforeseen events that suddenly unite distinct
populations and isolated ïżœcorridorsïżœ: bombs dropped by NATO fighter planes and recovered
by oil derrick workers on the floor of the Adriatic Sea; Asiatic mussels attached to the hulls of
container ships; clandestine immigrantsïżœ corpses found in the nets of Sicilian fishermen...
Only then, does the Sea show itself in its three-dimensional power, in its immense and vague
volume. A Sea that is able to cover up tragic stories for years and yet make them reappear by
surrendering a small clue.
Today the Mediterranean is a Solid Sea where, with incredible growing density and often at
various depths, the planned trajectories of exacerbated identities graze one another. A part of
the world that appears to be counter-current.â
[http://www.ecn.org/lists/hackit99/200208/msg00133.html]
24. In the 19th century â⊠the network became âthe entanglement of objects
dispersed in linesâ and the term would be applied essentially to railways,
roads, and canals as well as the telegraph. Its meaning became fixed around
1849.â *Armand Mattelart+
25. The modern city is made up of intersecting
networks ---[water, gas, electricity, cable, mail,
telephone subways, bus lines, road systems, etc.]
some transmit information, some energy -- but
they all represent forms of information or
communication.
And there are networks between cities which
overlap upon other networks --- railroads.
highway systems, and inter- intra-city networks.
26. Manuel Castells has been studying the shift from industrial to postindustrial society--- and the
creation of the network society where production depends on the ability to generate, process
and apply knowledge based information systems.
This mode of production again effects spatial relationships, power relations, and everyday
experiences and sets up a new problematic: how to understand and describe the space of
flows along a set of interconnected nodes, which results in the network society.
Mapping the flows of goods,
people, diseases, and the like
between cities and countries
has long been an important
part of cartography. If you look
in any good atlas you will find a
range of different flow maps,
but what you won't see are
maps of the communication
flows of the Net. This is
because no one really knows,
comprehensively and reliably,
how much information and
communications flows
between cities and countries
and few people have tried to
map these flows.
27. Look at any map of Europe, the space is divided into states, each
clearly delineated by linear boundary lines and blocked out from
adjacent areas by separate colors. In such a representation the
state is a unified territorial concept, a spatial container of people
and political authority.
.
A network, on the other hand, configures
countries as a flat horizontal field of circulatory
movement: lines drawn across the land or through
the air, flows of messages, people, or ideas across
points in space.
So it is argued networks and processes have
replaced older cartographic conventions of
location analysis and fixity in place One group that
tries to map the space of flows is TeleGeography
producing this flow map of the Net based on the
volume of international telephone traffic between
nations.
28. Since the mid 19th century communications networks have spun ever larger cities and
geographies with ever larger investments of physical capital: infrastructure in roads, bridges,
skyscrapers, houses, cities and suburbs--- telegraph system, radio and television transmitters,
cable and satellite TV, mainframe computers
Titan City 1920s
Cities and suburbs helped to create the mass media model of communication: spreading fixed
costs over larger geographical areas to ever-larger audiences: TV series, recorded music, movies
29. The Internet radically changes the mass media model of communication --- there are
thousands and thousands of independent producers of information, coexisting without knowing
each other, yet their distributed unrelated efforts are coordinated --- through Google
algorithm or some other algorithm â into a huge question and answer apparatus.
Wikipedia , for example, is a multilingual encyclopedia coauthored by 50,000 volunteers.
30. How does all this effect geography â or space and time?
In the 1990s and the early 2000s, advances in computers and telecommunications, and the
spread of the Internet, compounded the idea that distance and location were no longer relevant
concepts.
The 'end of geography' (O'Brien 1992), or the 'death of distance' (Cairncross 2001; The
Economist, 30 September 1995), received front coverage from magazines and books. Cyber-
utopianism even predicted the end of the city (Negroponte 1995).
31. âMapping has emerged in the information age as a means to make the complex accessible, the
hidden visible, the unmappable mappable. As we struggle to steer through the torrent of data
unleashed by the Internet, and to situate ourselves in a world in which commerce and
community have been redefined in terms of networks, mapping has become a way of making
sense of things.â Janet Abrams and Peter Hall Else/Where: Mapping â New Cartographies of Networks and Territories (Minnesota: University of
Minnesota Design Institute, 2006):
Using the map as an interface to
geographic and other data sets â a
visual bridge between disparate facts.
Where are you? -- iphone, blackberry,
facebook â which space defines your
location?
How is time, memory, emotion
navigated via mapping?
32. Overview: âPDPal is an ongoing series of public art
projects for the Palmâą PDA, mobile phone and the
web. It has pushed at the notion of mapping,
attempting to transform your everyday activities and
urban experiences into a dynamic city that you write.
PDPal engages the user through a visual transformation
that is meant to highlight the way technologies that
locate and orient are often static and without
reference to the lively nature of urban cultural
environments.
Your own city is the city composed of the places you
live, play, work, and remember. It is made of the routes
and paths through which you make connections. Your
city is also about the meanings you ascribe to the
places you inhabit, pass through, love or hate. You
imagine those places and routes as more than a street
address, or directions you may give. These places have
vivid, metaphorical meanings and histories that PDPal
allows you to capture and visualize imaginatively,
effectively writing your imaginary city.â<www.o-
matic.com/play/pdpal>
34. Cinema and the City: the mobile
camera, the editing techniques, narrative
conventions, representation of space
offer cinematic, televisual, video
perceptions of the space of the city.
Cinema can be looked at as a mapping
process: mediation of place, of spatial
complexities, of conflicting information,
of hybrid locations.
Maps also appear in most films and a
film is a kind of mapping that plots and
captures the imagination of the viewer. A
film sets up âlocational imagingâ,
establishing a fictional territory to
explore â it is a cartographic diagram.
Editor's Notes
Peutingerâs Table:In the 16th century an antique dealer in Augsburg, Konrad Peutinger received a map of questionable date showing the routes linking all the Roman cities --- 6,000 proper names and 550 sketched vignettes.... It was at once a map, a road plan, and a travel guide. extending to the edges of the Empire [from Bordeaux all the way to CeylonIt is the key to the âRoman Systemâ = the city as an articulated system of movements in all directions, and its bldgs spread out like relay points: â... it is like a prefiguration of the atlases of cyberspaceâ [from Atalli, Mutations}
11/The Networked City Kasyz Varnelis (ed.) The Infrastructural City; Networked Ecologies in Los Angeles Barcelona: Acktar,2008 pp 104 â 129, 148-155.Stephan Graham and Simon Marvin, âIntroduction and Prologueâ Splintering Urbanism London: Routledge, 2001 http://www.geography.dur.ac.uk/information/staff/personal/graham/pdf_files/22.pdfStephan Graham and Simon Marvin, âThe Collapse of the Integrated Idea,â âPractice of Splintering Urbanismâ Splintering Urbanism London: Routledge, 2001 pp 90-135, 137-177.
Ghost Ship âThe night of December 26, 1996, a 'ghost' ship with 283 Singhaleseclandestine immigrants on board and on route from Malta towards the Italian coast, sank, a few miles off South-eastern Sicily, carrying with it its load of life. For five long years, the relatives' and survivors' invocations were answered by contemptuous denials and ironies from the Italian Authorities, who repeated with certainty that \"the shipwreck had never occurred\". Meanwhile, fishermen from Portopalo continuously found corpses in their nets. For 60 long months, the Sea slowly returned the traces of a tragedy consistently denied by the military and removed by the fishermen. Neither the fishermen, nor the local Authorities had the courage to denounce the truth, until the recovery of an ID belonging to a young man from Ceylon suddenly created an breach thanks to the meticulous work of Giovanni Maria Bellu, a reporter for the Italian newspaper 'la Repubblica'. Today, almost 2000 days after the shipwreck, the 'ghost ship', with its load, re-emerges, visible to everyone.  â
Digital is often associated with network(ed), post-industrial, cognitive, creative, virtual, information, new, knowledge, etc. âThe information ageâ used to describe the period that we now find ourselves living in is open to misinterpretation. Society has always been based on exchanging information and, it has always been based on flows, networks, as well as creative people. Hence Castellsâ ''space of flows', 'informational city' (1989), and 'network society' (1996) are somewhat 'loose' concepts.
Castells positions this space of flow in opposition to the space of places of the geographers, arguing that a placeless culture has evolved out of the increasing interconnectedness between local, regional and national communities.
For example: Newspapers exchanged information, their management required substantial capital investment. They established one-way communication, a model adopted by radio, television and later cable and satellite communication
Now distributed networks based on free open software, Wikipedia built and accessed via personal computers with a network connection--- link together nonmarket collaborations⊠open sharing for all others to build on, extend, make their own.
Geographers have played a strong role in this debate (Brunn and Leinbach 1991; Graham 1998; May and Thrift 2001). Pioneered by Janelle (1968), timeâspace analysis is closely linked to the study of globalization, What is new is the âdigital revolutionâ : the fact that networks, information, knowledge, and cognition are now increasingly processed and transacted in digital form, using digital devices and infrastructures.