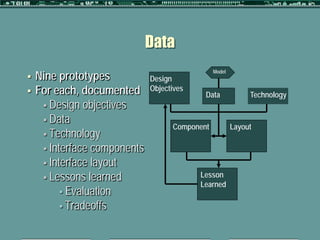
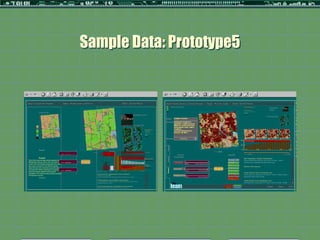
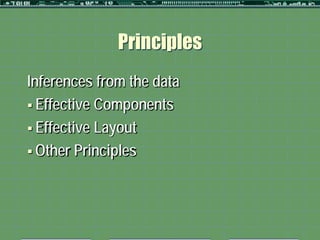
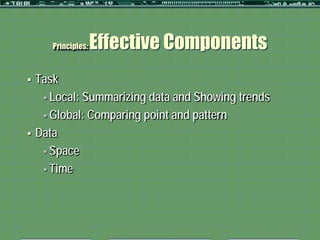
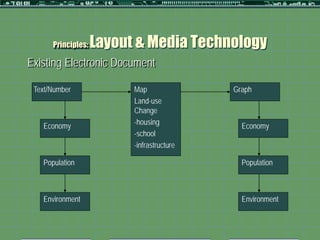
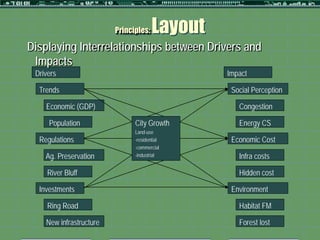
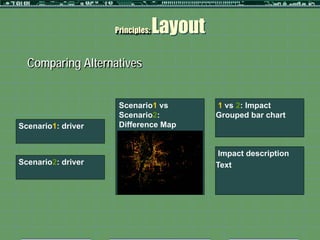
Download to read offline


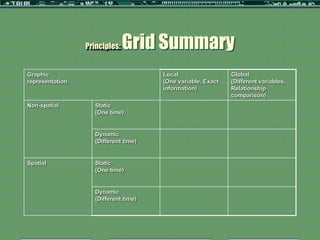
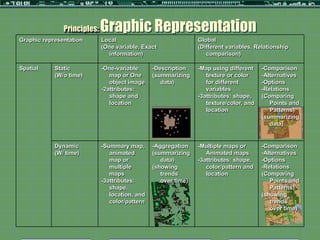
![Principles: Graphic Representation
Graphic representation Local Global
(One variable, Exact information) (Different variables, Relationship
comparison)
Non- Static -Separated bar -Description -Grouped bar or -Comparison
spatial (One time) or icon [or (summarizing icons -Alternatives
Table chart] data) -2attributes: shape -Options
-1attribute and texture/color -Relations
used: shape or (Add dimension = (Comparing
color see more Points and
relationship) Patterns)
(summarizing
data)
Dynamic -Line or Bars -Trends -Lines or bars -Comparison
(Different -2attributes: (showing -3attributes: shape, -Alternatives
time) shape and trends over texture/color, and -Options
spatial time) spatial pattern -Relations
pattern/location (Comparing
Points and
Patterns)
(showing
trends over
time)](https://image.slidesharecdn.com/input2012kbbudthimedhee-120517102616-phpapp02/85/Budthimedhee-Input2012-13-320.jpg)

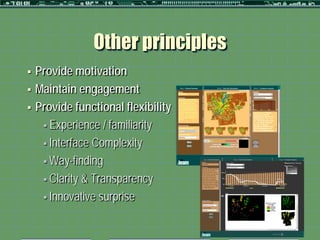


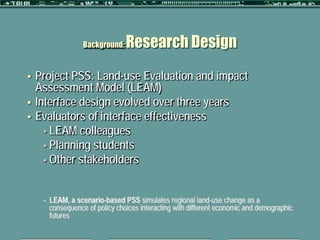
This document outlines a formative study on designing effective visualization interfaces for planning support systems. The study evaluated nine interface prototypes for a land use planning system called LEAM over three years. Key principles for effective interfaces were derived based on the evaluations. These principles include using appropriate graphic representations and layouts to direct user attention and maintain engagement. Effective graphic representations use proximity and a limited number of attributes to show relationships between different variables. Effective layouts group related drivers and impacts closely, align scales for comparison, and provide motivation and flexibility.


