SlideShare a Scribd company logo
1
Independent Project with Coursera – The Ohio State University
TechniCity
by Dr. Jennifer Evans-Cowley, Thomas W. Sanchez
Author: Pallavi Prakash Jha –
(pallavi.prakash.jha@gmail.com)
Built density vs roads with GIS and
Satellite Imagery
Contents
Introduction ....................................................................................... 2
FSI and Densities.............................................................................. 2
Project Area Location, Facts............................................................. 3
Demographic of Study area........................................................... 4
Existing Land Use Percentage with respect to the City ................. 5
Existing Land Use Percentage with respect to the B ward ............ 5
Project Aim........................................................................................ 6
Alternate Methodology with Remote sensing data analysis .............. 6
Examples of DSM outputs ............................................................. 7
Methodology for Study Area using Vector based shape files ............ 8
Analysing Google Map live traffic for study area............................ 8
Road Capacities based on Densities............................................. 9
Traffic Density calculation formula – Alternate approach ......... 10
Project Working............................................................................... 10
Conclusion ...................................................................................... 13
Bibliography .................................................................................... 15
2
Goal: Find rational ways for comparing Built up (BUP) of an
area with its existing roads for careful evaluation in revising FSI
in cities using GIS and Satellite imagery.
Introduction
FSI (floor space index) is a ratio of building’s total floor area to its
plot area. Currently FSI for suburbs in Mumbai is 1 and 1.33 for
island city. The permissible FSI will increase considering areas with
better infrastructure connectivity, accessibility, area’s future potential,
its proximity to transit stations and the existing levels of FSI
consumed. FSI for areas nearby railway station will be raised higher.
Reality players and Town planners are in favour of simultaneous up
gradation of infrastructure to effectively meet with requirement of
increased densities by raising FSI (Sanjay Jog, 2015). However, up
gradation of existing infrastructure is a long-term affair and also not
feasible in some areas of old cities where some buildings are new
and permanent and old buildings have many complexities for
redevelopment, though in dilapidated conditions. Street setback is
nonexistent and roads are very narrow. Hence such areas call for
more effective rational methods for reallocating FSI based on
multiple criteria evaluation.
FSI and Densities
Raising FSI will cater to housing shortages in Mumbai city where
land is a scarce resource. However in current situation most of our
existing roads are not equipped to handle higher density with
increase in FSI. Recommendation of raising FSI for areas nearby all
railway stations as per 20 year development plan proposed by the
Brihanmumbai Municipal Corporation (BMC) – from 2014 to 2034
may fail and lead to chaotic situations for near future due to limited
capacities of existing infrastructure & facilities including roads. (Binoo
Nair, 2015)
There are number of ways densities affect cities health. Floor Space
Index, FSI is a guiding factor in shaping and controlling densities in
areas. When FSI is not rationally allocated in areas, it leads to
disproportionate densities amounting to hazards on infrastructure.
This fails city infrastructure and brings congestions, traffic related
problems, jams, wastage of vehicle fuel, air and noise pollution,
unrealistic property rates escalation in certain areas, limited open
and green spaces and almost no scope for pedestrians or cyclists.
Mumbai city is in much need of better planning approach to meet
with a lot of problems related to high density.
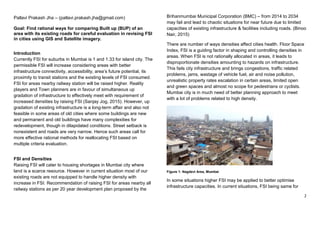
Figure 1: Nagdevi Area, Mumbai
In some situations higher FSI may be applied to better optimise
infrastructure capacities. In current situations, FSI being same for
3
most of metropolitan area is causing many problems. Some areas
that have many cessed buildings that need repairs are inviting higher
FSI. However these higher FSI cannot be dealt by existing road
capacities in these areas. Result is not only congestion but total
parking problem, environmental health concerns, deficient green &
open spaces in neighbourhoods and highly dense and unhygienic
condition. The same negatively affects small business and socio
economic conditions too.
With support of corrupt politicians, land mafias and builders perform
illegal and unethical construction which is very visible in these areas
having unreasonably tall buildings that is unjustified with current
Development Control Regulations. Such buildings must be identified
and its impact on infrastructure must be highlighted such that this
issue gets highlighted for immediate action. Such monopoly dictated
by area specific dominating builders snatch away opportunities for
small entrepreneurs and developers who want to work law abiding
and ethical.
Citizens are most affected. With higher densities, infrastructure and
amenities do not meet the basic requirement of healthy living. Cities
get congested causing adverse effect on every aspect of urban
living. Housing becomes unaffordable and slums show up more
obviously.
Figure 2: Nagdevi Street Mumbai
Project Area Location, Facts
This project is explored in a section of ward B of Municipal
Corporation Greater Mumbai, Metropolitan city Mumbai, India (Figure
4). Total Population in B ward is 1, 40,481 (as per 2001 census)
Daytime floating population is about 3, 00,000. The study area is a
high density mix use development along 6 meter wide Nagdevi
Street between Yusuf Mehrali road and Nagdevi corss lane. Area
has many dilapidated cessed buildings with no parking facility/
amenities. Local businesses in these areas are of varied types and
the blocks are mainly commercial as per DCR (Figure 7). Nagdevi
Street is few blocks away from Yusuf Meharali Road and is close to
Mohammed Ali Road (Figure 5: Location Map, Development Plan (
MCGM, 2012). Location is 2.5 km from Marine Lines Railway Station
and is 0.6 Km (8 minutes walking distance) from Crawford Market.
4
The project site is well connected with different prominent high
activity zones in the vicinity and is strategically located for business
and many activities that bring lots of floating population too.
Demographic of Study area
B ward Population=140481
B ward Total area = 264 Ha
Population Density / Ha = 531
Population Density / SQM
=531/10000 SQM
= 0.0531/SQM
Floating Population = 300000
Total Population= 140481+300000= 440481
Total Population Density /Ha = 440481/264=1669
Total Population Density / SQM = 1669/10000=.1669
(Groupe SCE India, 2012)
Figure 3: India on World Map; Source: http://damayantikattha.com/export.html
Figure 4: Ward B map
5
Figure 5: Location Map, Development Plan ( MCGM, 2012)
Figure 6: Google Earth map for location
Figure 7: Development Plan Zoning ( MCGM, 2012)
Existing Land Use Percentage with respect to the City
Area of Entire Mumbai City being 41395.2 ha, B ward comprise of
0.4% residential, 3.4% commercial, 0.3% Offices, 0.4% Educational
Amenities, 0.7% Medical Amenities, 2% Social Amenities, 0.2%
Public Utilities and Facilities, 3.2% Transportation and
Communication Facilities, 0.2% Vacant Land, and Negligible Open
Spaces (Groupe SCE India, 2012).
Existing Land Use Percentage with respect to the B ward
The B ward having an area of 264.56 ha, has 16.81% of residential
and 11.42% Commercial, 0.77% of Natural areas and open spaces.
Transportation and communication facilities like sea port, dockyard
and jetties, railway yards, stations etc. contribute to 63.26% of total
area in ward B. Within Natural areas and open spaces there are
6
0.4% playgrounds, 0.06% recreation ground, 0.19% parks & garden,
0.11% clubs gymkhanas.
The 16.81% of area under residential use comprises of 0.01%
individual housing, 13.81% apartments / multifamily, 1.78%
government/ municipal staff/ quarters / housing, 0.08% Chawls,
1.12% slums clusters (Groupe SCE India, 2012).
Project Aim
Considering the existing scenario of buildings in Nagdevi area where
existing consumed FSI is about 4 for most plots and in some cases
it’s higher. In redevelopment buildings, FSI allocation is different and
it is 50% + existing BUP. This means that redevelopment buildings
will invite higher consumption of FSI, hence higher BUP. Aim of this
project is to understand road proportion with respect to total
consumed Built up (BUP) of an area due to applying high FSI using
GIS. This will help planners understand existing scenarios better for
taking correct decisions when it comes to revising FSI for Mumbai
city.
The relation is, higher FSI leads to more BUP that requires higher
percentage of roads to meet with the density requirement. Hence for
areas that are already saturated with FSI like in case of Nagdevi, it
needs reconsideration before allowing more buildings to emerge with
high volumes. Especially in case of redevelopment of cessed
buildings that is inviting more FSI in these areas need to be checked
and thought more carefully and some alternate incentive scheme
shall be designed for redevelopment projects of dilapidated
buildings.
Alternate Methodology with Remote sensing data analysis
Satellite images with height data will be helpful in Building density
estimation with respect to its road proportions for keeping a check,
while upgrading FSI index for the city. Building densities can be quite
decently estimated using imagery. It is possible to differentiate
various densities of residential development, and to separate these
from commercial/industrial and agricultural areas using high-
resolution remote sensing image and airborne laser altimetry data
(B. I. Alhaddad a, 2008). Methodology for estimating existing BUP
with respect to road proportion using satellite data will be same as it
is done for study area in this project using GIS shape files
subsequently.
Some satellite images relevant to site are possible to procure and
use but they involve intense raster rectification and calculation (eg.
cartosat-1). During the study, I explored a lot of open sources for
DEM. The Shuttle Radar Topography Mission(SRTM), ASTER,
GDEM Advanced Spaceborne Thermal Emission and Reflection,
CARTOSAT – 1 (Figure 8: (Saha, 2014)
kakolisaha@spabhopal.ac.inare few examples of these open source
data. These open source DEM and multispectral satellite data are
very useful for planners and researchers for conducting study
exercises for developing good practical methodologies but they have
their limitations too with missing data or voids. DSM generation from
satellite images are more challenging and open source data is not
readily available for the same. This is the main reason for exploring
an alternate method using GIS shape files for this study which will be
discussed subsequently.
7
Examples of DSM outputs
1. cartosat-1
DSM from cartosat-1 stereo data can be used and traditional ATE
and Orthoengine may be used over adaptive ATE for accurately
identifying urban features. (Saha, 2014)
Figure 8: (Saha, 2014) kakolisaha@spabhopal.ac.in
2. World View Stereo Pair (Commercial Product)
DTM was subtracted from DSM and incorporated with building vector
model in building height column. Final 3D City Model was generated.
Figure 9 shows the 3D City model over Ortho Photo. With this
method, 32 M spatial and building height accuracy can be achieved.
Results indicate that use of the World View Stereo models for
applications that range from building height estimation for RF
planning & optimisation in different urban morphology is a feasible
task (Nishadh S, 2013).
Figure 9
8
Methodology for Study Area using Vector based shape files
In this exercise, Available Drawing in pdf format was downloaded
from mcgm.gov.in. The drawing was used to create AutoCAD format
drawing for editing and creating base files ( MCGM, 2012). These
were corrected on scale and projection with reference to Google
earthpoint. Finally the corrected shapes were reprojected on
EPSG:32643 - WGS 84 / UTM zone 43N in QGIS for further analysis
and calculations. This method has been used due to no availability of
Digital surface model for the area of study. There might be some
irregularities in drawings due to conversion factors and editing. Area
wise densities are estimated based on assumption of 4 FSI for the
study area. However, building densities are much higher in some
cases as observed on site (Figure 1: Nagdevi Area, Mumbai.
Redevelopment of cessed buildings allows higher FSI which is 50%
added to existing BUP consumed (Mumbai, DCR). This implies that
in existing situation, BUP for the study area is much more than
assumed 4 FSI for calculation and corresponding streets to these
estimated densities are also very less.
The methodology will help visualise existing Building density of an
area in relation to capacity of its roads. As per DCR, roads and
amenities percentage for development is 15% of total plot area.
These study highlights, how total built-up is essential be considered
for assigning roads and street percentage and if area is already built,
high FSI consumption shall be avoided. The comparison is made
between total built up verses area of road allocated for the area.
Analysing Google Map live traffic for study area
It is clear from the above demographic data that the area has very
high density population and due to its high floating population, the
traffic activity is much amplified. As per the Google maps live traffic
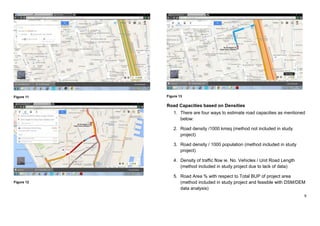
data as shown in Figure 10: it is observed that Mohammad Ali road
is the most critical link with heavy traffic volumes almost all through
the day. Traffic data for inner roads like Nagdevi street, Bibijan
street, Narayan Dhruva Street, Nagdevi Cross lane, etc is not
available. Most of these inner roads in the area is as narrow as 6-8
meters and have limited vehicular access. Nagdevi Street is non
vehicular as the street is most conjusted with its narrow width and
high commercial activities. Commute time during peak traffic hour is
very high. With Google data as in (Figure 12, Figure 13) we can see
that it takes about 10 minutes to cover a distance of 1.7 KM.
Figure 10:
9
Figure 11
Figure 12
Figure 13
Road Capacities based on Densities
There are four ways to estimate road capacities as mentioned below:
1. Road density /1000 kmsq (method not included in study
project)
2. Road density / 1000 population (method included in study
project)
3. Density of traffic flow ie. No. Vehicles / Unit Road Length
(method not included in study project due to lack of data)
4. Road Area % with respect to Total BUP of project area
(method included in study project and feasible with DSM/DEM
data analysis)
10
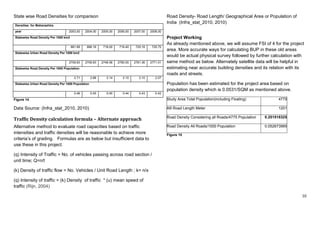
State wise Road Densities for comparison
Densities for Maharashtra
year 2003.00 2004.00 2005.00 2006.00 2007.00 2008.00
Statewise Road Density Per 1000 km2
881.89 886.16 718.00 716.40 725.16 725.75
Statewise Urban Road Density Per 1000 km2
2709.83 2709.83 2748.58 2760.00 2761.36 2771.01
Statewise Road Density Per 1000 Population
2.71 2.68 2.14 2.10 2.10 2.07
Statewise Urban Road Density Per 1000 Population
0.46 0.45 0.45 0.44 0.43 0.42
Figure 14
Data Source: (Infra_stat_2010, 2010)
Traffic Density calculation formula – Alternate approach
Alternative method to evaluate road capacities based on traffic
intensities and traffic densities will be reasonable to achieve more
criteria’s of grading. Formulas are as below but insufficient data to
use these in this project.
(q) Intensity of Traffic = No. of vehicles passing across road section /
unit time; Q=n/t
(k) Density of traffic flow = No. Vehicles / Unit Road Length; k= n/x
(q) Intensity of traffic = (k) Density of traffic * (u) mean speed of traffic
(Rijn, 2004)
Road Density - Road Length/ Geographical Area or Population of
India (Infra_stat_2010, 2010)
Project Working
As already mentioned above, we will assume FSI of 4 for the project
area. More accurate ways for calculating BUP in these old areas
would be actual physical survey followed by further calculation with
same method as below. Alternately satellite data will be helpful in
estimating near accurate building densities and its relation with its
roads and streets.
Population has been estimated for the project area based on
population density which is 0.0531/SQM as mentioned above.
Study Area Total Population(including Floating) 4775
Alll Road Length Meter 1201
Road Density Considering all Roads/4775 Population 0.251518325
Road Density All Roads/1000 Population 0.052673995
Figure 15
11
Figure 16: QGIS: EPSG:32643 - WGS 84 / UTM zone 43N
Figure 17: QGIS: EPSG:32643 - WGS 84 / UTM zone 43N
12
Figure 18
Figure 19
Study Area BUP SQM 114444
Alll Road Area SQM 10398
Road Density Considering all Roads/BUP Area 0.090857
Total Road % wrt 114444sqm BUP 9.085666
Figure 20
13
Figure 21
Figure 22
Conclusion
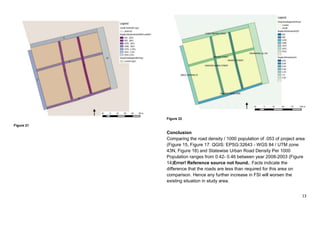
Comparing the road density / 1000 population of .053 of project area
(Figure 15, Figure 17: QGIS: EPSG:32643 - WGS 84 / UTM zone
43N, Figure 18) and Statewise Urban Road Density Per 1000
Population ranges from 0.42- 0.46 between year 2008-2003 (Figure
14). Facts indicate the difference that the roads are less than
required for this area on comparison. Hence any further increase in
FSI will worsen the existing situation in study area.
14
As per DCR, amenity percentage for new development of plot size
ranging from 2501-10000sqm and above is 15% of total plot area
(same is applicable with FSI constrain). The same is not seen in old
areas with many cessed buildings like in case of Nagdevi. The
project output using vector based GIS analysis illustrates that the
total built-up of an area is also essential to be considered for
assigning roads and street percentage in a development and if the
area is already densely built, than any further high FSI consumption
shall be avoided. The comparison is made between total built up
verses area of road allocated for the study region. The area is
facilitated with 9.08% of road area with respect to BUP consumed
(Figure 21, Figure 22). It is important to note that out of all these
roads, three roads have limited or no vehicular access that puts
further more pressure on vehicular roads.
These methodologies using GIS and Satellite imagery can serve as
a great tool to planners and decision makers for careful evaluation
while revising FSI for cities in realistic existing density scenario.
Satellite images with elevation data will also help detect illegally built
buildings that have consumed disproportionate FSI. Planning
authorities can take advantage of these technologies. Open sources
like in case of DEM from SRTM, ASTER, Cartosat-1 are useful for
individual researchers and planners, however some open source for
DSM would be more encouraging.
Figure 23
15
Bibliography
MCGM. (2012). Primary Existing Landuse Survey.
Accommodation Times. (2014, 7 17). FSI Under Different Schemes.
Retrieved 9 8, 2014, from accommodationtimes.com:
http://accommodationtimes.com/index.php/f-s-i-under-different-
schemes/
B. I. Alhaddad a, *. J. (2008). SATELLITE IMAGERY AND LIDAR
DATA FOR EFFICIENTLY DESCRIBING STRUCTURES AND
DENSITIES IN RESIDENTIAL URBAN LAND USES
CLASSIFICATION. Beijing: The International Archives of the
Photogrammetry, Remote Sensing and Spatial Information Sciences.
Vol. XXXVII. Part B8.
Binoo Nair. (2015, 02 18). BMC's high FSI development plan raises
railway hopes. DNA Floor Space Index News .
Brindle, B. (2014, 10 31). How does Google Maps predict traffic?
Retrieved 04 12, 2015, from howstuffworks.com:
http://electronics.howstuffworks.com/how-does-google-maps-predict-
traffic.htm
Government of Maharashtra, Urban Development Department.
(2012). Notofication: Sanction to modification to the DCR for Greater
Mumbai 1991 Under Section 37(lAA)(C )of MRTP Act 1966. Sanction
to modification to the DCR for Greater Mumbai 1991 Under Section
37(lAA)(C)of MRTP Act.
Groupe SCE India. (2012). Existing Landuse maps and Report.
Infra_stat_2010. (2010). Retrieved from mospi.nic.in:
http://mospi.nic.in/mospi_new/upload/Infra_stat_2010/1.ch_road.pdf
Nishadh S, Empower Consultancy Pvt. Ltd. (2013, 03 11).
Geospatial World Weekly. 3D city models for wireless network
application .
Rijn, J. v. (2004). ROAD CAPACITIES. INDEVELOPMENT .
Saha, K. (2014). DSM extraction and evaluation from Cartosat DSM
extraction and evaluation from Cartosat DSM extraction and
evaluation from Cartosat DSM extraction and evaluation from
Cartosat DSM extraction and evaluation from Cartosat DSM
extraction and evaluation . International Journal of Scientific and
Research Publications .
Sanjay Jog. (2015, 02 17). Realty sector welcomes BMC's proposal
to hike FSI in Greater Mumbai. Business Standars News .

More Related Content

What's hot

Detailed understanding of the master plan ar. m. senthil
Detailed understanding of the master plan  ar. m. senthilDetailed understanding of the master plan  ar. m. senthil
Detailed understanding of the master plan ar. m. senthil
Ar. M. Senthil [ senthilmani ]
 
Springfield Revitalization
Springfield RevitalizationSpringfield Revitalization
Springfield Revitalizationcathybrealtor
 
Development Plan- Planning interventions by (MANIT) Maulana Azad National Ins...
Development Plan- Planning interventions by (MANIT) Maulana Azad National Ins...Development Plan- Planning interventions by (MANIT) Maulana Azad National Ins...
Development Plan- Planning interventions by (MANIT) Maulana Azad National Ins...
NOSPlan - National Organisation of Students of Planning
 
Social considerations eng
Social considerations engSocial considerations eng
Social considerations engBayar Tsend
 
Lerning session saka_rev[1]
Lerning session saka_rev[1]Lerning session saka_rev[1]
Lerning session saka_rev[1]Bayar Tsend
 
Walkability in-nairobi
Walkability in-nairobiWalkability in-nairobi
Walkability in-nairobi
Cornelius Simon Okumu
 
Overview of Sahyog Projects
Overview of Sahyog ProjectsOverview of Sahyog Projects
Overview of Sahyog Projectsrk_misra
 
Potential for rapid development: Yelahanka
Potential for rapid development: YelahankaPotential for rapid development: Yelahanka
Potential for rapid development: Yelahanka
Vestian
 
Commercial development pushing growth: Bellary Road
Commercial development pushing growth: Bellary RoadCommercial development pushing growth: Bellary Road
Commercial development pushing growth: Bellary Road
Vestian
 

What's hot (11)

Detailed understanding of the master plan ar. m. senthil
Detailed understanding of the master plan  ar. m. senthilDetailed understanding of the master plan  ar. m. senthil
Detailed understanding of the master plan ar. m. senthil
 
Springfield Revitalization
Springfield RevitalizationSpringfield Revitalization
Springfield Revitalization
 
Development Plan- Planning interventions by (MANIT) Maulana Azad National Ins...
Development Plan- Planning interventions by (MANIT) Maulana Azad National Ins...Development Plan- Planning interventions by (MANIT) Maulana Azad National Ins...
Development Plan- Planning interventions by (MANIT) Maulana Azad National Ins...
 
Separate Pages
Separate PagesSeparate Pages
Separate Pages
 
Social considerations eng
Social considerations engSocial considerations eng
Social considerations eng
 
Environment eng
Environment engEnvironment eng
Environment eng
 
Lerning session saka_rev[1]
Lerning session saka_rev[1]Lerning session saka_rev[1]
Lerning session saka_rev[1]
 
Walkability in-nairobi
Walkability in-nairobiWalkability in-nairobi
Walkability in-nairobi
 
Overview of Sahyog Projects
Overview of Sahyog ProjectsOverview of Sahyog Projects
Overview of Sahyog Projects
 
Potential for rapid development: Yelahanka
Potential for rapid development: YelahankaPotential for rapid development: Yelahanka
Potential for rapid development: Yelahanka
 
Commercial development pushing growth: Bellary Road
Commercial development pushing growth: Bellary RoadCommercial development pushing growth: Bellary Road
Commercial development pushing growth: Bellary Road
 

Viewers also liked

Route Analysis and Cut Fill Analysis using QGIS (open source GIS)
Route Analysis and Cut Fill Analysis using QGIS (open source GIS)Route Analysis and Cut Fill Analysis using QGIS (open source GIS)
Route Analysis and Cut Fill Analysis using QGIS (open source GIS)
Pallavi Prakash Jha
 
ZunqiuPresentationOct05
ZunqiuPresentationOct05ZunqiuPresentationOct05
ZunqiuPresentationOct05Chen Zunqiu
 
Designing Density: Embracing the "Urban" in the New Urbanism-Black CNU17
Designing Density: Embracing the "Urban" in the New Urbanism-Black CNU17Designing Density: Embracing the "Urban" in the New Urbanism-Black CNU17
Designing Density: Embracing the "Urban" in the New Urbanism-Black CNU17
Congress for the New Urbanism
 
Urban Density Final
Urban Density FinalUrban Density Final
Urban Density FinalTexxi Global
 
Planning Techniques
Planning TechniquesPlanning Techniques
Planning TechniquesAvik Mandal
 
Summer Intern Project
Summer Intern ProjectSummer Intern Project
Summer Intern ProjectRahul Thukral
 
Urban study
Urban studyUrban study
Population Distribution & Density
Population Distribution & DensityPopulation Distribution & Density
Population Distribution & Densityclemaitre
 
Case study Eircom - FiberPlanIT
Case study Eircom - FiberPlanITCase study Eircom - FiberPlanIT
Case study Eircom - FiberPlanIT
Comsof
 
Application of gis in indian railways
Application of gis in indian railwaysApplication of gis in indian railways
Application of gis in indian railways
sumitvikram
 
DFMEA DR & DVP 261113 KCV
DFMEA DR & DVP 261113 KCVDFMEA DR & DVP 261113 KCV
DFMEA DR & DVP 261113 KCVKamal Vora
 
Slum rehabilitation authority
Slum rehabilitation authoritySlum rehabilitation authority
Slum rehabilitation authority
Harsh Jain
 
Gis Applications Presentation
Gis Applications PresentationGis Applications Presentation
Gis Applications PresentationIdua Olunwa
 
A Slum Redevelopment Project
A Slum Redevelopment ProjectA Slum Redevelopment Project
Urban design analysis, Circulation, Architecture, London, Redevelopment studies
Urban design analysis, Circulation, Architecture, London, Redevelopment  studiesUrban design analysis, Circulation, Architecture, London, Redevelopment  studies
Urban design analysis, Circulation, Architecture, London, Redevelopment studies
Sujeet Thakare
 
Development Control Regulations, Mumbai - Key points
Development Control Regulations, Mumbai - Key pointsDevelopment Control Regulations, Mumbai - Key points
Development Control Regulations, Mumbai - Key points
Presi
 
How to Become a Thought Leader in Your Niche
How to Become a Thought Leader in Your NicheHow to Become a Thought Leader in Your Niche
How to Become a Thought Leader in Your Niche
Leslie Samuel
 

Viewers also liked (20)

Route Analysis and Cut Fill Analysis using QGIS (open source GIS)
Route Analysis and Cut Fill Analysis using QGIS (open source GIS)Route Analysis and Cut Fill Analysis using QGIS (open source GIS)
Route Analysis and Cut Fill Analysis using QGIS (open source GIS)
 
proposal2
proposal2proposal2
proposal2
 
ZunqiuPresentationOct05
ZunqiuPresentationOct05ZunqiuPresentationOct05
ZunqiuPresentationOct05
 
Designing Density: Embracing the "Urban" in the New Urbanism-Black CNU17
Designing Density: Embracing the "Urban" in the New Urbanism-Black CNU17Designing Density: Embracing the "Urban" in the New Urbanism-Black CNU17
Designing Density: Embracing the "Urban" in the New Urbanism-Black CNU17
 
proposal[1]
proposal[1]proposal[1]
proposal[1]
 
Urban Density Final
Urban Density FinalUrban Density Final
Urban Density Final
 
Density
DensityDensity
Density
 
Planning Techniques
Planning TechniquesPlanning Techniques
Planning Techniques
 
Summer Intern Project
Summer Intern ProjectSummer Intern Project
Summer Intern Project
 
Urban study
Urban studyUrban study
Urban study
 
Population Distribution & Density
Population Distribution & DensityPopulation Distribution & Density
Population Distribution & Density
 
Case study Eircom - FiberPlanIT
Case study Eircom - FiberPlanITCase study Eircom - FiberPlanIT
Case study Eircom - FiberPlanIT
 
Application of gis in indian railways
Application of gis in indian railwaysApplication of gis in indian railways
Application of gis in indian railways
 
DFMEA DR & DVP 261113 KCV
DFMEA DR & DVP 261113 KCVDFMEA DR & DVP 261113 KCV
DFMEA DR & DVP 261113 KCV
 
Slum rehabilitation authority
Slum rehabilitation authoritySlum rehabilitation authority
Slum rehabilitation authority
 
Gis Applications Presentation
Gis Applications PresentationGis Applications Presentation
Gis Applications Presentation
 
A Slum Redevelopment Project
A Slum Redevelopment ProjectA Slum Redevelopment Project
A Slum Redevelopment Project
 
Urban design analysis, Circulation, Architecture, London, Redevelopment studies
Urban design analysis, Circulation, Architecture, London, Redevelopment  studiesUrban design analysis, Circulation, Architecture, London, Redevelopment  studies
Urban design analysis, Circulation, Architecture, London, Redevelopment studies
 
Development Control Regulations, Mumbai - Key points
Development Control Regulations, Mumbai - Key pointsDevelopment Control Regulations, Mumbai - Key points
Development Control Regulations, Mumbai - Key points
 
How to Become a Thought Leader in Your Niche
How to Become a Thought Leader in Your NicheHow to Become a Thought Leader in Your Niche
How to Become a Thought Leader in Your Niche
 

Similar to Urban Density Analysis wrt Roads using GIS & Imagery

IRJET- Transit Oriented Development
IRJET-  	  Transit Oriented DevelopmentIRJET-  	  Transit Oriented Development
IRJET- Transit Oriented Development
IRJET Journal
 
THESIS to university
THESIS to universityTHESIS to university
THESIS to universitySanyal Sunil
 
ASSESSING THE IMPACT OF PUNE METRO ON REAL ESTATE MARKET
ASSESSING THE IMPACT OF PUNE METRO ON REAL ESTATE MARKETASSESSING THE IMPACT OF PUNE METRO ON REAL ESTATE MARKET
ASSESSING THE IMPACT OF PUNE METRO ON REAL ESTATE MARKET
IRJET Journal
 
IRJET-About Urban Sprawl: A Case Study of Ahmedabad City
IRJET-About Urban Sprawl: A Case Study of Ahmedabad CityIRJET-About Urban Sprawl: A Case Study of Ahmedabad City
IRJET-About Urban Sprawl: A Case Study of Ahmedabad City
IRJET Journal
 
A space syntax approach to investigate the impact of the future roads on the ...
A space syntax approach to investigate the impact of the future roads on the ...A space syntax approach to investigate the impact of the future roads on the ...
A space syntax approach to investigate the impact of the future roads on the ...
Manat Srivanit
 
impact of MRTS on Landuse in Patna
impact of MRTS on Landuse in Patnaimpact of MRTS on Landuse in Patna
impact of MRTS on Landuse in Patna
Archit Nishant
 
Sudhira, 2008, Colloquium
Sudhira, 2008, ColloquiumSudhira, 2008, Colloquium
Sudhira, 2008, Colloquium
Sudhira H. S.
 
IRJET- Study on Transit Oriented Development
IRJET- Study on Transit Oriented DevelopmentIRJET- Study on Transit Oriented Development
IRJET- Study on Transit Oriented Development
IRJET Journal
 
GIS aided Urban Planning for preparation of Micro-Level Plan of Channenahalli...
GIS aided Urban Planning for preparation of Micro-Level Plan of Channenahalli...GIS aided Urban Planning for preparation of Micro-Level Plan of Channenahalli...
GIS aided Urban Planning for preparation of Micro-Level Plan of Channenahalli...
vivatechijri
 
IRJET- Principles of New Urbanism and Architecture in Indian Context
IRJET- Principles of New Urbanism and Architecture in Indian ContextIRJET- Principles of New Urbanism and Architecture in Indian Context
IRJET- Principles of New Urbanism and Architecture in Indian Context
IRJET Journal
 
17-Article Text-68-8-10-20170815.pdf
17-Article Text-68-8-10-20170815.pdf17-Article Text-68-8-10-20170815.pdf
17-Article Text-68-8-10-20170815.pdf
Paras Mongia
 
IRJET- A Review Study on Urban Sprawl
IRJET-  	  A Review Study on Urban SprawlIRJET-  	  A Review Study on Urban Sprawl
IRJET- A Review Study on Urban Sprawl
IRJET Journal
 
Best Practices in community engagement in slum rehabilitation in India - Raji...
Best Practices in community engagement in slum rehabilitation in India - Raji...Best Practices in community engagement in slum rehabilitation in India - Raji...
Best Practices in community engagement in slum rehabilitation in India - Raji...
Regional Urban Upgrading Working Group (RUUWG)
 
Ajmer singh CV- Urban Planner & GIS expert
Ajmer singh CV- Urban Planner & GIS expertAjmer singh CV- Urban Planner & GIS expert
Ajmer singh CV- Urban Planner & GIS expert
Ajmer Singh
 
ssessment of the Spaces between the Developed and Undeveloped Areas in Rongo ...
ssessment of the Spaces between the Developed and Undeveloped Areas in Rongo ...ssessment of the Spaces between the Developed and Undeveloped Areas in Rongo ...
ssessment of the Spaces between the Developed and Undeveloped Areas in Rongo ...
inventionjournals
 
IRJET- Reasons of Causing Urban Sprawl and it’s Effect on Daily Life
IRJET- Reasons of Causing Urban Sprawl and it’s Effect on Daily LifeIRJET- Reasons of Causing Urban Sprawl and it’s Effect on Daily Life
IRJET- Reasons of Causing Urban Sprawl and it’s Effect on Daily Life
IRJET Journal
 
TRANSIT ORIENTED DEVELOPMENT (TOD)
TRANSIT ORIENTED DEVELOPMENT (TOD)TRANSIT ORIENTED DEVELOPMENT (TOD)
TRANSIT ORIENTED DEVELOPMENT (TOD)
Pooja Jariwala
 
A Review of Smart Cities Evolution in India
A Review of Smart Cities Evolution in India A Review of Smart Cities Evolution in India
A Review of Smart Cities Evolution in India
vivatechijri
 
Evaluate deficiencies and shortages for the Libyan Residential Urban Planning...
Evaluate deficiencies and shortages for the Libyan Residential Urban Planning...Evaluate deficiencies and shortages for the Libyan Residential Urban Planning...
Evaluate deficiencies and shortages for the Libyan Residential Urban Planning...
journal ijrtem
 

Similar to Urban Density Analysis wrt Roads using GIS & Imagery (20)

IRJET- Transit Oriented Development
IRJET-  	  Transit Oriented DevelopmentIRJET-  	  Transit Oriented Development
IRJET- Transit Oriented Development
 
THESIS to university
THESIS to universityTHESIS to university
THESIS to university
 
ASSESSING THE IMPACT OF PUNE METRO ON REAL ESTATE MARKET
ASSESSING THE IMPACT OF PUNE METRO ON REAL ESTATE MARKETASSESSING THE IMPACT OF PUNE METRO ON REAL ESTATE MARKET
ASSESSING THE IMPACT OF PUNE METRO ON REAL ESTATE MARKET
 
Topic 19
Topic 19Topic 19
Topic 19
 
IRJET-About Urban Sprawl: A Case Study of Ahmedabad City
IRJET-About Urban Sprawl: A Case Study of Ahmedabad CityIRJET-About Urban Sprawl: A Case Study of Ahmedabad City
IRJET-About Urban Sprawl: A Case Study of Ahmedabad City
 
A space syntax approach to investigate the impact of the future roads on the ...
A space syntax approach to investigate the impact of the future roads on the ...A space syntax approach to investigate the impact of the future roads on the ...
A space syntax approach to investigate the impact of the future roads on the ...
 
impact of MRTS on Landuse in Patna
impact of MRTS on Landuse in Patnaimpact of MRTS on Landuse in Patna
impact of MRTS on Landuse in Patna
 
Sudhira, 2008, Colloquium
Sudhira, 2008, ColloquiumSudhira, 2008, Colloquium
Sudhira, 2008, Colloquium
 
IRJET- Study on Transit Oriented Development
IRJET- Study on Transit Oriented DevelopmentIRJET- Study on Transit Oriented Development
IRJET- Study on Transit Oriented Development
 
GIS aided Urban Planning for preparation of Micro-Level Plan of Channenahalli...
GIS aided Urban Planning for preparation of Micro-Level Plan of Channenahalli...GIS aided Urban Planning for preparation of Micro-Level Plan of Channenahalli...
GIS aided Urban Planning for preparation of Micro-Level Plan of Channenahalli...
 
IRJET- Principles of New Urbanism and Architecture in Indian Context
IRJET- Principles of New Urbanism and Architecture in Indian ContextIRJET- Principles of New Urbanism and Architecture in Indian Context
IRJET- Principles of New Urbanism and Architecture in Indian Context
 
17-Article Text-68-8-10-20170815.pdf
17-Article Text-68-8-10-20170815.pdf17-Article Text-68-8-10-20170815.pdf
17-Article Text-68-8-10-20170815.pdf
 
IRJET- A Review Study on Urban Sprawl
IRJET-  	  A Review Study on Urban SprawlIRJET-  	  A Review Study on Urban Sprawl
IRJET- A Review Study on Urban Sprawl
 
Best Practices in community engagement in slum rehabilitation in India - Raji...
Best Practices in community engagement in slum rehabilitation in India - Raji...Best Practices in community engagement in slum rehabilitation in India - Raji...
Best Practices in community engagement in slum rehabilitation in India - Raji...
 
Ajmer singh CV- Urban Planner & GIS expert
Ajmer singh CV- Urban Planner & GIS expertAjmer singh CV- Urban Planner & GIS expert
Ajmer singh CV- Urban Planner & GIS expert
 
ssessment of the Spaces between the Developed and Undeveloped Areas in Rongo ...
ssessment of the Spaces between the Developed and Undeveloped Areas in Rongo ...ssessment of the Spaces between the Developed and Undeveloped Areas in Rongo ...
ssessment of the Spaces between the Developed and Undeveloped Areas in Rongo ...
 
IRJET- Reasons of Causing Urban Sprawl and it’s Effect on Daily Life
IRJET- Reasons of Causing Urban Sprawl and it’s Effect on Daily LifeIRJET- Reasons of Causing Urban Sprawl and it’s Effect on Daily Life
IRJET- Reasons of Causing Urban Sprawl and it’s Effect on Daily Life
 
TRANSIT ORIENTED DEVELOPMENT (TOD)
TRANSIT ORIENTED DEVELOPMENT (TOD)TRANSIT ORIENTED DEVELOPMENT (TOD)
TRANSIT ORIENTED DEVELOPMENT (TOD)
 
A Review of Smart Cities Evolution in India
A Review of Smart Cities Evolution in India A Review of Smart Cities Evolution in India
A Review of Smart Cities Evolution in India
 
Evaluate deficiencies and shortages for the Libyan Residential Urban Planning...
Evaluate deficiencies and shortages for the Libyan Residential Urban Planning...Evaluate deficiencies and shortages for the Libyan Residential Urban Planning...
Evaluate deficiencies and shortages for the Libyan Residential Urban Planning...
 

Recently uploaded

How to Scan Tenants in NYC - You Should Know!
How to Scan Tenants in NYC - You Should Know!How to Scan Tenants in NYC - You Should Know!
How to Scan Tenants in NYC - You Should Know!
BelgiumManagement
 
Architectural & Interior design portfolio.pdf
Architectural & Interior design portfolio.pdfArchitectural & Interior design portfolio.pdf
Architectural & Interior design portfolio.pdf
susantebinum
 
How to keep your Home naturally Cool and Warm
How to keep your Home naturally Cool and WarmHow to keep your Home naturally Cool and Warm
How to keep your Home naturally Cool and Warm
Vinra Construction
 
Optimizing Your MCA Lead Capture Process for Better Results
Optimizing Your MCA Lead Capture Process for Better ResultsOptimizing Your MCA Lead Capture Process for Better Results
Optimizing Your MCA Lead Capture Process for Better Results
Lead Generation Media
 
Rixos Tersane Istanbul Residences Brochure_May2024_ENG.pdf
Rixos Tersane Istanbul Residences Brochure_May2024_ENG.pdfRixos Tersane Istanbul Residences Brochure_May2024_ENG.pdf
Rixos Tersane Istanbul Residences Brochure_May2024_ENG.pdf
Listing Turkey
 
Green Homes, Islamabad Presentation .pdf
Green Homes, Islamabad Presentation .pdfGreen Homes, Islamabad Presentation .pdf
Green Homes, Islamabad Presentation .pdf
ticktoktips
 
Urbanrise Paradise on Earth - Unveiling Unprecedented Luxury in Exquisite Vil...
Urbanrise Paradise on Earth - Unveiling Unprecedented Luxury in Exquisite Vil...Urbanrise Paradise on Earth - Unveiling Unprecedented Luxury in Exquisite Vil...
Urbanrise Paradise on Earth - Unveiling Unprecedented Luxury in Exquisite Vil...
JagadishKR1
 
Simpolo Company Profile & Corporate Logo
Simpolo Company Profile & Corporate LogoSimpolo Company Profile & Corporate Logo
Simpolo Company Profile & Corporate Logo
simpolosparkteam
 
Biography and career about Lixin Azarmehr
Biography and career about Lixin AzarmehrBiography and career about Lixin Azarmehr
Biography and career about Lixin Azarmehr
Lixin Azarmehr
 
Killer Referans Bahcesehir Catalog Listing Turkey
Killer Referans Bahcesehir Catalog Listing TurkeyKiller Referans Bahcesehir Catalog Listing Turkey
Killer Referans Bahcesehir Catalog Listing Turkey
Listing Turkey
 
The KA Housing - Catalogue - Listing Turkey
The KA Housing - Catalogue - Listing TurkeyThe KA Housing - Catalogue - Listing Turkey
The KA Housing - Catalogue - Listing Turkey
Listing Turkey
 
Deutsche EuroShop | Company Presentation | 06/24
Deutsche EuroShop | Company Presentation | 06/24Deutsche EuroShop | Company Presentation | 06/24
Deutsche EuroShop | Company Presentation | 06/24
Deutsche EuroShop AG
 
2BHK-3BHK NEW FLAT FOR SALE IN TUPUDANA,RANCHI.
2BHK-3BHK NEW FLAT FOR SALE IN TUPUDANA,RANCHI.2BHK-3BHK NEW FLAT FOR SALE IN TUPUDANA,RANCHI.
2BHK-3BHK NEW FLAT FOR SALE IN TUPUDANA,RANCHI.
aashiyanastardevelop
 
BricknBolt Understanding Load-Bearing Walls and Their Structural Support in H...
BricknBolt Understanding Load-Bearing Walls and Their Structural Support in H...BricknBolt Understanding Load-Bearing Walls and Their Structural Support in H...
BricknBolt Understanding Load-Bearing Walls and Their Structural Support in H...
BrickAndBolt
 
Riverview City Loni Kalbhor Pune Brochure
Riverview City Loni Kalbhor Pune BrochureRiverview City Loni Kalbhor Pune Brochure
Riverview City Loni Kalbhor Pune Brochure
kishor21012022
 
Sense Levent Kagithane Catalog - Listing Turkey
Sense Levent Kagithane Catalog - Listing TurkeySense Levent Kagithane Catalog - Listing Turkey
Sense Levent Kagithane Catalog - Listing Turkey
Listing Turkey
 
SVN Live 6.3.24 Weekly Property Broadcast
SVN Live 6.3.24 Weekly Property BroadcastSVN Live 6.3.24 Weekly Property Broadcast
SVN Live 6.3.24 Weekly Property Broadcast
SVN International Corp.
 
Elegant Evergreen Homes - Luxury Apartments Redefining Comfort in Yelahanka, ...
Elegant Evergreen Homes - Luxury Apartments Redefining Comfort in Yelahanka, ...Elegant Evergreen Homes - Luxury Apartments Redefining Comfort in Yelahanka, ...
Elegant Evergreen Homes - Luxury Apartments Redefining Comfort in Yelahanka, ...
JagadishKR1
 
One20 North Vancouver Floor Plans by Three Shores Development.
One20 North Vancouver Floor Plans by Three Shores Development.One20 North Vancouver Floor Plans by Three Shores Development.
One20 North Vancouver Floor Plans by Three Shores Development.
VickyAulakh1
 
Brigade Insignia at Yelahanka Brochure.pdf
Brigade Insignia at Yelahanka Brochure.pdfBrigade Insignia at Yelahanka Brochure.pdf
Brigade Insignia at Yelahanka Brochure.pdf
SachinChauhan191
 

Recently uploaded (20)

How to Scan Tenants in NYC - You Should Know!
How to Scan Tenants in NYC - You Should Know!How to Scan Tenants in NYC - You Should Know!
How to Scan Tenants in NYC - You Should Know!
 
Architectural & Interior design portfolio.pdf
Architectural & Interior design portfolio.pdfArchitectural & Interior design portfolio.pdf
Architectural & Interior design portfolio.pdf
 
How to keep your Home naturally Cool and Warm
How to keep your Home naturally Cool and WarmHow to keep your Home naturally Cool and Warm
How to keep your Home naturally Cool and Warm
 
Optimizing Your MCA Lead Capture Process for Better Results
Optimizing Your MCA Lead Capture Process for Better ResultsOptimizing Your MCA Lead Capture Process for Better Results
Optimizing Your MCA Lead Capture Process for Better Results
 
Rixos Tersane Istanbul Residences Brochure_May2024_ENG.pdf
Rixos Tersane Istanbul Residences Brochure_May2024_ENG.pdfRixos Tersane Istanbul Residences Brochure_May2024_ENG.pdf
Rixos Tersane Istanbul Residences Brochure_May2024_ENG.pdf
 
Green Homes, Islamabad Presentation .pdf
Green Homes, Islamabad Presentation .pdfGreen Homes, Islamabad Presentation .pdf
Green Homes, Islamabad Presentation .pdf
 
Urbanrise Paradise on Earth - Unveiling Unprecedented Luxury in Exquisite Vil...
Urbanrise Paradise on Earth - Unveiling Unprecedented Luxury in Exquisite Vil...Urbanrise Paradise on Earth - Unveiling Unprecedented Luxury in Exquisite Vil...
Urbanrise Paradise on Earth - Unveiling Unprecedented Luxury in Exquisite Vil...
 
Simpolo Company Profile & Corporate Logo
Simpolo Company Profile & Corporate LogoSimpolo Company Profile & Corporate Logo
Simpolo Company Profile & Corporate Logo
 
Biography and career about Lixin Azarmehr
Biography and career about Lixin AzarmehrBiography and career about Lixin Azarmehr
Biography and career about Lixin Azarmehr
 
Killer Referans Bahcesehir Catalog Listing Turkey
Killer Referans Bahcesehir Catalog Listing TurkeyKiller Referans Bahcesehir Catalog Listing Turkey
Killer Referans Bahcesehir Catalog Listing Turkey
 
The KA Housing - Catalogue - Listing Turkey
The KA Housing - Catalogue - Listing TurkeyThe KA Housing - Catalogue - Listing Turkey
The KA Housing - Catalogue - Listing Turkey
 
Deutsche EuroShop | Company Presentation | 06/24
Deutsche EuroShop | Company Presentation | 06/24Deutsche EuroShop | Company Presentation | 06/24
Deutsche EuroShop | Company Presentation | 06/24
 
2BHK-3BHK NEW FLAT FOR SALE IN TUPUDANA,RANCHI.
2BHK-3BHK NEW FLAT FOR SALE IN TUPUDANA,RANCHI.2BHK-3BHK NEW FLAT FOR SALE IN TUPUDANA,RANCHI.
2BHK-3BHK NEW FLAT FOR SALE IN TUPUDANA,RANCHI.
 
BricknBolt Understanding Load-Bearing Walls and Their Structural Support in H...
BricknBolt Understanding Load-Bearing Walls and Their Structural Support in H...BricknBolt Understanding Load-Bearing Walls and Their Structural Support in H...
BricknBolt Understanding Load-Bearing Walls and Their Structural Support in H...
 
Riverview City Loni Kalbhor Pune Brochure
Riverview City Loni Kalbhor Pune BrochureRiverview City Loni Kalbhor Pune Brochure
Riverview City Loni Kalbhor Pune Brochure
 
Sense Levent Kagithane Catalog - Listing Turkey
Sense Levent Kagithane Catalog - Listing TurkeySense Levent Kagithane Catalog - Listing Turkey
Sense Levent Kagithane Catalog - Listing Turkey
 
SVN Live 6.3.24 Weekly Property Broadcast
SVN Live 6.3.24 Weekly Property BroadcastSVN Live 6.3.24 Weekly Property Broadcast
SVN Live 6.3.24 Weekly Property Broadcast
 
Elegant Evergreen Homes - Luxury Apartments Redefining Comfort in Yelahanka, ...
Elegant Evergreen Homes - Luxury Apartments Redefining Comfort in Yelahanka, ...Elegant Evergreen Homes - Luxury Apartments Redefining Comfort in Yelahanka, ...
Elegant Evergreen Homes - Luxury Apartments Redefining Comfort in Yelahanka, ...
 
One20 North Vancouver Floor Plans by Three Shores Development.
One20 North Vancouver Floor Plans by Three Shores Development.One20 North Vancouver Floor Plans by Three Shores Development.
One20 North Vancouver Floor Plans by Three Shores Development.
 
Brigade Insignia at Yelahanka Brochure.pdf
Brigade Insignia at Yelahanka Brochure.pdfBrigade Insignia at Yelahanka Brochure.pdf
Brigade Insignia at Yelahanka Brochure.pdf
 

Urban Density Analysis wrt Roads using GIS & Imagery

  • 1. 1 Independent Project with Coursera – The Ohio State University TechniCity by Dr. Jennifer Evans-Cowley, Thomas W. Sanchez Author: Pallavi Prakash Jha – (pallavi.prakash.jha@gmail.com) Built density vs roads with GIS and Satellite Imagery Contents Introduction ....................................................................................... 2 FSI and Densities.............................................................................. 2 Project Area Location, Facts............................................................. 3 Demographic of Study area........................................................... 4 Existing Land Use Percentage with respect to the City ................. 5 Existing Land Use Percentage with respect to the B ward ............ 5 Project Aim........................................................................................ 6 Alternate Methodology with Remote sensing data analysis .............. 6 Examples of DSM outputs ............................................................. 7 Methodology for Study Area using Vector based shape files ............ 8 Analysing Google Map live traffic for study area............................ 8 Road Capacities based on Densities............................................. 9 Traffic Density calculation formula – Alternate approach ......... 10 Project Working............................................................................... 10 Conclusion ...................................................................................... 13 Bibliography .................................................................................... 15
  • 2. 2 Goal: Find rational ways for comparing Built up (BUP) of an area with its existing roads for careful evaluation in revising FSI in cities using GIS and Satellite imagery. Introduction FSI (floor space index) is a ratio of building’s total floor area to its plot area. Currently FSI for suburbs in Mumbai is 1 and 1.33 for island city. The permissible FSI will increase considering areas with better infrastructure connectivity, accessibility, area’s future potential, its proximity to transit stations and the existing levels of FSI consumed. FSI for areas nearby railway station will be raised higher. Reality players and Town planners are in favour of simultaneous up gradation of infrastructure to effectively meet with requirement of increased densities by raising FSI (Sanjay Jog, 2015). However, up gradation of existing infrastructure is a long-term affair and also not feasible in some areas of old cities where some buildings are new and permanent and old buildings have many complexities for redevelopment, though in dilapidated conditions. Street setback is nonexistent and roads are very narrow. Hence such areas call for more effective rational methods for reallocating FSI based on multiple criteria evaluation. FSI and Densities Raising FSI will cater to housing shortages in Mumbai city where land is a scarce resource. However in current situation most of our existing roads are not equipped to handle higher density with increase in FSI. Recommendation of raising FSI for areas nearby all railway stations as per 20 year development plan proposed by the Brihanmumbai Municipal Corporation (BMC) – from 2014 to 2034 may fail and lead to chaotic situations for near future due to limited capacities of existing infrastructure & facilities including roads. (Binoo Nair, 2015) There are number of ways densities affect cities health. Floor Space Index, FSI is a guiding factor in shaping and controlling densities in areas. When FSI is not rationally allocated in areas, it leads to disproportionate densities amounting to hazards on infrastructure. This fails city infrastructure and brings congestions, traffic related problems, jams, wastage of vehicle fuel, air and noise pollution, unrealistic property rates escalation in certain areas, limited open and green spaces and almost no scope for pedestrians or cyclists. Mumbai city is in much need of better planning approach to meet with a lot of problems related to high density. Figure 1: Nagdevi Area, Mumbai In some situations higher FSI may be applied to better optimise infrastructure capacities. In current situations, FSI being same for
  • 3. 3 most of metropolitan area is causing many problems. Some areas that have many cessed buildings that need repairs are inviting higher FSI. However these higher FSI cannot be dealt by existing road capacities in these areas. Result is not only congestion but total parking problem, environmental health concerns, deficient green & open spaces in neighbourhoods and highly dense and unhygienic condition. The same negatively affects small business and socio economic conditions too. With support of corrupt politicians, land mafias and builders perform illegal and unethical construction which is very visible in these areas having unreasonably tall buildings that is unjustified with current Development Control Regulations. Such buildings must be identified and its impact on infrastructure must be highlighted such that this issue gets highlighted for immediate action. Such monopoly dictated by area specific dominating builders snatch away opportunities for small entrepreneurs and developers who want to work law abiding and ethical. Citizens are most affected. With higher densities, infrastructure and amenities do not meet the basic requirement of healthy living. Cities get congested causing adverse effect on every aspect of urban living. Housing becomes unaffordable and slums show up more obviously. Figure 2: Nagdevi Street Mumbai Project Area Location, Facts This project is explored in a section of ward B of Municipal Corporation Greater Mumbai, Metropolitan city Mumbai, India (Figure 4). Total Population in B ward is 1, 40,481 (as per 2001 census) Daytime floating population is about 3, 00,000. The study area is a high density mix use development along 6 meter wide Nagdevi Street between Yusuf Mehrali road and Nagdevi corss lane. Area has many dilapidated cessed buildings with no parking facility/ amenities. Local businesses in these areas are of varied types and the blocks are mainly commercial as per DCR (Figure 7). Nagdevi Street is few blocks away from Yusuf Meharali Road and is close to Mohammed Ali Road (Figure 5: Location Map, Development Plan ( MCGM, 2012). Location is 2.5 km from Marine Lines Railway Station and is 0.6 Km (8 minutes walking distance) from Crawford Market.
  • 4. 4 The project site is well connected with different prominent high activity zones in the vicinity and is strategically located for business and many activities that bring lots of floating population too. Demographic of Study area B ward Population=140481 B ward Total area = 264 Ha Population Density / Ha = 531 Population Density / SQM =531/10000 SQM = 0.0531/SQM Floating Population = 300000 Total Population= 140481+300000= 440481 Total Population Density /Ha = 440481/264=1669 Total Population Density / SQM = 1669/10000=.1669 (Groupe SCE India, 2012) Figure 3: India on World Map; Source: http://damayantikattha.com/export.html Figure 4: Ward B map
  • 5. 5 Figure 5: Location Map, Development Plan ( MCGM, 2012) Figure 6: Google Earth map for location Figure 7: Development Plan Zoning ( MCGM, 2012) Existing Land Use Percentage with respect to the City Area of Entire Mumbai City being 41395.2 ha, B ward comprise of 0.4% residential, 3.4% commercial, 0.3% Offices, 0.4% Educational Amenities, 0.7% Medical Amenities, 2% Social Amenities, 0.2% Public Utilities and Facilities, 3.2% Transportation and Communication Facilities, 0.2% Vacant Land, and Negligible Open Spaces (Groupe SCE India, 2012). Existing Land Use Percentage with respect to the B ward The B ward having an area of 264.56 ha, has 16.81% of residential and 11.42% Commercial, 0.77% of Natural areas and open spaces. Transportation and communication facilities like sea port, dockyard and jetties, railway yards, stations etc. contribute to 63.26% of total area in ward B. Within Natural areas and open spaces there are
  • 6. 6 0.4% playgrounds, 0.06% recreation ground, 0.19% parks & garden, 0.11% clubs gymkhanas. The 16.81% of area under residential use comprises of 0.01% individual housing, 13.81% apartments / multifamily, 1.78% government/ municipal staff/ quarters / housing, 0.08% Chawls, 1.12% slums clusters (Groupe SCE India, 2012). Project Aim Considering the existing scenario of buildings in Nagdevi area where existing consumed FSI is about 4 for most plots and in some cases it’s higher. In redevelopment buildings, FSI allocation is different and it is 50% + existing BUP. This means that redevelopment buildings will invite higher consumption of FSI, hence higher BUP. Aim of this project is to understand road proportion with respect to total consumed Built up (BUP) of an area due to applying high FSI using GIS. This will help planners understand existing scenarios better for taking correct decisions when it comes to revising FSI for Mumbai city. The relation is, higher FSI leads to more BUP that requires higher percentage of roads to meet with the density requirement. Hence for areas that are already saturated with FSI like in case of Nagdevi, it needs reconsideration before allowing more buildings to emerge with high volumes. Especially in case of redevelopment of cessed buildings that is inviting more FSI in these areas need to be checked and thought more carefully and some alternate incentive scheme shall be designed for redevelopment projects of dilapidated buildings. Alternate Methodology with Remote sensing data analysis Satellite images with height data will be helpful in Building density estimation with respect to its road proportions for keeping a check, while upgrading FSI index for the city. Building densities can be quite decently estimated using imagery. It is possible to differentiate various densities of residential development, and to separate these from commercial/industrial and agricultural areas using high- resolution remote sensing image and airborne laser altimetry data (B. I. Alhaddad a, 2008). Methodology for estimating existing BUP with respect to road proportion using satellite data will be same as it is done for study area in this project using GIS shape files subsequently. Some satellite images relevant to site are possible to procure and use but they involve intense raster rectification and calculation (eg. cartosat-1). During the study, I explored a lot of open sources for DEM. The Shuttle Radar Topography Mission(SRTM), ASTER, GDEM Advanced Spaceborne Thermal Emission and Reflection, CARTOSAT – 1 (Figure 8: (Saha, 2014) kakolisaha@spabhopal.ac.inare few examples of these open source data. These open source DEM and multispectral satellite data are very useful for planners and researchers for conducting study exercises for developing good practical methodologies but they have their limitations too with missing data or voids. DSM generation from satellite images are more challenging and open source data is not readily available for the same. This is the main reason for exploring an alternate method using GIS shape files for this study which will be discussed subsequently.
  • 7. 7 Examples of DSM outputs 1. cartosat-1 DSM from cartosat-1 stereo data can be used and traditional ATE and Orthoengine may be used over adaptive ATE for accurately identifying urban features. (Saha, 2014) Figure 8: (Saha, 2014) kakolisaha@spabhopal.ac.in 2. World View Stereo Pair (Commercial Product) DTM was subtracted from DSM and incorporated with building vector model in building height column. Final 3D City Model was generated. Figure 9 shows the 3D City model over Ortho Photo. With this method, 32 M spatial and building height accuracy can be achieved. Results indicate that use of the World View Stereo models for applications that range from building height estimation for RF planning & optimisation in different urban morphology is a feasible task (Nishadh S, 2013). Figure 9
  • 8. 8 Methodology for Study Area using Vector based shape files In this exercise, Available Drawing in pdf format was downloaded from mcgm.gov.in. The drawing was used to create AutoCAD format drawing for editing and creating base files ( MCGM, 2012). These were corrected on scale and projection with reference to Google earthpoint. Finally the corrected shapes were reprojected on EPSG:32643 - WGS 84 / UTM zone 43N in QGIS for further analysis and calculations. This method has been used due to no availability of Digital surface model for the area of study. There might be some irregularities in drawings due to conversion factors and editing. Area wise densities are estimated based on assumption of 4 FSI for the study area. However, building densities are much higher in some cases as observed on site (Figure 1: Nagdevi Area, Mumbai. Redevelopment of cessed buildings allows higher FSI which is 50% added to existing BUP consumed (Mumbai, DCR). This implies that in existing situation, BUP for the study area is much more than assumed 4 FSI for calculation and corresponding streets to these estimated densities are also very less. The methodology will help visualise existing Building density of an area in relation to capacity of its roads. As per DCR, roads and amenities percentage for development is 15% of total plot area. These study highlights, how total built-up is essential be considered for assigning roads and street percentage and if area is already built, high FSI consumption shall be avoided. The comparison is made between total built up verses area of road allocated for the area. Analysing Google Map live traffic for study area It is clear from the above demographic data that the area has very high density population and due to its high floating population, the traffic activity is much amplified. As per the Google maps live traffic data as shown in Figure 10: it is observed that Mohammad Ali road is the most critical link with heavy traffic volumes almost all through the day. Traffic data for inner roads like Nagdevi street, Bibijan street, Narayan Dhruva Street, Nagdevi Cross lane, etc is not available. Most of these inner roads in the area is as narrow as 6-8 meters and have limited vehicular access. Nagdevi Street is non vehicular as the street is most conjusted with its narrow width and high commercial activities. Commute time during peak traffic hour is very high. With Google data as in (Figure 12, Figure 13) we can see that it takes about 10 minutes to cover a distance of 1.7 KM. Figure 10:
  • 9. 9 Figure 11 Figure 12 Figure 13 Road Capacities based on Densities There are four ways to estimate road capacities as mentioned below: 1. Road density /1000 kmsq (method not included in study project) 2. Road density / 1000 population (method included in study project) 3. Density of traffic flow ie. No. Vehicles / Unit Road Length (method not included in study project due to lack of data) 4. Road Area % with respect to Total BUP of project area (method included in study project and feasible with DSM/DEM data analysis)
  • 10. 10 State wise Road Densities for comparison Densities for Maharashtra year 2003.00 2004.00 2005.00 2006.00 2007.00 2008.00 Statewise Road Density Per 1000 km2 881.89 886.16 718.00 716.40 725.16 725.75 Statewise Urban Road Density Per 1000 km2 2709.83 2709.83 2748.58 2760.00 2761.36 2771.01 Statewise Road Density Per 1000 Population 2.71 2.68 2.14 2.10 2.10 2.07 Statewise Urban Road Density Per 1000 Population 0.46 0.45 0.45 0.44 0.43 0.42 Figure 14 Data Source: (Infra_stat_2010, 2010) Traffic Density calculation formula – Alternate approach Alternative method to evaluate road capacities based on traffic intensities and traffic densities will be reasonable to achieve more criteria’s of grading. Formulas are as below but insufficient data to use these in this project. (q) Intensity of Traffic = No. of vehicles passing across road section / unit time; Q=n/t (k) Density of traffic flow = No. Vehicles / Unit Road Length; k= n/x (q) Intensity of traffic = (k) Density of traffic * (u) mean speed of traffic (Rijn, 2004) Road Density - Road Length/ Geographical Area or Population of India (Infra_stat_2010, 2010) Project Working As already mentioned above, we will assume FSI of 4 for the project area. More accurate ways for calculating BUP in these old areas would be actual physical survey followed by further calculation with same method as below. Alternately satellite data will be helpful in estimating near accurate building densities and its relation with its roads and streets. Population has been estimated for the project area based on population density which is 0.0531/SQM as mentioned above. Study Area Total Population(including Floating) 4775 Alll Road Length Meter 1201 Road Density Considering all Roads/4775 Population 0.251518325 Road Density All Roads/1000 Population 0.052673995 Figure 15
  • 11. 11 Figure 16: QGIS: EPSG:32643 - WGS 84 / UTM zone 43N Figure 17: QGIS: EPSG:32643 - WGS 84 / UTM zone 43N
  • 12. 12 Figure 18 Figure 19 Study Area BUP SQM 114444 Alll Road Area SQM 10398 Road Density Considering all Roads/BUP Area 0.090857 Total Road % wrt 114444sqm BUP 9.085666 Figure 20
  • 13. 13 Figure 21 Figure 22 Conclusion Comparing the road density / 1000 population of .053 of project area (Figure 15, Figure 17: QGIS: EPSG:32643 - WGS 84 / UTM zone 43N, Figure 18) and Statewise Urban Road Density Per 1000 Population ranges from 0.42- 0.46 between year 2008-2003 (Figure 14). Facts indicate the difference that the roads are less than required for this area on comparison. Hence any further increase in FSI will worsen the existing situation in study area.
  • 14. 14 As per DCR, amenity percentage for new development of plot size ranging from 2501-10000sqm and above is 15% of total plot area (same is applicable with FSI constrain). The same is not seen in old areas with many cessed buildings like in case of Nagdevi. The project output using vector based GIS analysis illustrates that the total built-up of an area is also essential to be considered for assigning roads and street percentage in a development and if the area is already densely built, than any further high FSI consumption shall be avoided. The comparison is made between total built up verses area of road allocated for the study region. The area is facilitated with 9.08% of road area with respect to BUP consumed (Figure 21, Figure 22). It is important to note that out of all these roads, three roads have limited or no vehicular access that puts further more pressure on vehicular roads. These methodologies using GIS and Satellite imagery can serve as a great tool to planners and decision makers for careful evaluation while revising FSI for cities in realistic existing density scenario. Satellite images with elevation data will also help detect illegally built buildings that have consumed disproportionate FSI. Planning authorities can take advantage of these technologies. Open sources like in case of DEM from SRTM, ASTER, Cartosat-1 are useful for individual researchers and planners, however some open source for DSM would be more encouraging. Figure 23
  • 15. 15 Bibliography MCGM. (2012). Primary Existing Landuse Survey. Accommodation Times. (2014, 7 17). FSI Under Different Schemes. Retrieved 9 8, 2014, from accommodationtimes.com: http://accommodationtimes.com/index.php/f-s-i-under-different- schemes/ B. I. Alhaddad a, *. J. (2008). SATELLITE IMAGERY AND LIDAR DATA FOR EFFICIENTLY DESCRIBING STRUCTURES AND DENSITIES IN RESIDENTIAL URBAN LAND USES CLASSIFICATION. Beijing: The International Archives of the Photogrammetry, Remote Sensing and Spatial Information Sciences. Vol. XXXVII. Part B8. Binoo Nair. (2015, 02 18). BMC's high FSI development plan raises railway hopes. DNA Floor Space Index News . Brindle, B. (2014, 10 31). How does Google Maps predict traffic? Retrieved 04 12, 2015, from howstuffworks.com: http://electronics.howstuffworks.com/how-does-google-maps-predict- traffic.htm Government of Maharashtra, Urban Development Department. (2012). Notofication: Sanction to modification to the DCR for Greater Mumbai 1991 Under Section 37(lAA)(C )of MRTP Act 1966. Sanction to modification to the DCR for Greater Mumbai 1991 Under Section 37(lAA)(C)of MRTP Act. Groupe SCE India. (2012). Existing Landuse maps and Report. Infra_stat_2010. (2010). Retrieved from mospi.nic.in: http://mospi.nic.in/mospi_new/upload/Infra_stat_2010/1.ch_road.pdf Nishadh S, Empower Consultancy Pvt. Ltd. (2013, 03 11). Geospatial World Weekly. 3D city models for wireless network application . Rijn, J. v. (2004). ROAD CAPACITIES. INDEVELOPMENT . Saha, K. (2014). DSM extraction and evaluation from Cartosat DSM extraction and evaluation from Cartosat DSM extraction and evaluation from Cartosat DSM extraction and evaluation from Cartosat DSM extraction and evaluation from Cartosat DSM extraction and evaluation . International Journal of Scientific and Research Publications . Sanjay Jog. (2015, 02 17). Realty sector welcomes BMC's proposal to hike FSI in Greater Mumbai. Business Standars News .