This document describes a Java software tool developed to help transportation engineering students understand the Dijkstra shortest path algorithm. The software provides an intuitive interface for generating transportation networks and animating how the shortest path is updated at each iteration of the Dijkstra algorithm. It offers multiple visual representations like color mapping and tables. The software can step through each iteration or run continuously, and includes voice narratives in different languages to further aid comprehension. A demo video of the animation and results is available online.
Finding Relationships between the Our-NIR Cluster ResultsCSCJournals
The problem of evaluating node importance in clustering has been active research in present days and many methods have been developed. Most of the clustering algorithms deal with general similarity measures. However In real situation most of the cases data changes over time. But clustering this type of data not only decreases the quality of clusters but also disregards the expectation of users, when usually require recent clustering results. In this regard we proposed Our-NIR method that is better than Ming-Syan Chen proposed a method and it has proven with the help of results of node importance, which is related to calculate the node importance that is very useful in clustering of categorical data, still it has deficiency that is importance of data labeling and outlier detection. In this paper we modified Our-NIR method for evaluating of node importance by introducing the probability distribution which will be better than by comparing the results.
The document discusses K-means clustering, an unsupervised machine learning algorithm that partitions observations into k clusters defined by centroids. It compares clustering to classification, noting clustering does not use training data and maps observations into natural groupings. The K-means algorithm is then explained, with the steps of initializing centroids, assigning observations to the closest centroid, revising centroids as cluster means, and repeating until convergence. Applications of clustering in business contexts like banking, retail, and insurance are also briefly mentioned.
Welcome to International Journal of Engineering Research and Development (IJERD)IJERD Editor
call for paper 2012, hard copy of journal, research paper publishing, where to publish research paper,
journal publishing, how to publish research paper, Call For research paper, international journal, publishing a paper, IJERD, journal of science and technology, how to get a research paper published, publishing a paper, publishing of journal, publishing of research paper, reserach and review articles, IJERD Journal, How to publish your research paper, publish research paper, open access engineering journal, Engineering journal, Mathemetics journal, Physics journal, Chemistry journal, Computer Engineering, Computer Science journal, how to submit your paper, peer reviw journal, indexed journal, reserach and review articles, engineering journal, www.ijerd.com, research journals,
yahoo journals, bing journals, International Journal of Engineering Research and Development, google journals, hard copy of journal
This document is a seminar report on the K-Means clustering algorithm submitted by Gaurav Handa. It includes an introduction that discusses the importance of data mining and describes K-Means clustering. It also includes chapters that analyze and plan the implementation of K-Means, describe the algorithm and its flowchart, discuss limitations, and provide examples of implementing K-Means using graphs and Java code. The report was submitted in partial fulfillment of seminar requirements and includes acknowledgements and certificates.
Kernal based speaker specific feature extraction and its applications in iTau...TELKOMNIKA JOURNAL
This document summarizes kernel-based speaker recognition techniques for an automatic speaker recognition system (ASR) in iTaukei cross-language speech recognition. It discusses kernel principal component analysis (KPCA), kernel independent component analysis (KICA), and kernel linear discriminant analysis (KLDA) for nonlinear speaker-specific feature extraction to improve ASR classification rates. Evaluation of the ASR system using these techniques on a Japanese language corpus and self-recorded iTaukei corpus showed that KLDA achieved the best performance, with an equal error rate improvement of up to 8.51% compared to KPCA and KICA.
CC282 Unsupervised Learning (Clustering) Lecture 7 slides for ...butest
This document provides an overview of unsupervised learning techniques, specifically clustering algorithms. It discusses three main approaches to clustering: exclusive clustering using k-means, agglomerative clustering using hierarchical algorithms, and overlapping clustering using fuzzy c-means. It provides examples and explanations of how k-means and hierarchical clustering work, including the steps involved in each algorithm. It also discusses strengths and weaknesses of different clustering methods.
This document discusses hierarchical clustering methods, which arrange clusters in a nested tree structure. It describes bottom-up and top-down approaches for hierarchical clustering. Bottom-up starts with each object as a cluster and merges them into larger clusters, while top-down separates all objects into distinct clusters that are successively merged. Various distance measures for determining cluster similarity are presented, such as distance between centroids and Ward's method which minimizes variance.
This document provides an introduction to k-means clustering, including:
1. K-means clustering aims to partition n observations into k clusters by minimizing the within-cluster sum of squares, where each observation belongs to the cluster with the nearest mean.
2. The k-means algorithm initializes cluster centroids and assigns observations to the nearest centroid, recomputing centroids until convergence.
3. K-means clustering is commonly used for applications like machine learning, data mining, and image segmentation due to its efficiency, though it is sensitive to initialization and assumes spherical clusters.
New Approach for K-mean and K-medoids AlgorithmEditor IJCATR
K-means and K-medoids clustering algorithms are widely used for many practical applications. Original k
medoids algorithms select initial centroids and medoids randomly that affect the quality of the resulting clusters and sometimes it
generates unstable and empty clusters which are meaningless.
expensive and requires time proportional to the product of the number of data items, number of clusters and the number of iterations.
The new approach for the k mean algorithm eliminates the deficiency of exiting k mean. It first calculates the initial centro
requirements of users and then gives better, effective and stable cluster. It also takes less execution time because it eliminates
unnecessary distance computation by using previous iteration. The new approach for k
systematically based on initial centroids. It generates stable clusters to improve accuracy.
Expert system design for elastic scattering neutrons optical model using bpnnijcsa
In present paper, a proposed expert system is designed to obtain a trained formulae for the optical model
parameters used in elastic scattering neutrons of light nuclei for (7Li), at energy range between [(1) to
(20)] MeV. A simple algorithm has used to design this expert system, while a multi-layer backwardpropagation
neural network (BPNN) is applied for training and testing the data used in this model. This
group of formulae may get a simple expert system occurring from governing formulae model, and predicts
the critical parameters usually resulted from the complicated computer coding methods. This expert system
may use in nuclear reactions yields in both fission and fusion nature who gives more closely results to the
real model.
The document discusses the K-means clustering algorithm. It begins by explaining that K-means is an unsupervised learning algorithm that partitions observations into K clusters by minimizing the within-cluster sum of squares. It then provides details on how K-means works, including initializing cluster centers, assigning observations to the nearest center, recalculating centers, and repeating until convergence. The document also discusses evaluating the number of clusters K, dealing with issues like local optima and sensitivity to initialization, and techniques for improving K-means such as K-means++ initialization and feature scaling.
This slide represents topics on PCA (Principal Component Analysis) and SVD (Singular Value Decomposition) where I tried to cover basic PCA, application, and use of PCA and SVD, Important keywords to know about PCA briefly, PCA algorithm and implementation, Basic SVD, SVD calculation, SVD implementation, Performance comparison of SVD and PCA regarding one publicly available dataset.
N.B. Information in this slide are gathered from
1. Machine Learning course by Andrew NG,
2. Mining of Massive Dataset | Stanford University | Artificial Intelligence - All in One (youtube channel)
3. and many more they are described in the slide.
This document discusses face recognition using Fisher face analysis (LDA). It provides an overview of LDA and how it is used for face recognition. LDA works by finding a linear transformation that maximizes between-class variance and minimizes within-class variance to achieve better class separation. The document outlines the LDA algorithm which involves computing within-class and between-class scatter matrices to find discriminant vectors that project faces into a space where classes are well separated. It also mentions the ORL face database is used and provides references for further information.
This document discusses using principal component analysis (PCA) and the discrete cosine transform (DCT) to recognize images from a database. It explains how bitmaps store image data, DCT compacts image energy, and PCA reduces dimensionality by finding the principal components via eigenvectors of the covariance matrix. An algorithm is proposed that uses DCT, PCA on a 3x3 block, characteristic equations to find the maximum eigenvector, and least mean square comparison to recognize queries against the database images.
Reduct generation for the incremental data using rough set theorycsandit
n today’s changing world huge amount of data is ge
nerated and transferred frequently.
Although the data is sometimes static but most comm
only it is dynamic and transactional. New
data that is being generated is getting constantly
added to the old/existing data. To discover the
knowledge from this incremental data, one approach
is to run the algorithm repeatedly for the
modified data sets which is time consuming. The pap
er proposes a dimension reduction
algorithm that can be applied in dynamic environmen
t for generation of reduced attribute set as
dynamic reduct.
The method analyzes the new dataset, when it become
s available, and modifies
the reduct accordingly to fit the entire dataset. T
he concepts of discernibility relation, attribute
dependency and attribute significance of Rough Set
Theory are integrated for the generation of
dynamic reduct set, which not only reduces the comp
lexity but also helps to achieve higher
accuracy of the decision system. The proposed metho
d has been applied on few benchmark
dataset collected from the UCI repository and a dyn
amic reduct is computed. Experimental
result shows the efficiency of the proposed method
The document describes an image pattern matching method using Principal Component Analysis (PCA). It involves preprocessing training images by converting them to grayscale, resizing them, and storing them in a matrix. PCA is then performed on the training images to extract eigenfaces. Test images are projected onto the eigenfaces to obtain a projection matrix. The test image with the minimum Euclidean distance from the training projections in the matrix is considered the best match. The method provides fast and robust image pattern matching through PCA dimensionality reduction and efficient preprocessing.
The document provides an overview of dimensionality reduction techniques. It discusses linear dimensionality reduction methods like principal component analysis (PCA) as well as non-linear dimensionality reduction techniques. For non-linear dimensionality reduction, it describes the concept of manifolds and manifold learning. Specific manifold learning algorithms covered include Isomap, locally linear embedding (LLE), and applications of manifold learning.
Supervised learning: discover patterns in the data that relate data attributes with a target (class) attribute.
These patterns are then utilized to predict the values of the target attribute in future data instances.
Unsupervised learning: The data have no target attribute.
We want to explore the data to find some intrinsic structures in them.
On the High Dimentional Information Processing in Quaternionic Domain and its...IJAAS Team
There are various high dimensional engineering and scientific applications in communication, control, robotics, computer vision, biometrics, etc.; where researchers are facing problem to design an intelligent and robust neural system which can process higher dimensional information efficiently. The conventional real-valued neural networks are tried to solve the problem associated with high dimensional parameters, but the required network structure possesses high complexity and are very time consuming and weak to noise. These networks are also not able to learn magnitude and phase values simultaneously in space. The quaternion is the number, which possesses the magnitude in all four directions and phase information is embedded within it. This paper presents a well generalized learning machine with a quaternionic domain neural network that can finely process magnitude and phase information of high dimension data without any hassle. The learning and generalization capability of the proposed learning machine is presented through a wide spectrum of simulations which demonstrate the significance of the work.
The International Journal of Engineering and Science (The IJES)theijes
This document summarizes a research paper that proposes a novel approach to improving the k-means clustering algorithm. The standard k-means algorithm is computationally expensive and produces results that depend heavily on the initial centroid selection. The proposed approach determines initial centroids systematically and uses a heuristic to efficiently assign data points to clusters. It improves both the accuracy and efficiency of k-means clustering by ensuring the entire process takes O(n2) time without sacrificing cluster quality.
In recent machine learning community, there is a trend of constructing a linear logarithm version of
nonlinear version through the ‘kernel method’ for example kernel principal component analysis, kernel
fisher discriminant analysis, support Vector Machines (SVMs), and the current kernel clustering
algorithms. Typically, in unsupervised methods of clustering algorithms utilizing kernel method, a
nonlinear mapping is operated initially in order to map the data into a much higher space feature, and then
clustering is executed. A hitch of these kernel clustering algorithms is that the clustering prototype resides
in increased features specs of dimensions and therefore lack intuitive and clear descriptions without
utilizing added approximation of projection from the specs to the data as executed in the literature
presented. This paper aims to utilize the ‘kernel method’, a novel clustering algorithm, founded on the
conventional fuzzy clustering algorithm (FCM) is anticipated and known as kernel fuzzy c-means algorithm
(KFCM). This method embraces a novel kernel-induced metric in the space of data in order to interchange
the novel Euclidean matric norm in cluster prototype and fuzzy clustering algorithm still reside in the space
of data so that the results of clustering could be interpreted and reformulated in the spaces which are
original. This property is used for clustering incomplete data. Execution on supposed data illustrate that
KFCM has improved performance of clustering and stout as compare to other transformations of FCM for
clustering incomplete data.
This document discusses principal component analysis (PCA) and its applications in image processing and facial recognition. PCA is a technique used to reduce the dimensionality of data while retaining as much information as possible. It works by transforming a set of correlated variables into a set of linearly uncorrelated variables called principal components. The first principal component accounts for as much of the variability in the data as possible, and each succeeding component accounts for as much of the remaining variability as possible. The document provides an example of applying PCA to a set of facial images to reduce them to their principal components for analysis and recognition.
This document discusses unsupervised learning and clustering. It defines unsupervised learning as modeling the underlying structure or distribution of input data without corresponding output variables. Clustering is described as organizing unlabeled data into groups of similar items called clusters. The document focuses on k-means clustering, describing it as a method that partitions data into k clusters by minimizing distances between points and cluster centers. It provides details on the k-means algorithm and gives examples of its steps. Strengths and weaknesses of k-means clustering are also summarized.
Deepak George provides a presentation on unsupervised learning techniques including K-Means clustering, hierarchical clustering, and DBSCAN. He has experience in data science roles at companies like GE and Mu Sigma. Deepak earned degrees from IIM Bangalore and College of Engineering Trivandrum and lists passions in deep learning, photography, and football. The presentation covers key concepts in clustering algorithms and includes visual explanations and recommendations for applying clustering.
A COMPARATIVE STUDY ON DISTANCE MEASURING APPROACHES FOR CLUSTERINGIJORCS
Clustering plays a vital role in the various areas of research like Data Mining, Image Retrieval, Bio-computing and many a lot. Distance measure plays an important role in clustering data points. Choosing the right distance measure for a given dataset is a biggest challenge. In this paper, we study various distance measures and their effect on different clustering. This paper surveys existing distance measures for clustering and present a comparison between them based on application domain, efficiency, benefits and drawbacks. This comparison helps the researchers to take quick decision about which distance measure to use for clustering. We conclude this work by identifying trends and challenges of research and development towards clustering.
Optimising Data Using K-Means Clustering AlgorithmIJERA Editor
K-means is one of the simplest unsupervised learning algorithms that solve the well known clustering problem. The procedure follows a simple and easy way to classify a given data set through a certain number of clusters (assume k clusters) fixed a priori. The main idea is to define k centroids, one for each cluster. These centroids should be placed in a cunning way because of different location causes different result. So, the better choice is to place them as much as possible far away from each other.
Finding the shortest path in a graph and its visualization using C# and WPF IJECEIAES
This document summarizes a study that implemented Dijkstra's algorithm to find the shortest path between two vertices in an undirected graph using C# and WPF. It describes Dijkstra's algorithm and how it was programmed using .NET 4.0, Visual Studio 2010, and WPF. The program allows drawing graphs, finding the shortest path between two vertices by highlighting the path, and displaying the path length. Screenshots show example outputs of the program finding shortest paths in sample graphs.
Comparative Analysis of Algorithms for Single Source Shortest Path ProblemCSCJournals
The single source shortest path problem is one of the most studied problem in algorithmic graph theory. Single Source Shortest Path is the problem in which we have to find shortest paths from a source vertex v to all other vertices in the graph. A number of algorithms have been proposed for this problem. Most of the algorithms for this problem have evolved around the Dijkstra’s algorithm. In this paper, we are going to do comparative analysis of some of the algorithms to solve this problem. The algorithms discussed in this paper are- Thorup’s algorithm, augmented shortest path, adjacent node algorithm, a heuristic genetic algorithm, an improved faster version of the Dijkstra’s algorithm and a graph partitioning based algorithm.
This document presents an implementation and visualization of Dijkstra's shortest path algorithm using Python turtle. It describes Dijkstra's algorithm, discusses applications like map applications, provides equations and pseudocode to explain the methodology. It also discusses advantages like linear complexity, and limitations like not handling negative edges. The paper concludes by presenting results of testing the implementation, and discussing potential future work like applying the GPS concept used here to other shortest path algorithms.
This document summarizes a research paper that proposes a novel architecture for implementing a 1D lifting integer wavelet transform (IWT) using residue number system (RNS). The key aspects covered are:
1) RNS offers advantages over binary representations for digital signal processing by avoiding carry propagation. A ROM-based approach is proposed for RNS division.
2) The lifting scheme for discrete wavelet transforms is summarized, including split, predict, and update stages.
3) A novel RNS-based architecture is proposed using three main blocks - split, predict, and update - that repeat at each decomposition level. Pipelined implementations of the predict and update blocks are detailed.
An analysis between exact and approximate algorithms for the k-center proble...IJECEIAES
This research focuses on the k-center problem and its applications. Different methods for solving this problem are analyzed. The implementations of an exact algorithm and of an approximate algorithm are presented. The source code and the computation complexity of these algorithms are presented and analyzed. The multitasking mode of the operating system is taken into account considering the execution time of the algorithms. The results show that the approximate algorithm finds solutions that are not worse than two times optimal. In some case these solutions are very close to the optimal solutions, but this is true only for graphs with a smaller number of nodes. As the number of nodes in the graph increases (respectively the number of edges increases), the approximate solutions deviate from the optimal ones, but remain acceptable. These results give reason to conclude that for graphs with a small number of nodes the approximate algorithm finds comparable solutions with those founds by the exact algorithm.
Flight-schedule using Dijkstra's algorithm with comparison of routes findingsIJECEIAES
The Dijkstra algorithm, also termed the shortest-route algorithm, is a model that is categorized within the search algorithms. Its purpose is to discover the shortest-route, from the beginning node (origin node) to any node on the tracks, and is applied to both directional and undirected graphs. However, all edges must have non-negative values. The problem of organizing inter-city flights is one of the most important challenges facing airplanes and how to transport passengers and commercial goods between large cities in less time and at a lower cost. In this paper, the authors implement the Dijkstra algorithm to solve this complex problem and also to update it to see the shortest-route from the origin node (city) to the destination node (other cities) in less time and cost for flights using simulation environment. Such as, when graph nodes describe cities and edge route costs represent driving distances between cities that are linked with the direct road. The experimental results show the ability of the simulation to locate the most cost-effective route in the shortest possible time (seconds), as the test achieved 95% to find the suitable route for flights in the shortest possible time and whatever the number of cities on the tracks application.
Particle Swarm Optimization in the fine-tuning of Fuzzy Software Cost Estimat...Waqas Tariq
Software cost estimation deals with the financial and strategic planning of software projects. Controlling the expensive investment of software development effectively is of paramount importance. The limitation of algorithmic effort prediction models is their inability to cope with uncertainties and imprecision surrounding software projects at the early development stage. More recently, attention has turned to a variety of machine learning methods, and soft computing in particular to predict software development effort. Fuzzy logic is one such technique which can cope with uncertainties. In the present paper, Particle Swarm Optimization Algorithm (PSOA) is presented to fine tune the fuzzy estimate for the development of software projects . The efficacy of the developed models is tested on 10 NASA software projects, 18 NASA projects and COCOMO 81 database on the basis of various criterion for assessment of software cost estimation models. Comparison of all the models is done and it is found that the developed models provide better estimation
This document describes a web-based application called "Path Finding Visualizer" that visualizes shortest path algorithms like Dijkstra's algorithm and A* algorithm. It discusses the motivation, objectives and implementation of the project. The implementation involves creating a graph from a maze, building an adjacency matrix to represent the graph, and applying Dijkstra's algorithm to find the shortest path between nodes. Screenshots show the visualization of Dijkstra's algorithm finding the shortest path between a source and destination node. The technologies used include Visual Studio Code. The project aims to help users better understand how shortest path algorithms work through visualization.
A BLIND ROBUST WATERMARKING SCHEME BASED ON SVD AND CIRCULANT MATRICEScsandit
Multimedia security has been the aim point of considerable research activity because of its wide
application area. The major technology to achieve copyright protection, content authentication,
access control and multimedia security is watermarking which is the process of embedding data
into a multimedia element such as image or audio, this embedded data can later be extracted
from, or detected in the embedded element for different purposes. In this work, a blind
watermarking algorithm based on SVD and circulant matrices has been presented. Every
circulant matrix is associated with a matrix for which the SVD decomposition coincides with the
spectral decomposition. This leads to improve the Chandra algorithm [1], our presentation will
include a discussion on the data hiding capacity, watermark transparency and robustness
against a wide range of common image processing attacks.
This document summarizes an international journal article that proposes a two-phase algorithm for face recognition in the frequency domain using discrete cosine transform (DCT) and discrete Fourier transform (DFT). The algorithm works in two phases: the first phase uses Euclidean distance to determine the K nearest neighbor training samples of a test sample. The second phase represents the test sample as a linear combination of the K nearest neighbors and classifies the sample based on which class representation has the smallest deviation from the test sample. Experimental results on FERET and ORL face databases show the two-phase algorithm based on DCT and DFT outperforms other methods like two-phase sparse representation and PCA/LDA in terms of classification accuracy.
Grid computing is a modularized way of structuring network resources so as to share the information and resources, to perform heavily intense problems. Grid computing is a part of distributed processing which allows the distribution of the problem over multiple computational resources. The formation of grid decides the computation cost, the performance metrics of the operation to be carried out. The grid computing favours the formation of an adhoc structure formed at the time of request (it does not hold an infrastructure) that is termed as virtual organization. This paper presents dynamic source routing for modeling virtual organization.
This document discusses using clustering algorithms to construct ontologies from text documents. It begins with an introduction to semantic search, ontologies in the semantic web, and clustering. It then describes the ROCK clustering algorithm in detail. The main tasks to perform are preprocessing text documents, normalizing term weights, applying latent semantic indexing via singular value decomposition, and using the ROCK clustering algorithm. The goal is to group similar documents into clusters to help construct an ontology from the unstructured text data.
DCE: A NOVEL DELAY CORRELATION MEASUREMENT FOR TOMOGRAPHY WITH PASSIVE REAL...ijdpsjournal
Tomography is important for network design and routing optimization. Prior approaches require either
precise time synchronization or complex cooperation. Furthermore, active tomography consumes explicit
probing resulting in limited scalability. To address the first issue we propose a novel Delay Correlation
Estimation methodology named DCE with no need of synchronization and special cooperation. For the
second issue we develop a passive realization mechanism merely using regular data flow without explicit
bandwidth consumption. Extensive simulations in OMNeT++ are made to evaluate its accuracy where we
show that DCE measurement is highly identical with the true value. Also from test result we find that
mechanism of passive realization is able to achieve both regular data transmission and purpose of
tomography with excellent robustness versus different background traffic and package size.
An Efficient Frame Embedding Using Haar Wavelet Coefficients And Orthogonal C...IJERA Editor
Digital media, applications, copyright defense, and multimedia security have become a vital aspect of our daily life. Digital watermarking is a technology used for the copyright security of digital applications. In this work we have dealt with a process able to mark digital pictures with a visible and semi invisible hided information, called watermark. This process may be the basis of a complete copyright protection system. Watermarking is implemented here using Haar Wavelet Coefficients and Principal Component analysis. Experimental results show high imperceptibility where there is no noticeable difference between the watermarked video frames and the original frame in case of invisible watermarking, vice-versa for semi visible implementation. The watermark is embedded in lower frequency band of Wavelet Transformed cover image. The combination of the two transform algorithm has been found to improve performance of the watermark algorithm. The robustness of the watermarking scheme is analyzed by means of two distinct performance measures viz. Peak Signal to Noise Ratio (PSNR) and Normalized Coefficient (NC).
An Optimized Parallel Algorithm for Longest Common Subsequence Using Openmp –...IRJET Journal
This document summarizes research on developing parallel algorithms to optimize solving the longest common subsequence (LCS) problem. LCS is commonly used for sequence comparison in bioinformatics. Traditional sequential dynamic programming algorithms have complexity of O(mn) for sequences of lengths m and n. The document reviews parallel algorithms developed using tools like OpenMP and GPUs like CUDA to reduce computation time. It proposes the authors' own optimized parallel algorithm for multi-core CPUs using OpenMP.
SVD BASED LATENT SEMANTIC INDEXING WITH USE OF THE GPU COMPUTATIONSijscmcj
The purpose of this article is to determine the usefulness of the Graphics Processing Unit (GPU) calculations used to implement the Latent Semantic Indexing (LSI) reduction of the TERM-BY DOCUMENT matrix. Considered reduction of the matrix is based on the use of the SVD (Singular Value Decomposition) decomposition. A high computational complexity of the SVD decomposition - O(n3), causes that a reduction of a large indexing structure is a difficult task. In this article there is a comparison of the time complexity and accuracy of the algorithms implemented for two different environments. The first environment is associated with the CPU and MATLAB R2011a. The second environment is related to graphics processors and the CULA library. The calculations were carried out on generally available benchmark matrices, which were combined to achieve the resulting matrix of high size. For both considered environments computations were performed for double and single precision data.
Scheduling Using Multi Objective Genetic Algorithmiosrjce
IOSR Journal of Computer Engineering (IOSR-JCE) is a double blind peer reviewed International Journal that provides rapid publication (within a month) of articles in all areas of computer engineering and its applications. The journal welcomes publications of high quality papers on theoretical developments and practical applications in computer technology. Original research papers, state-of-the-art reviews, and high quality technical notes are invited for publications.
1. The document discusses using a multi-objective genetic algorithm (MOGA) for static, non-preemptive scheduling of tasks on homogeneous multiprocessor systems. The goal is to minimize job completion time.
2. A genetic algorithm is proposed that determines suitable task priorities to find sub-optimal scheduling solutions. Genetic algorithms mimic natural selection to evolve better solutions over multiple generations.
3. The document outlines the genetic algorithm process of selection, crossover and mutation to evolve scheduling solutions, and evaluates solutions based on metrics like makespan and speedup.
Radix-3 Algorithm for Realization of Type-II Discrete Sine TransformIJERA Editor
In this paper, radix-3 algorithm for computation of type-II discrete sine transform (DST-II) of length N =
3푚 (푚 = 1,2, … . ) is presented. The DST-II of length N can be realized from three DST-II sequences, each of
length N/3. A block diagram of for computation of the radix-3 DST-II algorithm is given. Signal flow graph for
DST-II of length 푁 = 32 is shown to clarify the proposed algorithm.
Radix-3 Algorithm for Realization of Type-II Discrete Sine TransformIJERA Editor
In this paper, radix-3 algorithm for computation of type-II discrete sine transform (DST-II) of length N =
3𝑚 (𝑚 = 1,2, … . ) is presented. The DST-II of length N can be realized from three DST-II sequences, each of
length N/3. A block diagram of for computation of the radix-3 DST-II algorithm is given. Signal flow graph for
DST-II of length 𝑁 = 32 is shown to clarify the proposed algorithm.
Similar to JAVA BASED VISUALIZATION AND ANIMATION FOR TEACHING THE DIJKSTRA SHORTEST PATH ALGORITHM IN TRANSPORTATION NETWORKS (20)
A workshop hosted by the South African Journal of Science aimed at postgraduate students and early career researchers with little or no experience in writing and publishing journal articles.
How to Manage Your Lost Opportunities in Odoo 17 CRMCeline George
Odoo 17 CRM allows us to track why we lose sales opportunities with "Lost Reasons." This helps analyze our sales process and identify areas for improvement. Here's how to configure lost reasons in Odoo 17 CRM
Strategies for Effective Upskilling is a presentation by Chinwendu Peace in a Your Skill Boost Masterclass organisation by the Excellence Foundation for South Sudan on 08th and 09th June 2024 from 1 PM to 3 PM on each day.
This document provides an overview of wound healing, its functions, stages, mechanisms, factors affecting it, and complications.
A wound is a break in the integrity of the skin or tissues, which may be associated with disruption of the structure and function.
Healing is the body’s response to injury in an attempt to restore normal structure and functions.
Healing can occur in two ways: Regeneration and Repair
There are 4 phases of wound healing: hemostasis, inflammation, proliferation, and remodeling. This document also describes the mechanism of wound healing. Factors that affect healing include infection, uncontrolled diabetes, poor nutrition, age, anemia, the presence of foreign bodies, etc.
Complications of wound healing like infection, hyperpigmentation of scar, contractures, and keloid formation.
Reimagining Your Library Space: How to Increase the Vibes in Your Library No ...Diana Rendina
Librarians are leading the way in creating future-ready citizens – now we need to update our spaces to match. In this session, attendees will get inspiration for transforming their library spaces. You’ll learn how to survey students and patrons, create a focus group, and use design thinking to brainstorm ideas for your space. We’ll discuss budget friendly ways to change your space as well as how to find funding. No matter where you’re at, you’ll find ideas for reimagining your space in this session.
How to Fix the Import Error in the Odoo 17Celine George
An import error occurs when a program fails to import a module or library, disrupting its execution. In languages like Python, this issue arises when the specified module cannot be found or accessed, hindering the program's functionality. Resolving import errors is crucial for maintaining smooth software operation and uninterrupted development processes.
This presentation was provided by Steph Pollock of The American Psychological Association’s Journals Program, and Damita Snow, of The American Society of Civil Engineers (ASCE), for the initial session of NISO's 2024 Training Series "DEIA in the Scholarly Landscape." Session One: 'Setting Expectations: a DEIA Primer,' was held June 6, 2024.
Walmart Business+ and Spark Good for Nonprofits.pdfTechSoup
"Learn about all the ways Walmart supports nonprofit organizations.
You will hear from Liz Willett, the Head of Nonprofits, and hear about what Walmart is doing to help nonprofits, including Walmart Business and Spark Good. Walmart Business+ is a new offer for nonprofits that offers discounts and also streamlines nonprofits order and expense tracking, saving time and money.
The webinar may also give some examples on how nonprofits can best leverage Walmart Business+.
The event will cover the following::
Walmart Business + (https://business.walmart.com/plus) is a new shopping experience for nonprofits, schools, and local business customers that connects an exclusive online shopping experience to stores. Benefits include free delivery and shipping, a 'Spend Analytics” feature, special discounts, deals and tax-exempt shopping.
Special TechSoup offer for a free 180 days membership, and up to $150 in discounts on eligible orders.
Spark Good (walmart.com/sparkgood) is a charitable platform that enables nonprofits to receive donations directly from customers and associates.
Answers about how you can do more with Walmart!"
RHEOLOGY Physical pharmaceutics-II notes for B.pharm 4th sem students
JAVA BASED VISUALIZATION AND ANIMATION FOR TEACHING THE DIJKSTRA SHORTEST PATH ALGORITHM IN TRANSPORTATION NETWORKS
1. International Journal of Software Engineering & Applications (IJSEA), Vol.7, No.3, May 2016
DOI: 10.5121/ijsea.2016.7302 11
JAVA BASED VISUALIZATION AND ANIMATION FOR
TEACHING THE DIJKSTRA SHORTEST PATH
ALGORITHM IN TRANSPORTATION NETWORKS
Ivan Makohon1
, Duc T. Nguyen2
, Masha Sosonkina3
, Yuzhong Shen4
and Manwo Ng5
1
Graduate Student, Department of Modeling, Simulation & Visualization Engineering
(MSVE), Old Dominion University (ODU), Norfolk, Virginia
2
Professor, Civil & Environmental Engineering (CEE) Department, ODU, Norfolk,
Virginia
3
Professor, Department of MSVE,ODU, Norfolk, Virginia
4
Associate Professor, Department of MSVE, ODU, Norfolk, Virginia
5
Assistant Professor, Department of Information Technology and Decision, ODU,
Norfolk, Virginia
ABSTRACT
Shortest path (SP) algorithms, such as the popular Dijkstra algorithm has been considered as the “basic
building blocks” for many advanced transportation network models. Dijkstra algorithm will find the
shortest time (ST) and the corresponding SP to travel from a source node to a destination node.
Applications of SP algorithms include real-time GPS and the Frank-Wolfe network equilibrium.
For transportation engineering students, the Dijkstra algorithm is not easily understood. This paper
discusses the design and development of a software that will help the students to fully understand the key
components involved in the Dijkstra SP algorithm. The software presents an intuitive interface for
generating transportation network nodes/links, and how the SP can be updated in each iteration. The
software provides multiple visual representations of colour mapping and tabular display. The software can
be executed in each single step or in continuous run, making it easy for students to understand the Dijkstra
algorithm. Voice narratives in different languages (English, Chinese and Spanish) are available.A demo
video of the Dijkstra Algorithm’s animation and result can be viewed online from any web browser using
the website: http://www.lions.odu.edu/~imako001/dijkstra/demo/index.html.
KEYWORDS
Transportation, Dijkstra Algorithm, Java, Visualization, Animation
2. International Journal of Software Engineering & Applications (IJSEA), Vol.7, No.3, May 2016
12
1. INTRODUCTION
Finding the shortest time (ST), or the shortest distance (SD) and its corresponding shortest path
(SP) to travel from any i-th “source” node to any j-th “destination (or target)” node of a given
transportation network is an important, fundamental problem in transportation modelling.
Efficient SP algorithms, such as the Label Correction Algorithm (LCA) and its improved version
of Polynomial (or partitioned) LCA, forward Dijkstra, backward Dijkstra, Bi-directional Dijkstra,
A* algorithms have been developed, tested and well documented in the literatures [1-3].
Teaching the SP algorithms (such as the Dijkstra algorithm), however, can be a
difficult/challenging task!
While some teaching information/lecture/tool/animation for Dijkstra algorithms have
existed/appeared in the literatures [4-6], none seems to be suitable/appropriate for our students’
learning environments, due to the lack of one (or more) of the following desirable
features/capabilities:
1. The developed software tool should be user friendly (easy to use).
2. Graphical/colourful animation should be extensively used to display equations, and/or
intermediate/final output results.
3. Clear/attractive computer animated instructor’s voice should be incorporated in the
software tool.
4. The instructor’s voice for teaching materials can be in different/major languages
(English, Chinese, and Spanish).
5. User’s input data can be provided in either interactive mode, or in edited input data file
mode, or by graphical mode.
6. Options for partial (or intermediate) results and/or complete (final results) are available
for the user to select.
7. Options for displaying all detailed intermediate results in the first 1-2 iterations, and/or
directly show the final answers are available for users.
8. Users/learners can provide his/her own data, and compare his/her hand-calculated results
with the computer software’s generated results (in each step of the algorithm) for
enhancing/improving his/her learning abilities.
The remaining sections of this article is organized as follow. In section II, the basic forward
Dijkstra algorithm is summarized (for the readers’ convenience). Java language is adopted in this
work due to its powerful graphical and animated features. Special and useful features of the
developed Java software for teaching Dijkstra algorithm are high-lighted and demonstrated in
(including some computer screen captures) Section III. Conclusions are summarized/suggested in
Section IV.
2. SUMMARY OF THE BASIC FORWARD DIJKSTRA SHORTEST PATH
ALGORITHM
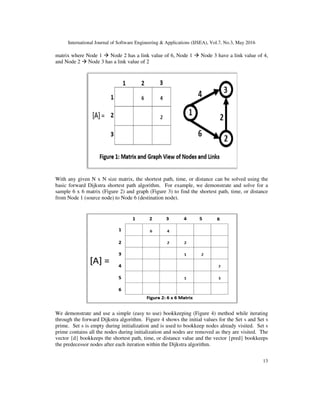
The basic forward Dijkstra algorithm is a graph search algorithm that solves for the shortest path,
time, or distance from any given source node to a destination node. The graph is
represented/stored within a 2-Dimentional NxN matrix where the rows and columns of the matrix
headers are represented as the nodes and the values within the matrix at a location (Aij) are the
link’s value (path, distance, or time value), refer to Figure 1. Figure 1 shows a simple 3 x 3
3. International Journal of Software Engineering & Applications (IJSEA), Vol.7, No.3, May 2016
13
matrix where Node 1 Node 2 has a link value of 6, Node 1 Node 3 have a link value of 4,
and Node 2 Node 3 has a link value of 2
With any given N x N size matrix, the shortest path, time, or distance can be solved using the
basic forward Dijkstra shortest path algorithm. For example, we demonstrate and solve for a
sample 6 x 6 matrix (Figure 2) and graph (Figure 3) to find the shortest path, time, or distance
from Node 1 (source node) to Node 6 (destination node).
We demonstrate and use a simple (easy to use) bookkeeping (Figure 4) method while iterating
through the forward Dijkstra algorithm. Figure 4 shows the initial values for the Set s and Set s
prime. Set s is empty during initialization and is used to bookkeep nodes already visited. Set s
prime contains all the nodes during initialization and nodes are removed as they are visited. The
vector {d} bookkeeps the shortest path, time, or distance value and the vector {pred} bookkeeps
the predecessor nodes after each iteration within the Dijkstra algorithm.
4. International Journal of Software Engineering & Applications (IJSEA), Vol.7, No.3, May 2016
14
During the first iteration, we set the source node to Node 1 and update Set s = {1} and Set s prime
= {2, 3, 4, 5, 6}. Note that Node 1 is removed from Set s prime and added to the Set s.
From Node 1, there are 2 outgoing links, Node 2 and Node 3 (Figure 3). We check the outgoing
Nodes (2 and 3) from Node 1 (Source Node) to determine if Vector [d] and [pred] need to be
updated with the shortest path, time or distance. This can be done referencing the values stored in
Vector d[2] and d[3]. Compare the stored Vector d[2] value to see if it’s greater-than the
computed value, which is the stored Vector d[1] plus the value at C13(link value between Node 1
and 3). Compare the stored Vector d[3] value to see if it’s greater-than the computed value,
which is the stored Vector d[1] plus C12(link value between Node 1 and 2). If the stored values
are greater-than the computed values then update the Vector d with the computed value. If not,
then no update is needed and the stored value remains the same.
5. International Journal of Software Engineering & Applications (IJSEA), Vol.7, No.3, May 2016
15
In both of these cases, the stored values for d[2] and d[3] are infinity (∞) so the values in Vector
[d] and [pred] will need to be updated with the computed values (Figure 5). Figure 5 shows the
simple (easy to use) bookkeeping method and updates (if needed).
Once this calculation and update has taken place, we determine the smallest value among the
nodes in Set {s prime} and then we move the node to the Set {s}. Because Vector d[3] has the
smallest value among the nodes in Set {s prime}, we move Node 3 to Set {s} = { 1, 3 } and
remove it from Set {s prime} = { 2, 4, 5, 6 }. Now Node 3 becomes the next source node.
The Next iteration (k = 2), begins by checking the outgoing nodes from Node 3 (source node).
We check the outgoing Nodes (4 and 5) from Node 3 (Source Node) to determine if Vector [d]
and [pred] need to be updated with the shortest path, time or distance. This can be done
referencing the values stored in Vector d[4] and d[5]. Compare the stored Vector d[4] value to
see if it’s greater-than the computed value, which is the stored Vector d[3] plus the value at
C34(link value between Node 3 and 4). Compare the stored Vector d[5] value to see if it’s
greater-than the computed value, which is the stored Vector d[3] plus C35(link value between
Node 3 and 5). If the stored values are greater-than the computed values then update the Vector d
with the computed value. If not, then no update is needed and the stored value remains the same.
6. International Journal of Software Engineering & Applications (IJSEA), Vol.7, No.3, May 2016
16
In both of these cases, the stored values for d[4] and d[5] are infinity (∞) so the values in Vector
[d] and [pred] will need to be updated with the computed values (Figure 6). Figure 6 shows the
simple (easy to use) bookkeeping method and updates (if needed).
Once this calculation and update has taken place, we determine the smallest value among the
nodes in Set {s prime} and then we move the node to the Set {s}. Because Vector d[4] has the
smallest value among the nodes in Set {s prime}, we move Node 4 to Set {s} = { 1, 3, 4 } and
remove it from Set {s prime} = { 2, 5, 6 }. Now Node 4 becomes the next source node.
The Next iteration (k = 3), begins by checking the outgoing nodes from Node 4 (source node).
We check the outgoing Node 6 from Node 4 (Source Node) to determine if Vector [d] and [pred]
need to be updated with the shortest path, time or distance. This can be done referencing the
values stored in Vector d[6]. Compare the stored Vector d[4] value to see if it’s greater-than the
computed value, which is the stored Vector d[4] plus the value at C46(link value between Node 4
and 6). If the stored value is greater-than the computed value, then update the Vector d with the
computed value. If not, then no update is needed and the stored value remains the same.
In this case, the stored value for d[6] is infinity (∞) so the value in Vector [d] and [pred] will need
to be updated with the computed value (Figure 7). Figure 7 shows the simple (easy to use)
bookkeeping method and updates (if needed).
Once this calculation and update has taken place, we determine the smallest value among the
nodes in Set {s prime} and then we move the node to the Set {s}. Because Vector d[2] and d[5]
has the smallest value, 6 among the nodes in Set {s prime}, we arbitrarily select and move Node 2
to Set {s} = { 1, 3, 4, 2 } and remove it from Set {s prime} = { 5, 6 }. Now Node 2 becomes the
next source node. Note: we could do further research here to pick the better of the 2 choices
instead or arbitrarily selecting one.
The Next iteration (k = 4), begins by checking the outgoing nodes from Node 2 (source node).
We check the outgoing Nodes (3 and 4) from Node 2 (Source Node) to determine if Vector [d]
and [pred] need to be updated with the shortest path, time or distance. This can be done
referencing the values stored in Vector d[3] and d[4]. Compare the stored Vector d[3] value to
7. International Journal of Software Engineering & Applications (IJSEA), Vol.7, No.3, May 2016
17
see if it’s greater-than the computed value, which is the stored Vector d[2] plus the value at
C23(link value between Node 2 and 3). Compare the stored Vector d[4] value to see if it’s
greater-than the computed value, which is the stored Vector d[2] plus C24(link value between
Node 2 and 4). If the stored values are greater-than the computed values then update the Vector d
with the computed value. If not, then no update is needed and the stored value remains the same.
In both of these cases, the stored values for d[3] and d[4] are 4 and 5 respectively so the values
are not greater-than the computed values so no update is needed (Figure 8). Figure 8 shows the
simple (easy to use) bookkeeping method and updates (if needed). In this case, no update is
needed since the stored values are not greater-than the computed values.
Once this calculation and update has taken place, we determine the smallest value among the
nodes in Set {s prime} and then we move the node to the Set {s}. Because Vector d[5] has the
smallest value among the nodes in Set {s prime}, we move Node 5 to Set {s} = { 1, 3, 4, 2, 5 }
and remove it from Set {s prime} = { 6 }. Now Node 5 becomes the next source node. Remark:
When determining the smallest value was a tie for Nodes 2 and 5 (see previous iteration), we
were better off to select and move Node 5 instead of arbitrarily selecting Node 2.
The Next iteration (k = 5), begins by checking the outgoing nodes from Node 5 (source node).
We check the outgoing Nodes (4 and 6) from Node 5 (Source Node) to determine if Vector [d]
and [pred] need to be updated with the shortest path, time or distance. This can be done
referencing the values stored in Vector d[4] and d[6]. Compare the stored Vector d[4] value to
see if it’s greater-than the computed value, which is the stored Vector d[5] plus the value at C54
(link value between Node 5 and 4). Compare the stored Vector d[6] value to see if it’s greater-
than the computed value, which is the stored Vector d[5] plus C56(link value between Node 5 and
6). If the stored values are greater-than the computed values then update the Vector d with the
computed value. If not, then no update is needed and the stored value remains the same.
In both of these cases, the stored values for d[4] and d[6] are 5 and 12 respectively so the value
for d[4] is not greater-than the computed values so no update is needed (Figure 9). However, the
value for d[6] is greater-than the computed values in Vector [d] and [pred] will need to be
updated with the computed values (Figure 9). Figure 9 shows the simple (easy to use)
8. International Journal of Software Engineering & Applications (IJSEA), Vol.7, No.3, May 2016
18
bookkeeping method and updates (if needed). In this case, one outgoing node is updated is
needed since the stored values is greater-than the computed values.
Once this calculation and update has taken place, we determine the smallest value among the
nodes in Set {s prime} and then we move the node to the Set {s}. Because Vector d[6] is the only
remaining node and is the destination node, we move Node 6 to Set {s} = { 1, 3, 4, 2, 5, 6 } and
remove it from Set {s prime} = { empty }. Now Node 6 becomes the next source node and is our
destination node. This completes the shortest path, time, or distance for solving for the basic
forward Dijkstra algorithm.
9. International Journal of Software Engineering & Applications (IJSEA), Vol.7, No.3, May 2016
19
The updates for each iteration for Vector [d], Vector [pred], and Set {s} are displayed in Figures
10, 11, and 12, respectively. For each iteration, the highlighted circle (light blue circle) shows the
corresponding values being updated during that iteration.
10. International Journal of Software Engineering & Applications (IJSEA), Vol.7, No.3, May 2016
3. JAVA COMPUTER A
FORWARD DIJKSTRA ALGORITHM
The previous section’s small-scale 6 x 6 Matrix [A] graph data will be used for the Java [7
computer animated software tool for teaching the
initialize and run the Java software. Once initialized, the application’s “Main Control” Graphical
User Interface (GUI) is displayed (Figure 13). This GUI controls the flow of the basic forward
Dijkstra algorithm teaching steps from start to finish and will provide detailed algorithm steps
while solving for the shortest path, time, or distance.
The users/learners will be able to input the matrix [A] data from several input options (input file,
manual input or randomly generated values) from the “Main Control” GUI. When an input
option is selected the user/learner will be able to modify the data within the “Matrix Editor” GUI.
The “Matrix Editor” GUI (Figure 14) allows the user/learner to change the size of
dimensions and modify the values before solving for the shortest path, time, or distance.
International Journal of Software Engineering & Applications (IJSEA), Vol.7, No.3, May 2016
ANIMATED SOFTWARE TOOL FOR T
LGORITHM
scale 6 x 6 Matrix [A] graph data will be used for the Java [7
computer animated software tool for teaching the Dijkstra algorithm. The users/learner will
initialize and run the Java software. Once initialized, the application’s “Main Control” Graphical
User Interface (GUI) is displayed (Figure 13). This GUI controls the flow of the basic forward
hm teaching steps from start to finish and will provide detailed algorithm steps
while solving for the shortest path, time, or distance.
The users/learners will be able to input the matrix [A] data from several input options (input file,
r randomly generated values) from the “Main Control” GUI. When an input
option is selected the user/learner will be able to modify the data within the “Matrix Editor” GUI.
The “Matrix Editor” GUI (Figure 14) allows the user/learner to change the size of the matrix [A]
dimensions and modify the values before solving for the shortest path, time, or distance.
International Journal of Software Engineering & Applications (IJSEA), Vol.7, No.3, May 2016
20
TEACHING
scale 6 x 6 Matrix [A] graph data will be used for the Java [7-9]
Dijkstra algorithm. The users/learner will
initialize and run the Java software. Once initialized, the application’s “Main Control” Graphical
User Interface (GUI) is displayed (Figure 13). This GUI controls the flow of the basic forward
hm teaching steps from start to finish and will provide detailed algorithm steps
The users/learners will be able to input the matrix [A] data from several input options (input file,
r randomly generated values) from the “Main Control” GUI. When an input
option is selected the user/learner will be able to modify the data within the “Matrix Editor” GUI.
the matrix [A]
dimensions and modify the values before solving for the shortest path, time, or distance.
11. International Journal of Software Engineering & Applications (IJSEA), Vol.7, No.3, May 2016
21
After the Matrix data [A] is entered into the "Matrix Editor" and "Ok" is selected, the focus is
returned back to the "Main Control" GUI. The matrix data [A] is shown in to viewable formats,
the “Matrix Canvas”, "Data", and "Network Graph" views. Both views will be updated
accordingly throughout the steps in the basic forward Dijkstra Algorithm.
Once the matrix data [A] is inputted, the "Play" button is enabled. Once the user/learner selects
the "Play" button, the teaching of the basic forward Dijkstra Algorithm steps begins. The basic
forward Dijkstra Algorithm performs the algorithm steps against the matrix data [A], the matrix
data [A] is updated accordingly and displayed within the Views, and the algorithm steps is
lectured to the user/learner by a computer animated voice. The algorithm steps handled within the
Java software are as follows:
3.1. Step 0 – Initialization
The Java Computer Animation for Teaching the Forward Dijkstra Algorithm will handle the
matrix data if provided as a rectangular or tall matrix. The algorithm will add "dummy" rows (or
columns) with the maximum corresponding value within the matrix.
The Java Computer Animation for Teaching the Forward Dijkstra Algorithm will solve for
shortest path, time, or distance. The GUI will prompt an input dialog for the user/learning to
select what the source and destination nodes.
The Java Computer Animation for Teaching the Forward Dijkstra Algorithm will initialize the
data vectors and sets and set the source node (Figure 15).
3.2. Step 1 – Consider all Outgoing Edges from the Current Node
The Java Computer Animation for Teaching the Forward Dijkstra Algorithm will consider all
outgoing links from the current node and will determine if the stored Vector [d] values for the
outgoing nodes are greater-than the computed values of the previous node plus the link (edge)
12. International Journal of Software Engineering & Applications (IJSEA), Vol.7, No.3, May 2016
22
values. If the stored Vector [d] value is greater-than the computed value then the Vector [d] value
is updated accordingly; otherwise, the value remains the same.
The Java Computer Animation for Teaching the Forward Dijkstra Algorithm will have animated
each step and provide detailed animated voice and text for each step (Figure 16).
3.3. Step 2 – Determine the Smallest “d” Value for each Node within Set
Sfinal`(Prime) and Move the Smallest Node to Set Sfinal
The Java Computer Animation for Teaching the Forward Dijkstra Algorithm will determine the
smallest value from the Set {s prime} and remove the smallest from Set {s prime} and add it to
Set {s}.
13. International Journal of Software Engineering & Applications (IJSEA), Vol.7, No.3, May 2016
23
The Java Computer Animation for Teaching the Forward Dijkstra Algorithm will update the
current node as the source node for the next iteration (Figure 17).
3.4. Step 3 – Determine the Shortest Time and Path from the Source Node to the
Target Node
The Java Computer Animation for Teaching the Forward Dijkstra Algorithm will determine the
shortest path, time, or distance based on the outcome of the Dijkstra algorithms using the
bookkeeping of Vector [d], Vector [pred], Set {s}, Set {s prime}.
The Java Computer Animation for Teaching the Forward Dijkstra Algorithm will highlight the
shortest path (Figure 18).
The Java Computer Animation for Teaching the Forward Dijkstra Algorithm will display the final
results of the shortest path, time, or distance by highlighting the nodes and links from the source
to destination node.
4. CONCLUSIONS
In this article, the basic Dijkstra algorithm has been firstly summarized. Then, Java Computer
Animated Software Tool has been developed to enhance student’s learning. The developed Java
animated software has all the following desirable features/capabilities, such as:
1. The developed software tool should be user friendly (easy to use).
2. Graphical/colourful animation should be extensively used to display equations, and/or
intermediate/final output results.
3. Clear/attractive computer animated instructor’s voice should be incorporated in the
software tool.
14. International Journal of Software Engineering & Applications (IJSEA), Vol.7, No.3, May 2016
24
4. The instructor’s voice for teaching materials can be in different/major languages
(English, Chinese, and Spanish).
5. User’s input data can be provided in either interactive mode, or in edited input data file
mode, or by graphical mode.
6. Options for partial (or intermediate) results and/or complete (final results) are available
for the user to select.
7. Options for displaying all detailed intermediate results in the first 1-2 iterations, and/or
directly show the final answers are available for users.
8. Users/learners can provide his/her own data, and compare his/her hand-calculated results
with the computer software’s generated results (in each step of the algorithm) for
enhancing/improving his/her learning abilities.
ACKNOWLEDGEMENTS
The partial support provided by the NSF grant # ACI-1440673 (ODU-RF Project # 100507-010)
to Duc T. Nguyen is gratefully acknowledged. The work of Sosonkina was supported in part by
the Air Force Office of Scientific Research under the AFOSR award FA9550-12-1-0476, and by
the National Science Foundation grants NSF/OCI---0941434, 0904782, 1047772.
REFERENCES
[1] Sheffi, Y., 1985. Urban Transportation Networks: Equilibrium Analysis with Mathematical
Programming Methods. Available free of charge at:
http://web.mit.edu/sheffi/www/urbanTransportation.html
[2] Lawson, G., Allen, S., Rose, G., Nguyen, D.T., Ng, M.W. “Parallel Label Correcting Algorithms for
Large-Scale Static and Dynamic Transportation Networks on Laptop Personal Computers”,
Transportation Research Board (TRB) 2013 Annual Meeting (Washington, D.C.; Jan. 13-17, 2013);
Session 844 Presentation # 13-2103 (Thursday, Jan. 17-2013; 10:15am-noon); Poster Presentation #
P13-6655.
[3] Paul Johnson III, Duc T. Nguyen, and Manwo Ng, “An Efficient Shortest Distance Decomposition
Algorithm for Large-Scale Transportation Network Problems”, TRB 2014 Annual Meeting
(Washington, D.C.; January 2014); Oral, and Poster Presentations.
[4] Dijkstra’s Shortest Path Algorithm.
http://www.cs.uah.edu/~rcoleman/CS221/Graphs/ShortestPath.html.
[5] Dijkstra Algorithm. http://students.ceid.upatras.gr/~papagel/project/kef5_7_1.htm.
[6] Dijkstra’s Algorithm.http://www3.cs.stonybrook.edu/~skiena/combinatorica/animations/dijkstra.html.
[7] Java Matrix Library (EJML).
Efficient http://code.google.com/p/efficient-java-matrix-library/wiki/EjmlManual.
[8] Google Translate Java. http://code.google.com/p/google-api-translate-java/.
[9] Java Platform Standard
Edition.http://www.oracle.com/technetwork/java/javase/downloads/index.htmllishers.
15. International Journal of Software Engineering & Applications (IJSEA), Vol.7, No.3, May 2016
25
Authors
Ivan Makohon is a current Old Dominion University graduate student pursuing his Masters in Modeling
and Simulations. He has received his Bachelors of Science in Computer Science from Christopher
Newport University (CNU). He has been working as a contractor (and now, a civil servant) as a Senior
Software Engineer, and he is also a Private Pilot.
Duc T. Nguyen has received his B.S., M.S. and Ph.D. (Civil/Structural engineering) degrees from
Northeastern University (Boston), University of California (Berkeley), and the University of Iowa (Iowa
City), respectively. He has been a Civil Engineering faculty at Old Dominion University since 1985. He has
published 4 undergraduate/graduate textbooks. Over 160 research articles and nearly $ 4 million funded
projects have been generated by him. He has received Cray Research, NASA, ODU shining star, and Rufus
Tonelson Distinguished Faculty Awards. His name has been included in the ISIHighlyCited.com list of
most highly cited researchers in Engineering.
Masha Sosonkina has received her B.S. and M.S. degrees in Applied Mathematics from Kiev National
University in Ukraine, and a Ph.D. degree in Computer Science and Applications from Virginia Tech.
During 2003-2012, Dr. Sosonkina was a scientist at the US Department of Energy Ames Laboratory and an
adjunct faculty at Iowa State University. She is currently a professor of Modeling, Simulation and
Visualization Engineering at Old Dominion University. She has also been a visiting research scientist at the
Minnesota Supercomputing Institute, at CERFACS and INRIA French research centers. Her research
interests include high-performance computing, large-scale simulations, parallel numerical algorithms,
performance analysis, and adaptive algorithms.
Yuzhong Shen received his B.S. degree in Electrical Engineering from Fudan University, Shanghai, China,
M.S. degree in Computer Engineering from Mississippi State University, Starkville, Mississippi, and Ph.D.
degree in Electrical Engineering from the University of Delaware, Newark, Delaware. His research
interests include computer graphics, visualization, serious games, signal and image processing, and
modeling and simulation. Dr. Shen is currently an Associate Professor of the Department of Modeling,
Simulation, and Visualization Engineering and the Department of Electrical and Computer Engineering of
Old Dominion University. He is also affiliated with Virginia Modeling, Analysis, and Simulation Center
(VMASC). Dr. Shen is a Senior Member of IEEE.
Manwo Ng is currently an Assistant Professor of Maritime and Supply Chain Management at Old
Dominion University (ODU). He obtained his Ph.D. degree in Transportation from The University of Texas
at Austin. His research focuses on port operations, container shipping, and transportation network
modeling.