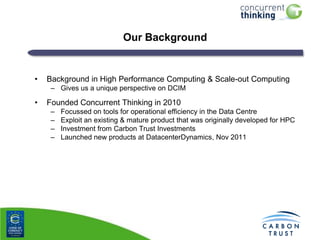
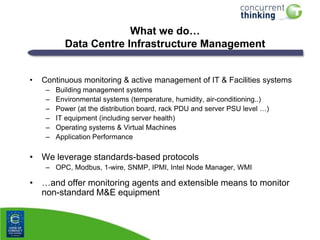
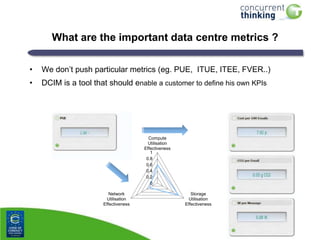
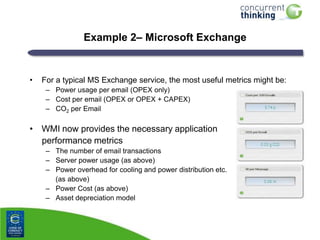
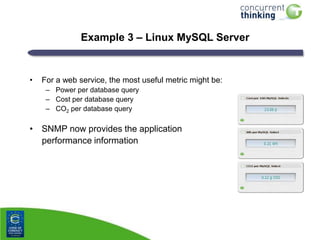
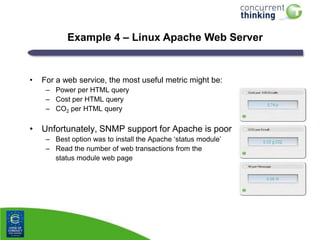
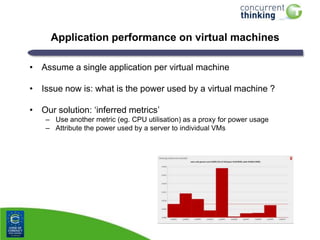
Data Centre Compute and Overhead Costs
Delivering End-to-end KPIs
Michael Rudgyard (CTO)
Concurrent Thinking Ltd
Our Background

•

Background in High Performance Computing & Scale-out Computing
– Gives us a unique perspective on DCIM

•

Founded Concurrent Thinking in 2010
–
–
–
–

Focussed on tools for operational efficiency in the Data Centre
Exploit an existing & mature product that was originally developed for HPC
Investment from Carbon Trust Investments
Launched new products at DatacenterDynamics, Nov 2011
Bridging the Divides – Facilities, IT & Management
It‟s all about
virtualization

It‟s all about
procurement

What constitutes an efficient data centre ??
It‟s about staff
efficiency
It’s all about
cooling
What we do…
Data Centre Infrastructure Management
•

Continuous monitoring & active management of IT & Facilities systems
–
–
–
–
–
–

Building management systems
Environmental systems (temperature, humidity, air-conditioning..)
Power (at the distribution board, rack PDU and server PSU level …)
IT equipment (including server health)
Operating systems & Virtual Machines
Application Performance

• We leverage standards-based protocols
– OPC, Modbus, 1-wire, SNMP, IPMI, Intel Node Manager, WMI

• …and offer monitoring agents and extensible means to monitor
non-standard M&E equipment
Why Data Centre Infrastructure Management ?

•

Aims
–
–
–
–
–

•

To truly understand where operational savings can be made
To understand how factors vary over time / with load etc
To give ample warning of potential (often critical) issues
To report factual information to management
To drive continuous iterative improvement over time

Real energy and productivity savings require a „joined-up‟ approach
– Managing buildings, data-centre facilities and IT in a unified manner
– .. opening the door to the possibility of orchestration of the data-centre
Our Approach
• We provide a tool that:
–
–
–
–
–
–

Tracks power to the server/network (and OS/VM/application) level
Allows for reporting by department, customer or end-user
Offers a simple interface to present data for different purposes
Has integrated IT asset management
Generates business intelligence on end-to-end service delivery
Is both user-extensible and built to scale (visually & architecturally)
What are the important data centre metrics ?
•

We don‟t push particular metrics (eg. PUE, ITUE, ITEE, FVER..)

•

DCIM is a tool that should enable a customer to define his own KPIs

Compute
Utilisation
Effectiveness
1
0.8
0.6
0.4
0.2
0
Network
Utilisation
Effectiveness

Storage
Utilisation
Effectiveness
Example 1 – OS performance monitoring

•

Potential performance metrics:
– CPU utilisation (* CPU benchmark) per watt
– IOPS per watt
– Bytes per watt

• To produce these metrics we monitor:
–
–
–
–

OS metrics via SNMP (Linux/MS) or WMI (MS)
Server power usage (via a managed PDU or IPMI)
(CPU benchmark figure)
Power overhead for cooling and power
distribution etc (and apportion this for this
server)
– Power cost (at different times)
Example 2– Microsoft Exchange

•

For a typical MS Exchange service, the most useful metrics might be:
– Power usage per email (OPEX only)
– Cost per email (OPEX or OPEX + CAPEX)
– CO2 per Email

• WMI now provides the necessary application
performance metrics
– The number of email transactions
– Server power usage (as above)
– Power overhead for cooling and power distribution etc.
(as above)
– Power Cost (as above)
– Asset depreciation model
Example 3 – Linux MySQL Server

•

For a web service, the most useful metric might be:
– Power per database query
– Cost per database query
– CO2 per database query

• SNMP now provides the application
performance information
Example 4 – Linux Apache Web Server

•

For a web service, the most useful metric might be:
– Power per HTML query
– Cost per HTML query
– CO2 per HTML query

• Unfortunately, SNMP support for Apache is poor
– Best option was to install the Apache „status module‟
– Read the number of web transactions from the
status module web page
Application performance on virtual machines
• Assume a single application per virtual machine

• Issue now is: what is the power used by a virtual machine ?
• Our solution: „inferred metrics‟
– Use another metric (eg. CPU utilisation) as a proxy for power usage
– Attribute the power used by a server to individual VMs
Using this information (1)
• Which servers are underused/inefficient/should be virtualised ?

• Which servers are better at delivering a particular service ?
– Provides useful procurement information !
– (or which application gives better performance on the same hardware ?)

• When should I retire old servers ?
– Sweating IT assets is often a very bad idea indeed !
Using this information (2)
• Which departments are using their IT resources wisely ?
– Define server groups and report by department

• Charge departments for individual power usage
Conclusions and open questions
• It is straightforward to monitor many KPIs for a data centre
–
–
–
–

From PUE, to ITUE and “application utilisation efficiency”
Requires a proper monitoring & reporting tool, with inbuilt asset management
Requires power monitoring hardware (managed PDUs or modern servers)
Requires suitable configuration (relatively easy for small numbers of apps)

• It is straightforward to apportion costs by racks, servers and by
department (if application servers are not shared)
• The ROI can be very significant
• Can we monitor granular information by user at the app level ?
– On going collaborations with University of Hertfordshire and Surrey University
– Collaboration on HPC with HPC Wales and STFC Daresbury

Data Centre Compute and Overhead Costs - Delivering End-to-end KPIs

  • 1.
    Data Centre Computeand Overhead Costs Delivering End-to-end KPIs Michael Rudgyard (CTO) Concurrent Thinking Ltd
  • 2.
    Our Background • Background inHigh Performance Computing & Scale-out Computing – Gives us a unique perspective on DCIM • Founded Concurrent Thinking in 2010 – – – – Focussed on tools for operational efficiency in the Data Centre Exploit an existing & mature product that was originally developed for HPC Investment from Carbon Trust Investments Launched new products at DatacenterDynamics, Nov 2011
  • 3.
    Bridging the Divides– Facilities, IT & Management It‟s all about virtualization It‟s all about procurement What constitutes an efficient data centre ?? It‟s about staff efficiency It’s all about cooling
  • 4.
    What we do… DataCentre Infrastructure Management • Continuous monitoring & active management of IT & Facilities systems – – – – – – Building management systems Environmental systems (temperature, humidity, air-conditioning..) Power (at the distribution board, rack PDU and server PSU level …) IT equipment (including server health) Operating systems & Virtual Machines Application Performance • We leverage standards-based protocols – OPC, Modbus, 1-wire, SNMP, IPMI, Intel Node Manager, WMI • …and offer monitoring agents and extensible means to monitor non-standard M&E equipment
  • 5.
    Why Data CentreInfrastructure Management ? • Aims – – – – – • To truly understand where operational savings can be made To understand how factors vary over time / with load etc To give ample warning of potential (often critical) issues To report factual information to management To drive continuous iterative improvement over time Real energy and productivity savings require a „joined-up‟ approach – Managing buildings, data-centre facilities and IT in a unified manner – .. opening the door to the possibility of orchestration of the data-centre
  • 6.
    Our Approach • Weprovide a tool that: – – – – – – Tracks power to the server/network (and OS/VM/application) level Allows for reporting by department, customer or end-user Offers a simple interface to present data for different purposes Has integrated IT asset management Generates business intelligence on end-to-end service delivery Is both user-extensible and built to scale (visually & architecturally)
  • 7.
    What are theimportant data centre metrics ? • We don‟t push particular metrics (eg. PUE, ITUE, ITEE, FVER..) • DCIM is a tool that should enable a customer to define his own KPIs Compute Utilisation Effectiveness 1 0.8 0.6 0.4 0.2 0 Network Utilisation Effectiveness Storage Utilisation Effectiveness
  • 8.
    Example 1 –OS performance monitoring • Potential performance metrics: – CPU utilisation (* CPU benchmark) per watt – IOPS per watt – Bytes per watt • To produce these metrics we monitor: – – – – OS metrics via SNMP (Linux/MS) or WMI (MS) Server power usage (via a managed PDU or IPMI) (CPU benchmark figure) Power overhead for cooling and power distribution etc (and apportion this for this server) – Power cost (at different times)
  • 9.
    Example 2– MicrosoftExchange • For a typical MS Exchange service, the most useful metrics might be: – Power usage per email (OPEX only) – Cost per email (OPEX or OPEX + CAPEX) – CO2 per Email • WMI now provides the necessary application performance metrics – The number of email transactions – Server power usage (as above) – Power overhead for cooling and power distribution etc. (as above) – Power Cost (as above) – Asset depreciation model
  • 10.
    Example 3 –Linux MySQL Server • For a web service, the most useful metric might be: – Power per database query – Cost per database query – CO2 per database query • SNMP now provides the application performance information
  • 11.
    Example 4 –Linux Apache Web Server • For a web service, the most useful metric might be: – Power per HTML query – Cost per HTML query – CO2 per HTML query • Unfortunately, SNMP support for Apache is poor – Best option was to install the Apache „status module‟ – Read the number of web transactions from the status module web page
  • 12.
    Application performance onvirtual machines • Assume a single application per virtual machine • Issue now is: what is the power used by a virtual machine ? • Our solution: „inferred metrics‟ – Use another metric (eg. CPU utilisation) as a proxy for power usage – Attribute the power used by a server to individual VMs
  • 13.
    Using this information(1) • Which servers are underused/inefficient/should be virtualised ? • Which servers are better at delivering a particular service ? – Provides useful procurement information ! – (or which application gives better performance on the same hardware ?) • When should I retire old servers ? – Sweating IT assets is often a very bad idea indeed !
  • 14.
    Using this information(2) • Which departments are using their IT resources wisely ? – Define server groups and report by department • Charge departments for individual power usage
  • 15.
    Conclusions and openquestions • It is straightforward to monitor many KPIs for a data centre – – – – From PUE, to ITUE and “application utilisation efficiency” Requires a proper monitoring & reporting tool, with inbuilt asset management Requires power monitoring hardware (managed PDUs or modern servers) Requires suitable configuration (relatively easy for small numbers of apps) • It is straightforward to apportion costs by racks, servers and by department (if application servers are not shared) • The ROI can be very significant • Can we monitor granular information by user at the app level ? – On going collaborations with University of Hertfordshire and Surrey University – Collaboration on HPC with HPC Wales and STFC Daresbury