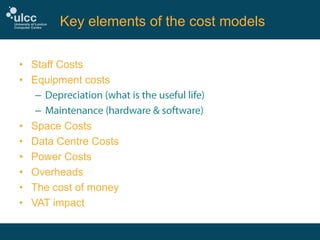
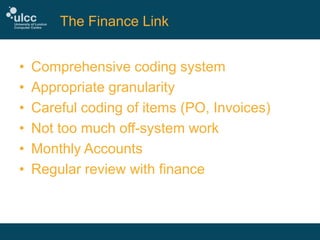
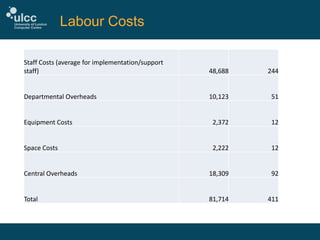
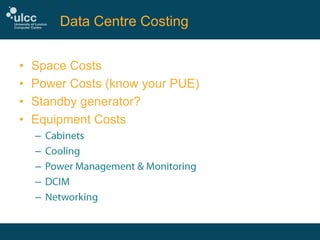
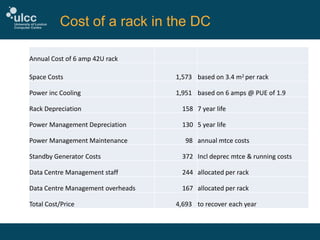
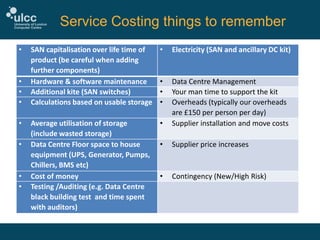
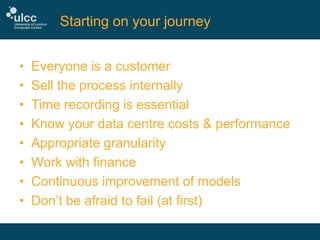
Better Decision Making by Understanding
IT Spend
ULCC Costing Information – The Why
• Established 1968 as a ‘Super Computer’
Centre for HE one of three in the UK
• Continually re-invented ourselves over the
next 40 years
• In 2005 we had 2 large contracts and had
started looking after UoL IT needs
• And then………………
ULCC why we started to dig 2
• 40% of our revenue was insourced back to
JANET
• So were some of our costs (TUPE)
• Lack of useful data
• No up to date financial information
• No basis to make effective decisions
• At the time UoL had an old finance system
The Challenges
•
•
•
•

No useful financial information
No understanding of ‘Cost’ and ‘Price’
No timecard information
Costs allocated to whatever department
could afford it
• Functional Silos – poor communication
• We needed good information
How
•
•
•
•
•
•
•

‘Sell’ the need for change
Collect data
Model activities with technical staff
Model the costs of each activity
Test the models
Continuously improve the models
Use DCF techniques for investment
appraisal
Key elements of the cost models
• Staff Costs
• Equipment costs
–
–
• Space Costs
• Data Centre Costs
• Power Costs
• Overheads
• The cost of money
• VAT impact
The Finance Link
•
•
•
•
•
•

Comprehensive coding system
Appropriate granularity
Careful coding of items (PO, Invoices)
Not too much off-system work
Monthly Accounts
Regular review with finance
Staff Costs – how and what do you recover

•
•
•
•
•

Salary, Employers N I & Pension Costs
Training
Overheads (at ULCC c£150 per day)
Days available for recovery
Don’t forget
–
–
–
Labour Costs
Staff Costs (average for implementation/support
staff)

48,688

244

Departmental Overheads

10,123

51

Equipment Costs

2,372

12

Space Costs

2,222

12

Central Overheads

18,309

92

Total

81,714

411
Data Centre Costing
•
•
•
•

Space Costs
Power Costs (know your PUE)
Standby generator?
Equipment Costs
–
–
–
–
–
Cost of a rack in the DC
Annual Cost of 6 amp 42U rack
Space Costs

1,573 based on 3.4 m2 per rack

Power inc Cooling

1,951 based on 6 amps @ PUE of 1.9

Rack Depreciation

158 7 year life

Power Management Depreciation

130 5 year life

Power Management Maintenance

98 annual mtce costs

Standby Generator Costs

372 Incl deprec mtce & running costs

Data Centre Management staff

244 allocated per rack

Data Centre Management overheads

167 allocated per rack

Total Cost/Price

4,693 to recover each year
Service Costing things to remember
•

•
•
•

•
•

•
•

SAN capitalisation over life time of
product (be careful when adding
further components)
Hardware & software maintenance
Additional kite (SAN switches)
Calculations based on usable storage

•

Electricity (SAN and ancillary DC kit)

•
•
•

Average utilisation of storage
(include wasted storage)
Data Centre Floor space to house
equipment (UPS, Generator, Pumps,
Chillers, BMS etc)
Cost of money
Testing /Auditing (e.g. Data Centre
black building test and time spent
with auditors)

•

Data Centre Management
Your man time to support the kit
Overheads (typically our overheads
are £150 per person per day)
Supplier installation and move costs

•

Supplier price increases

•

Contingency (New/High Risk)
Starting on your journey
•
•
•
•
•
•
•
•

Everyone is a customer
Sell the process internally
Time recording is essential
Know your data centre costs & performance
Appropriate granularity
Work with finance
Continuous improvement of models
Don’t be afraid to fail (at first)

Better Decision Making by Understanding IT Spend

  • 1.
    Better Decision Makingby Understanding IT Spend
  • 2.
    ULCC Costing Information– The Why • Established 1968 as a ‘Super Computer’ Centre for HE one of three in the UK • Continually re-invented ourselves over the next 40 years • In 2005 we had 2 large contracts and had started looking after UoL IT needs • And then………………
  • 3.
    ULCC why westarted to dig 2 • 40% of our revenue was insourced back to JANET • So were some of our costs (TUPE) • Lack of useful data • No up to date financial information • No basis to make effective decisions • At the time UoL had an old finance system
  • 4.
    The Challenges • • • • No usefulfinancial information No understanding of ‘Cost’ and ‘Price’ No timecard information Costs allocated to whatever department could afford it • Functional Silos – poor communication • We needed good information
  • 5.
    How • • • • • • • ‘Sell’ the needfor change Collect data Model activities with technical staff Model the costs of each activity Test the models Continuously improve the models Use DCF techniques for investment appraisal
  • 6.
    Key elements ofthe cost models • Staff Costs • Equipment costs – – • Space Costs • Data Centre Costs • Power Costs • Overheads • The cost of money • VAT impact
  • 7.
    The Finance Link • • • • • • Comprehensivecoding system Appropriate granularity Careful coding of items (PO, Invoices) Not too much off-system work Monthly Accounts Regular review with finance
  • 8.
    Staff Costs –how and what do you recover • • • • • Salary, Employers N I & Pension Costs Training Overheads (at ULCC c£150 per day) Days available for recovery Don’t forget – – –
  • 9.
    Labour Costs Staff Costs(average for implementation/support staff) 48,688 244 Departmental Overheads 10,123 51 Equipment Costs 2,372 12 Space Costs 2,222 12 Central Overheads 18,309 92 Total 81,714 411
  • 10.
    Data Centre Costing • • • • SpaceCosts Power Costs (know your PUE) Standby generator? Equipment Costs – – – – –
  • 11.
    Cost of arack in the DC Annual Cost of 6 amp 42U rack Space Costs 1,573 based on 3.4 m2 per rack Power inc Cooling 1,951 based on 6 amps @ PUE of 1.9 Rack Depreciation 158 7 year life Power Management Depreciation 130 5 year life Power Management Maintenance 98 annual mtce costs Standby Generator Costs 372 Incl deprec mtce & running costs Data Centre Management staff 244 allocated per rack Data Centre Management overheads 167 allocated per rack Total Cost/Price 4,693 to recover each year
  • 12.
    Service Costing thingsto remember • • • • • • • • SAN capitalisation over life time of product (be careful when adding further components) Hardware & software maintenance Additional kite (SAN switches) Calculations based on usable storage • Electricity (SAN and ancillary DC kit) • • • Average utilisation of storage (include wasted storage) Data Centre Floor space to house equipment (UPS, Generator, Pumps, Chillers, BMS etc) Cost of money Testing /Auditing (e.g. Data Centre black building test and time spent with auditors) • Data Centre Management Your man time to support the kit Overheads (typically our overheads are £150 per person per day) Supplier installation and move costs • Supplier price increases • Contingency (New/High Risk)
  • 13.
    Starting on yourjourney • • • • • • • • Everyone is a customer Sell the process internally Time recording is essential Know your data centre costs & performance Appropriate granularity Work with finance Continuous improvement of models Don’t be afraid to fail (at first)