Downloaded 533 times


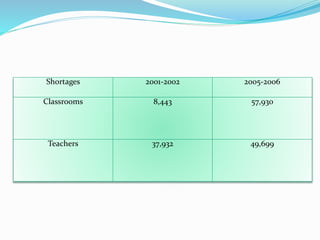


The document summarizes teacher to pupil ratios in various Asian countries, noting the Philippines has ratios of 1:45 for elementary and 1:27 for lower secondary. It also outlines significant shortages in classrooms, teachers, textbooks and other resources in the Philippines public education system from 2001-2006. Overcrowded classrooms with around 80 students each are common.


