Downloaded 265 times
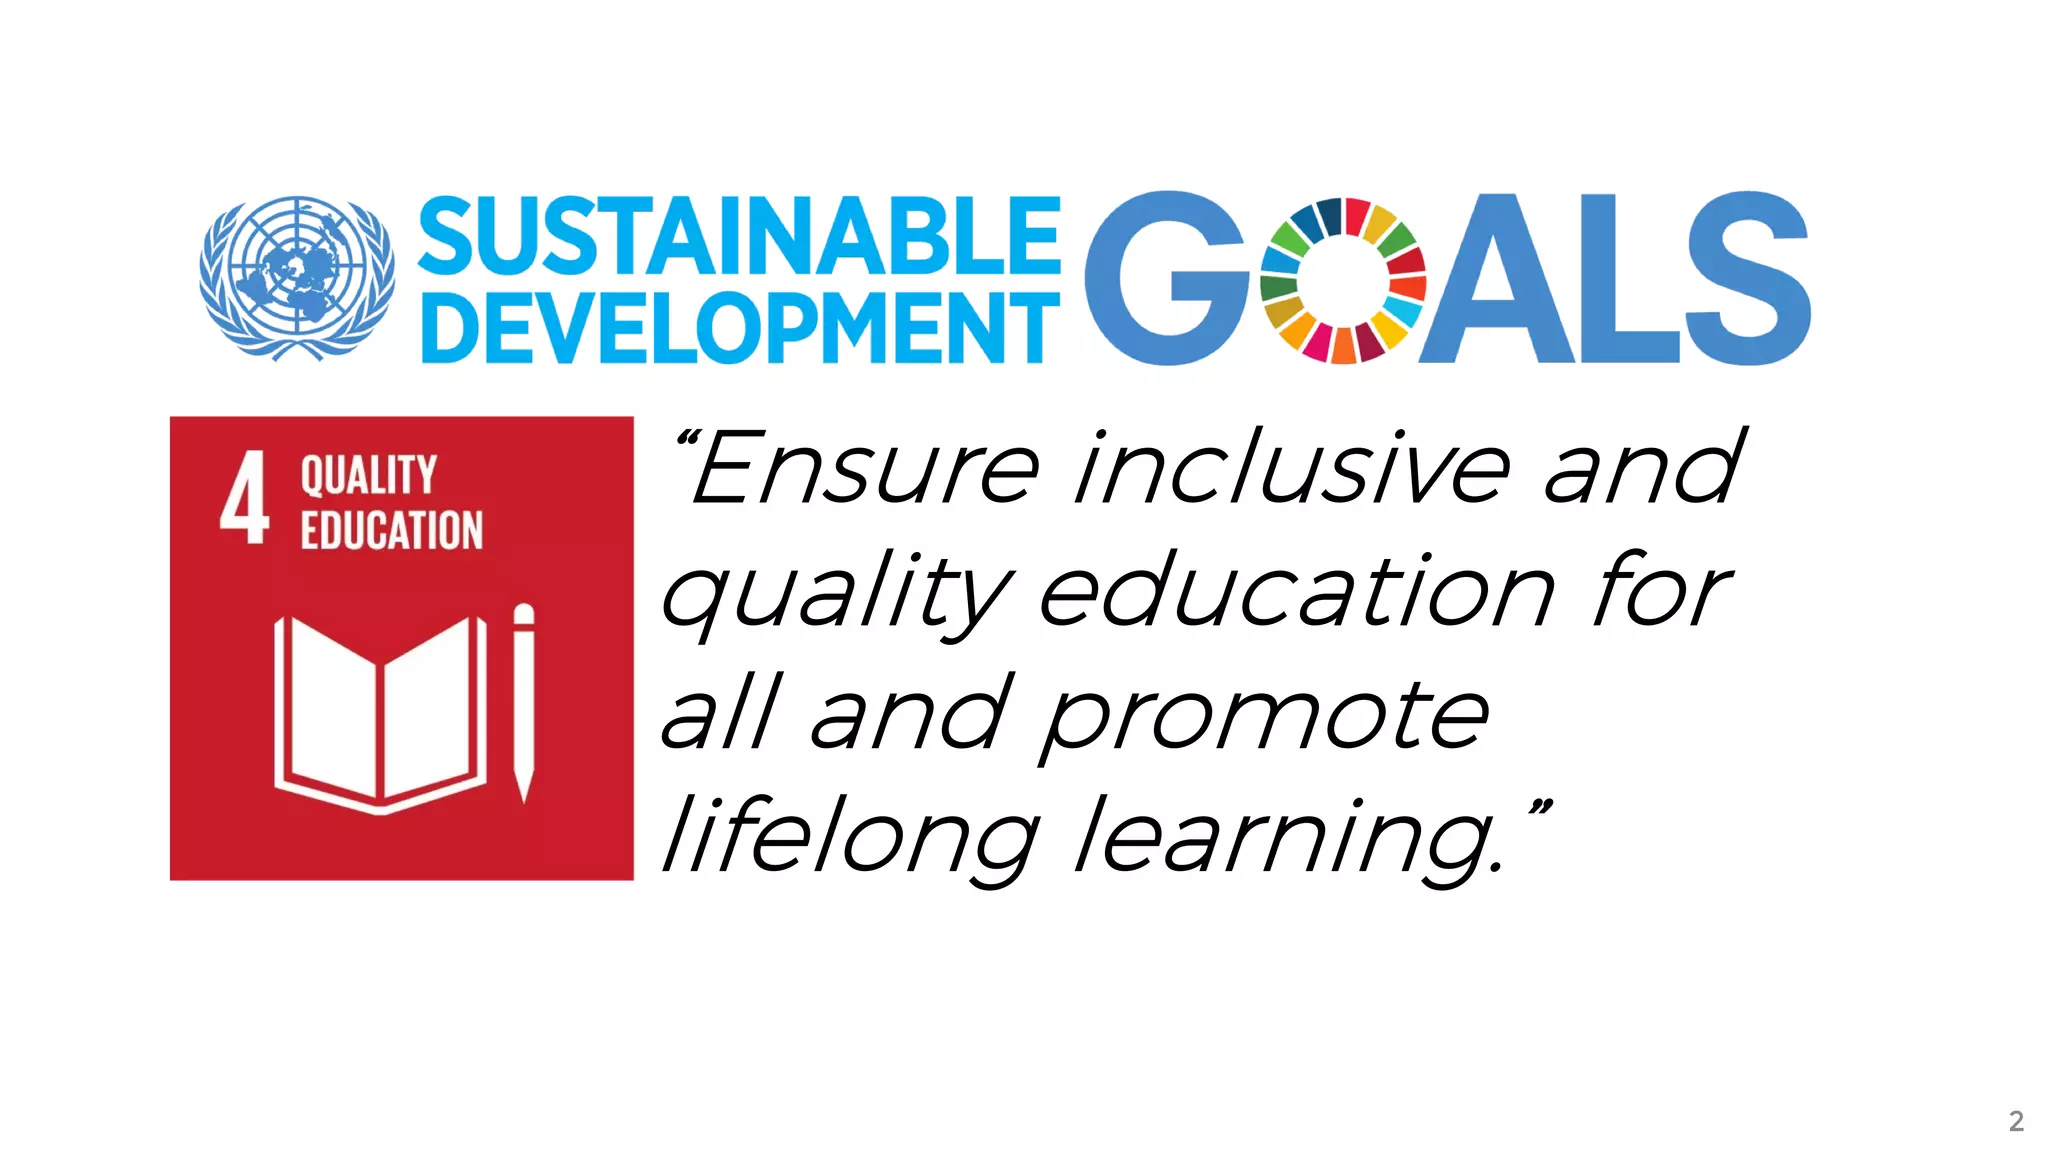
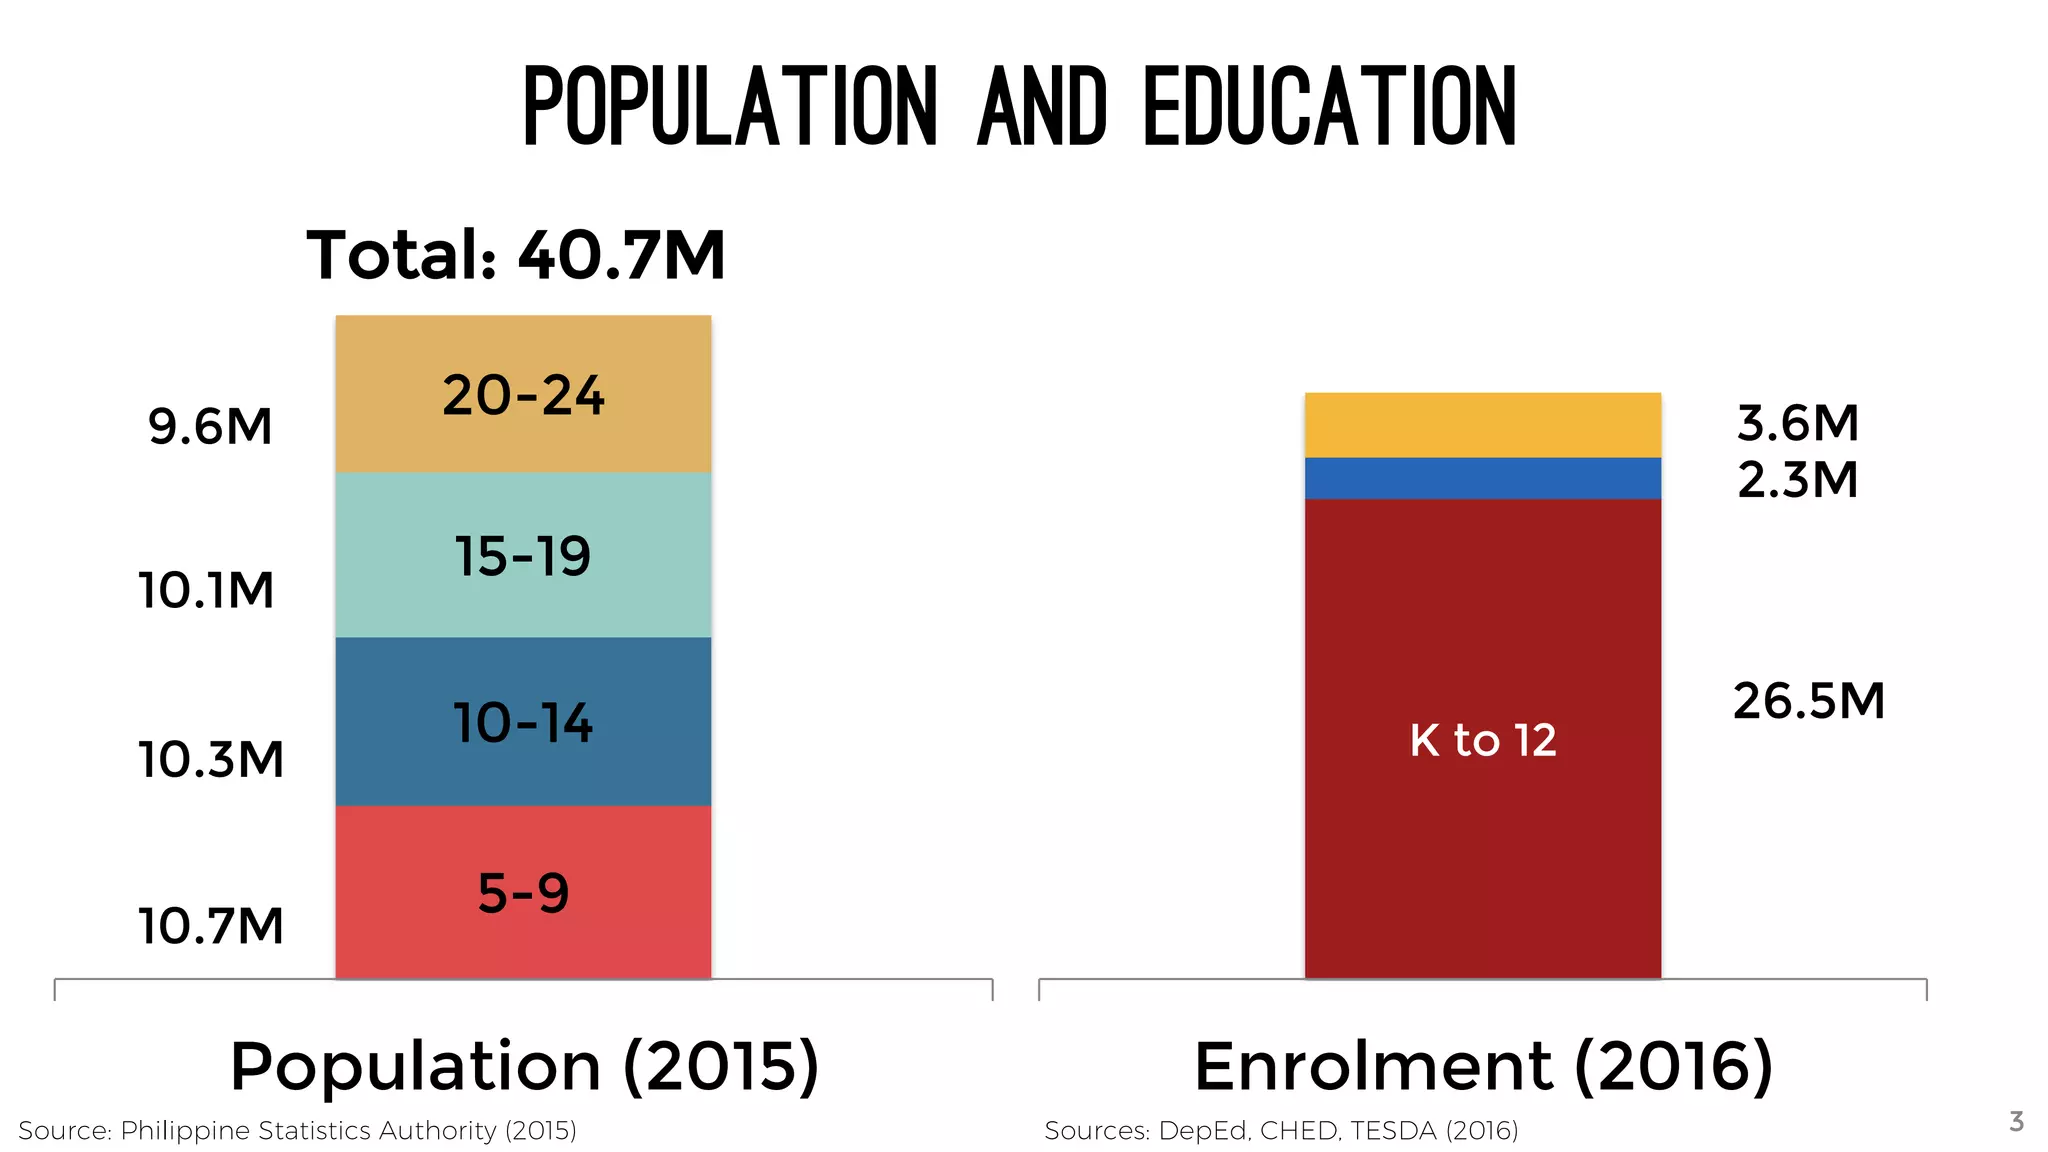
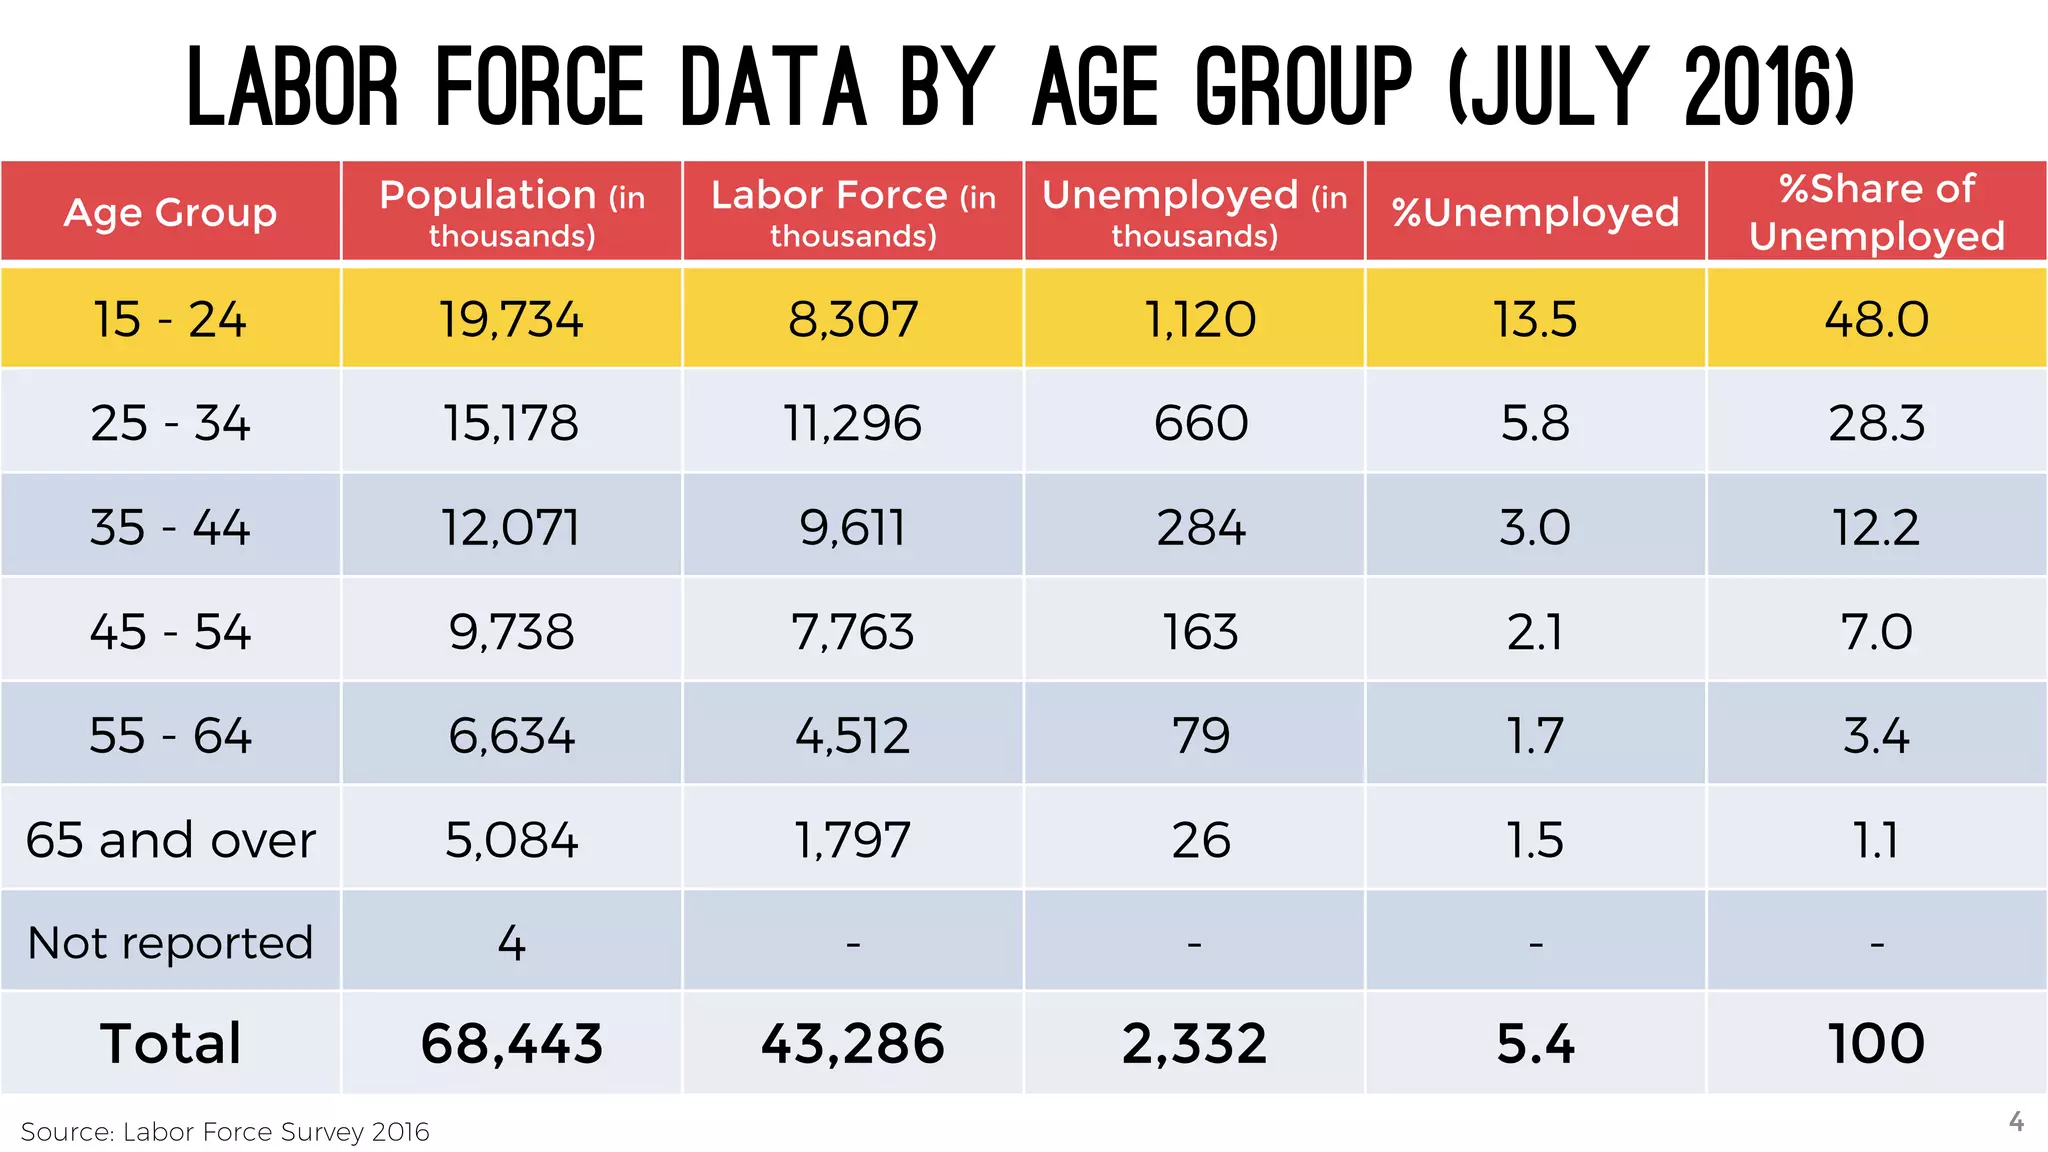
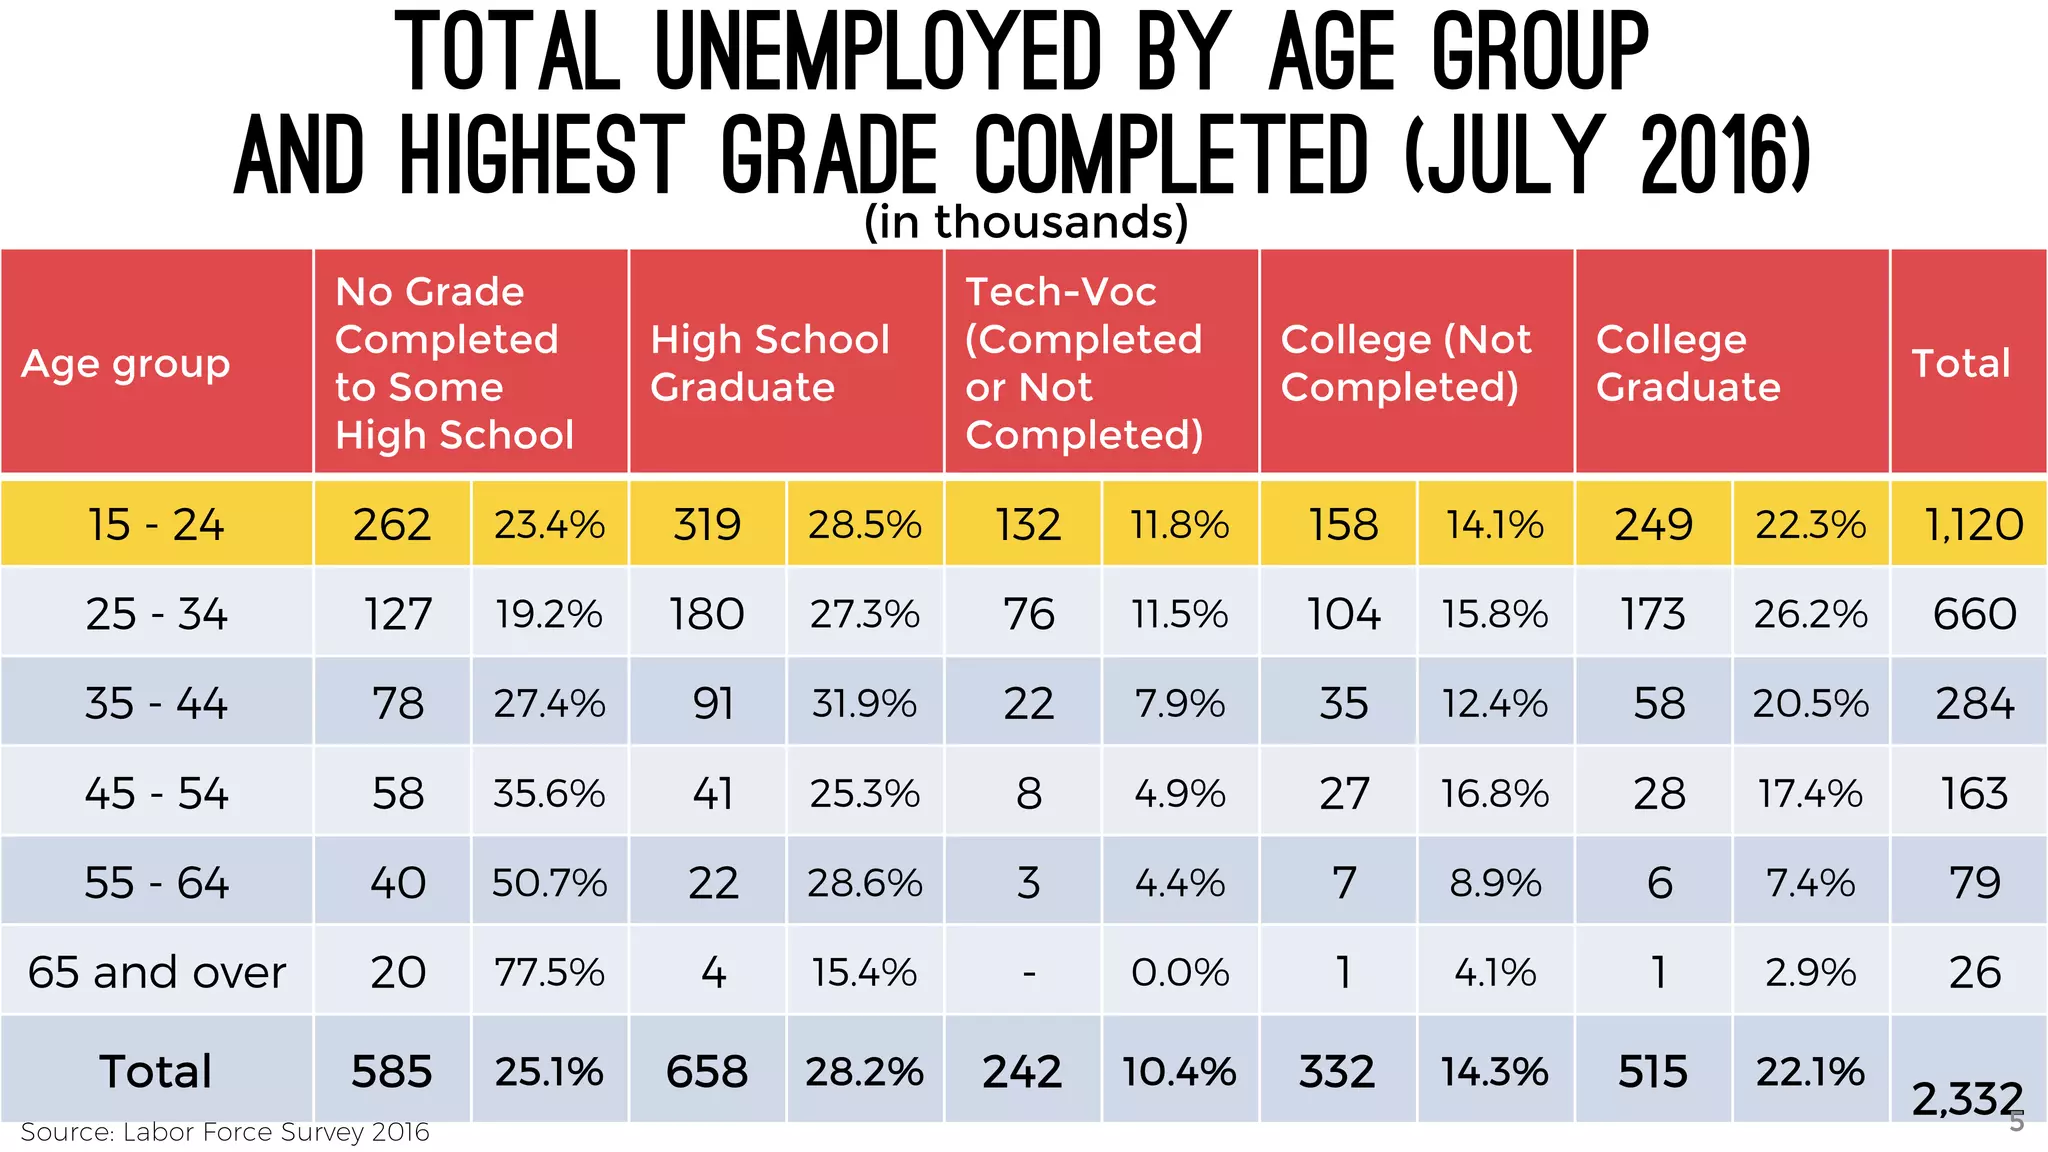
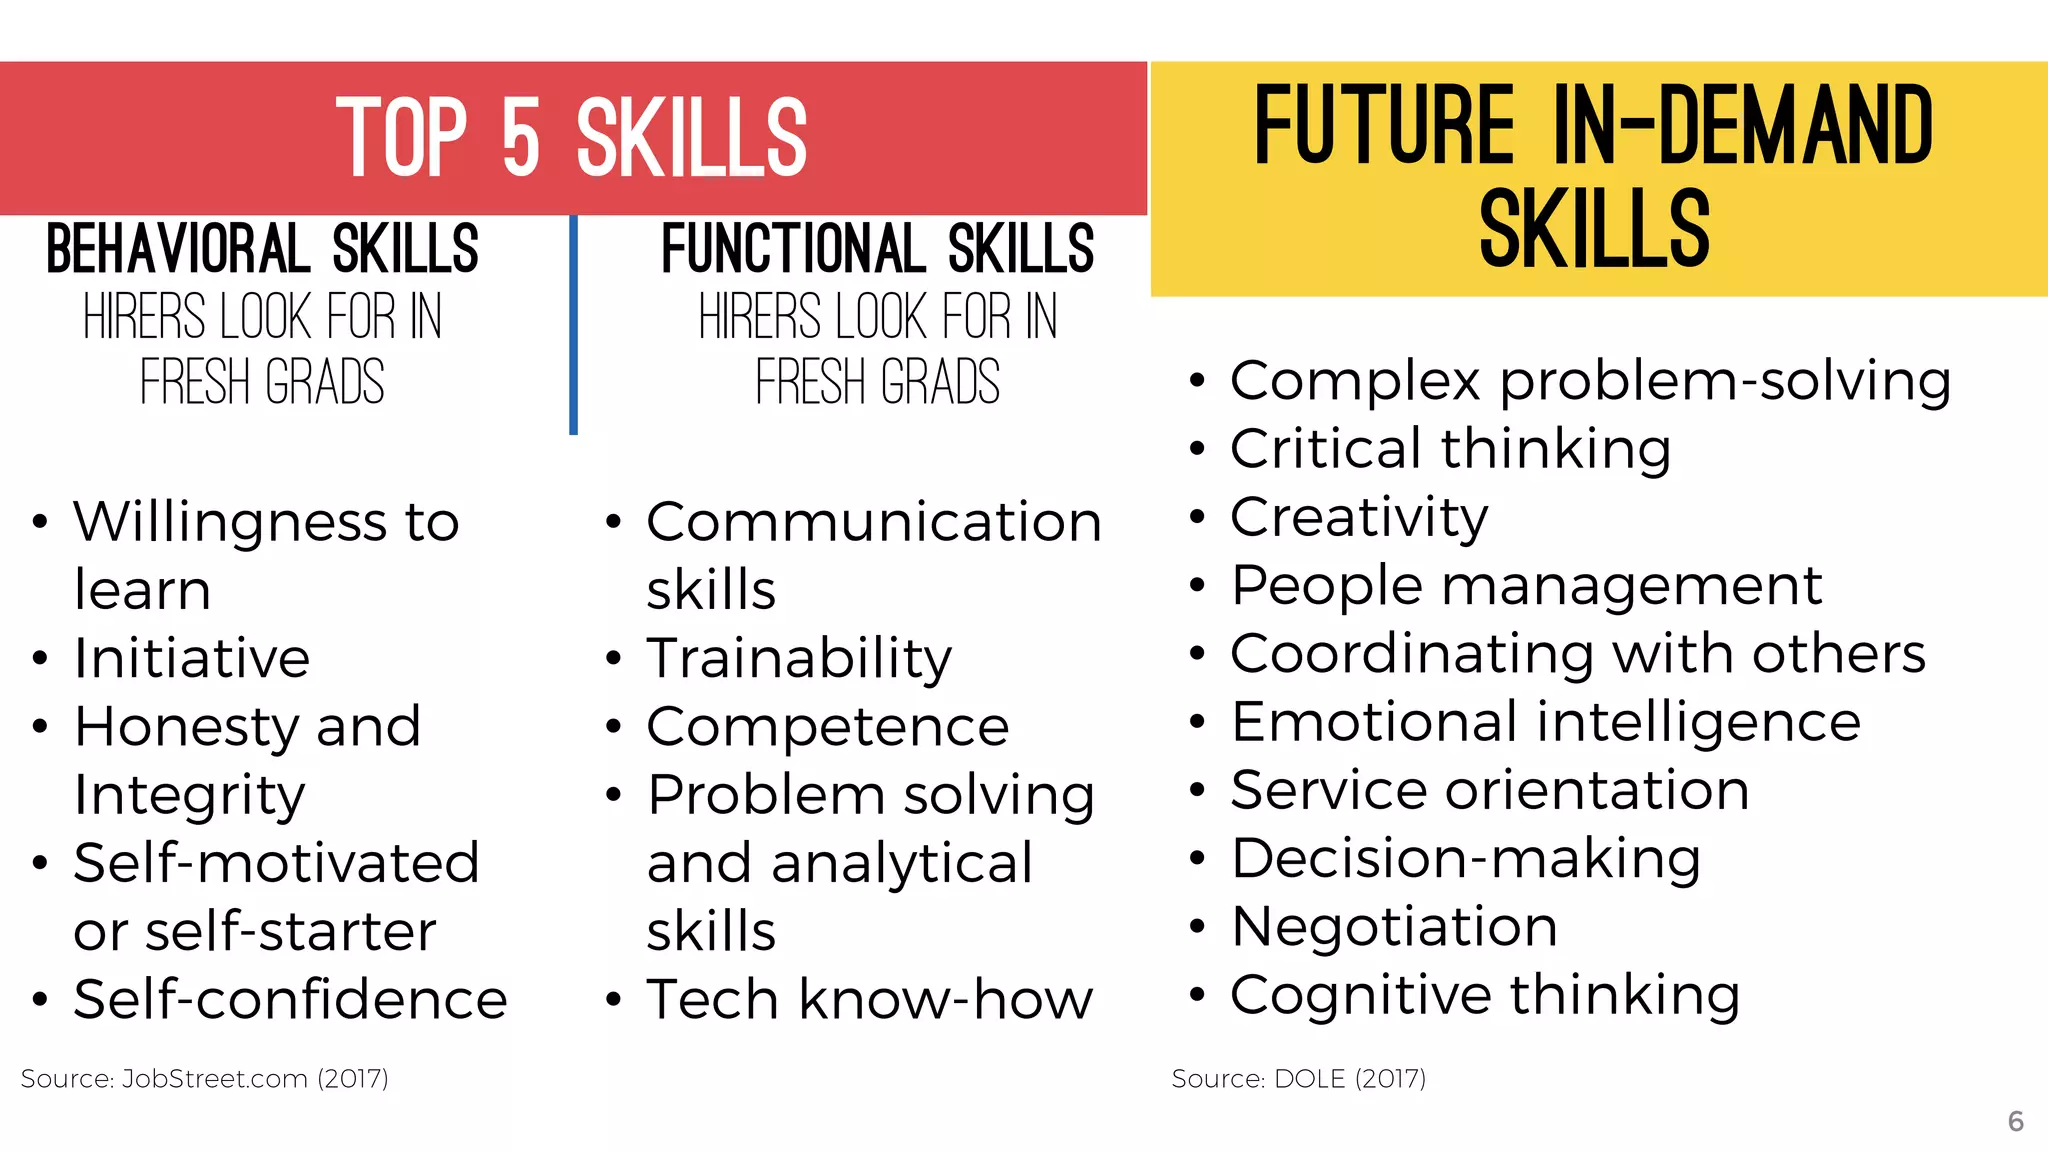
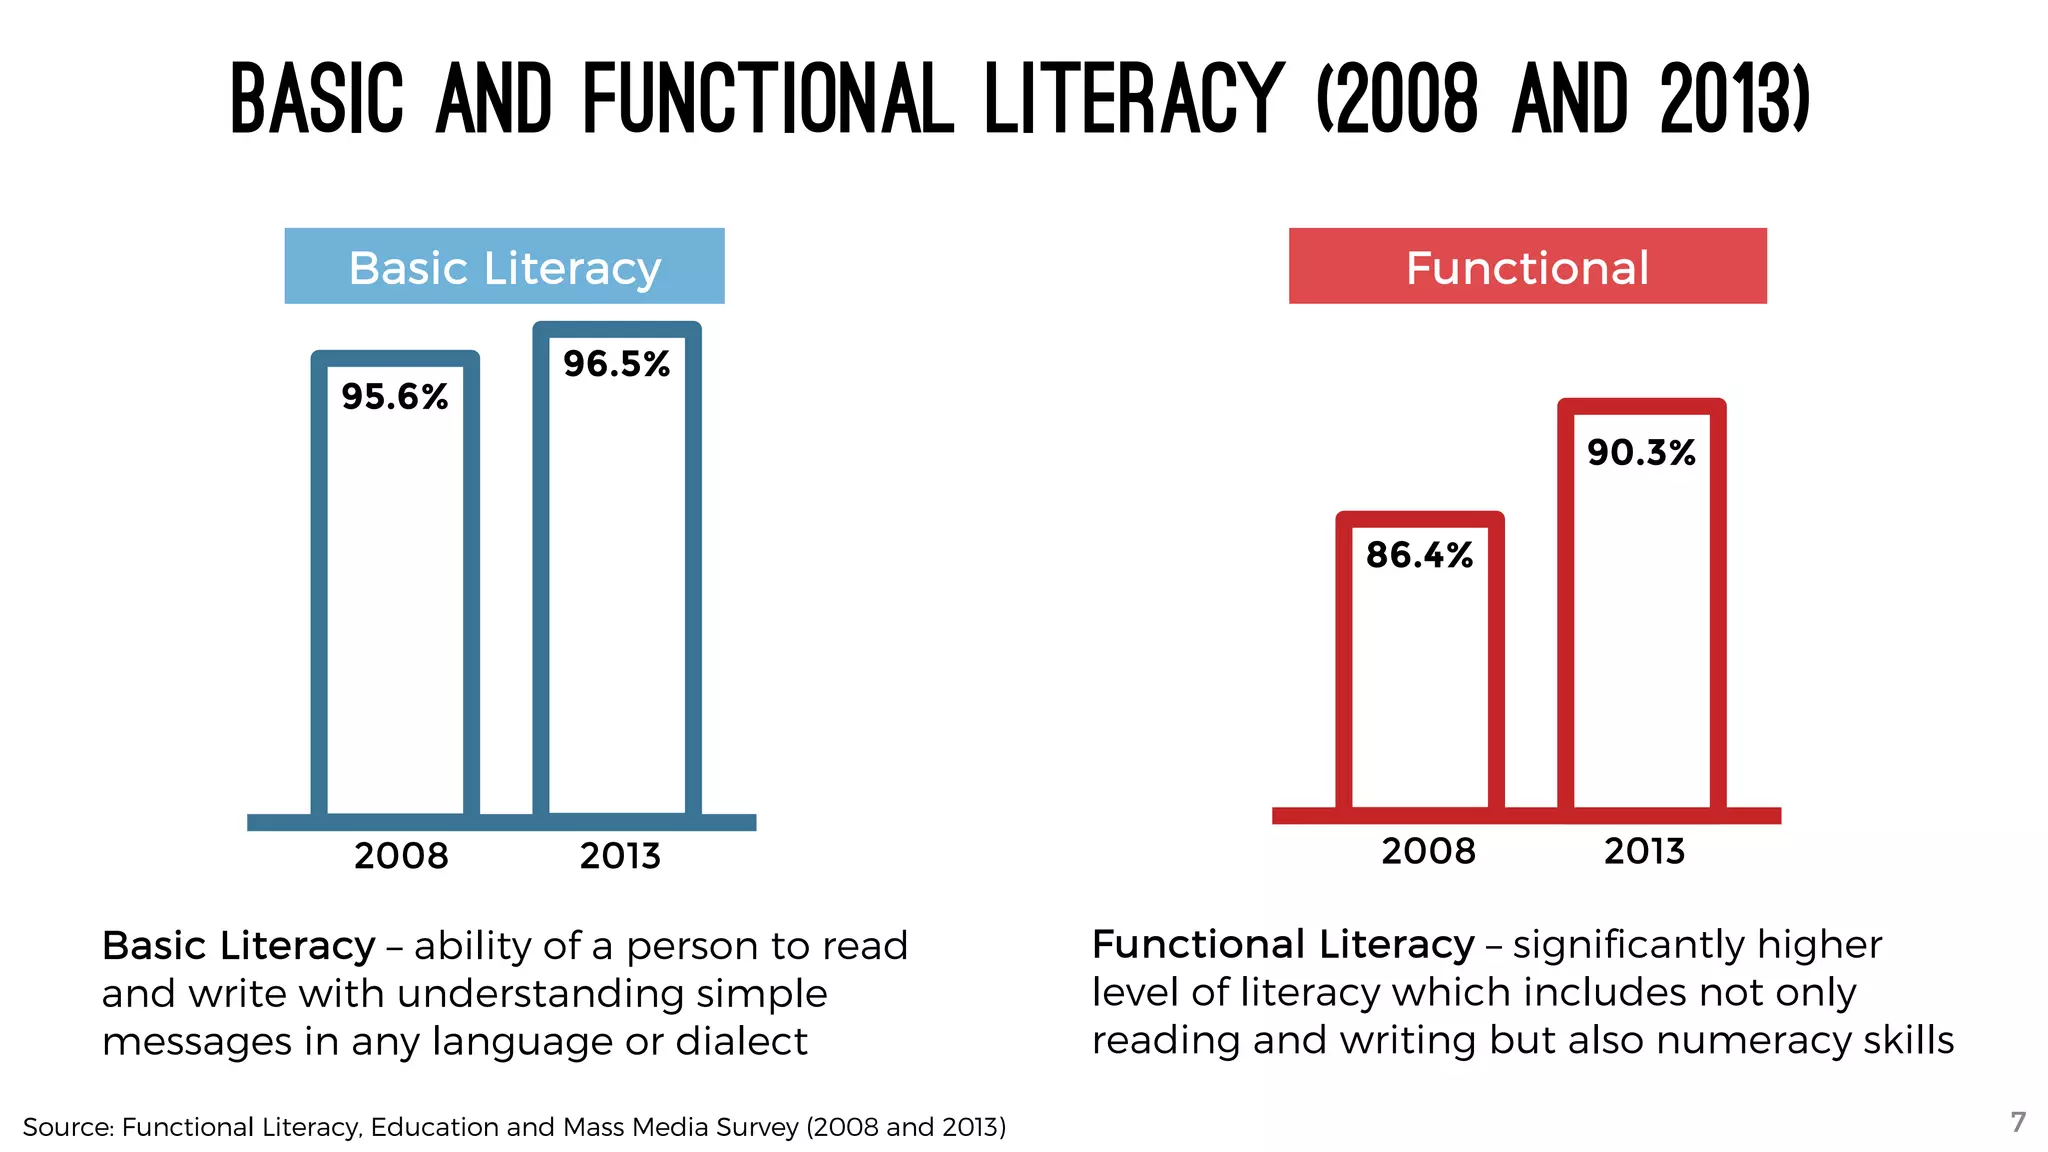
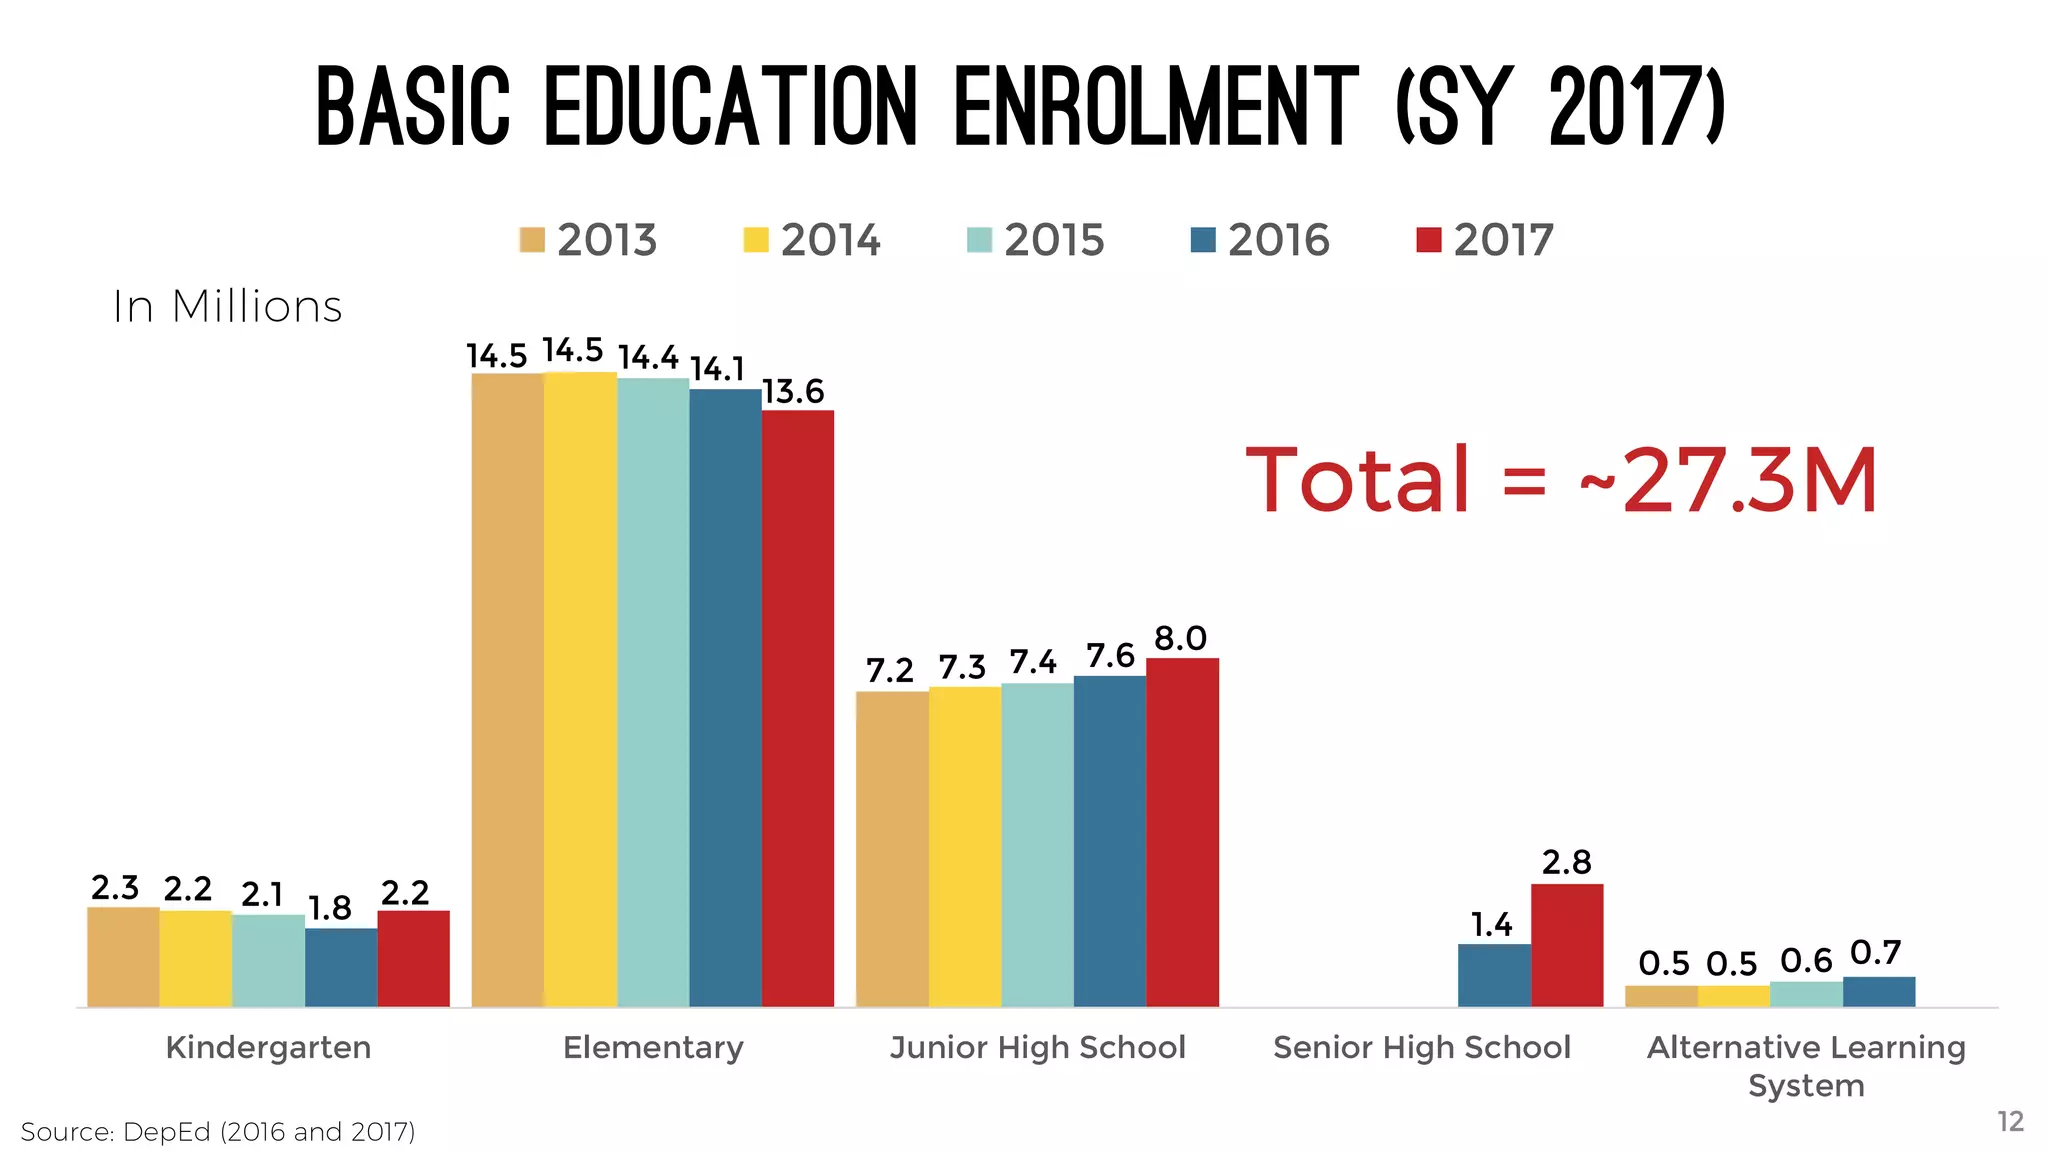
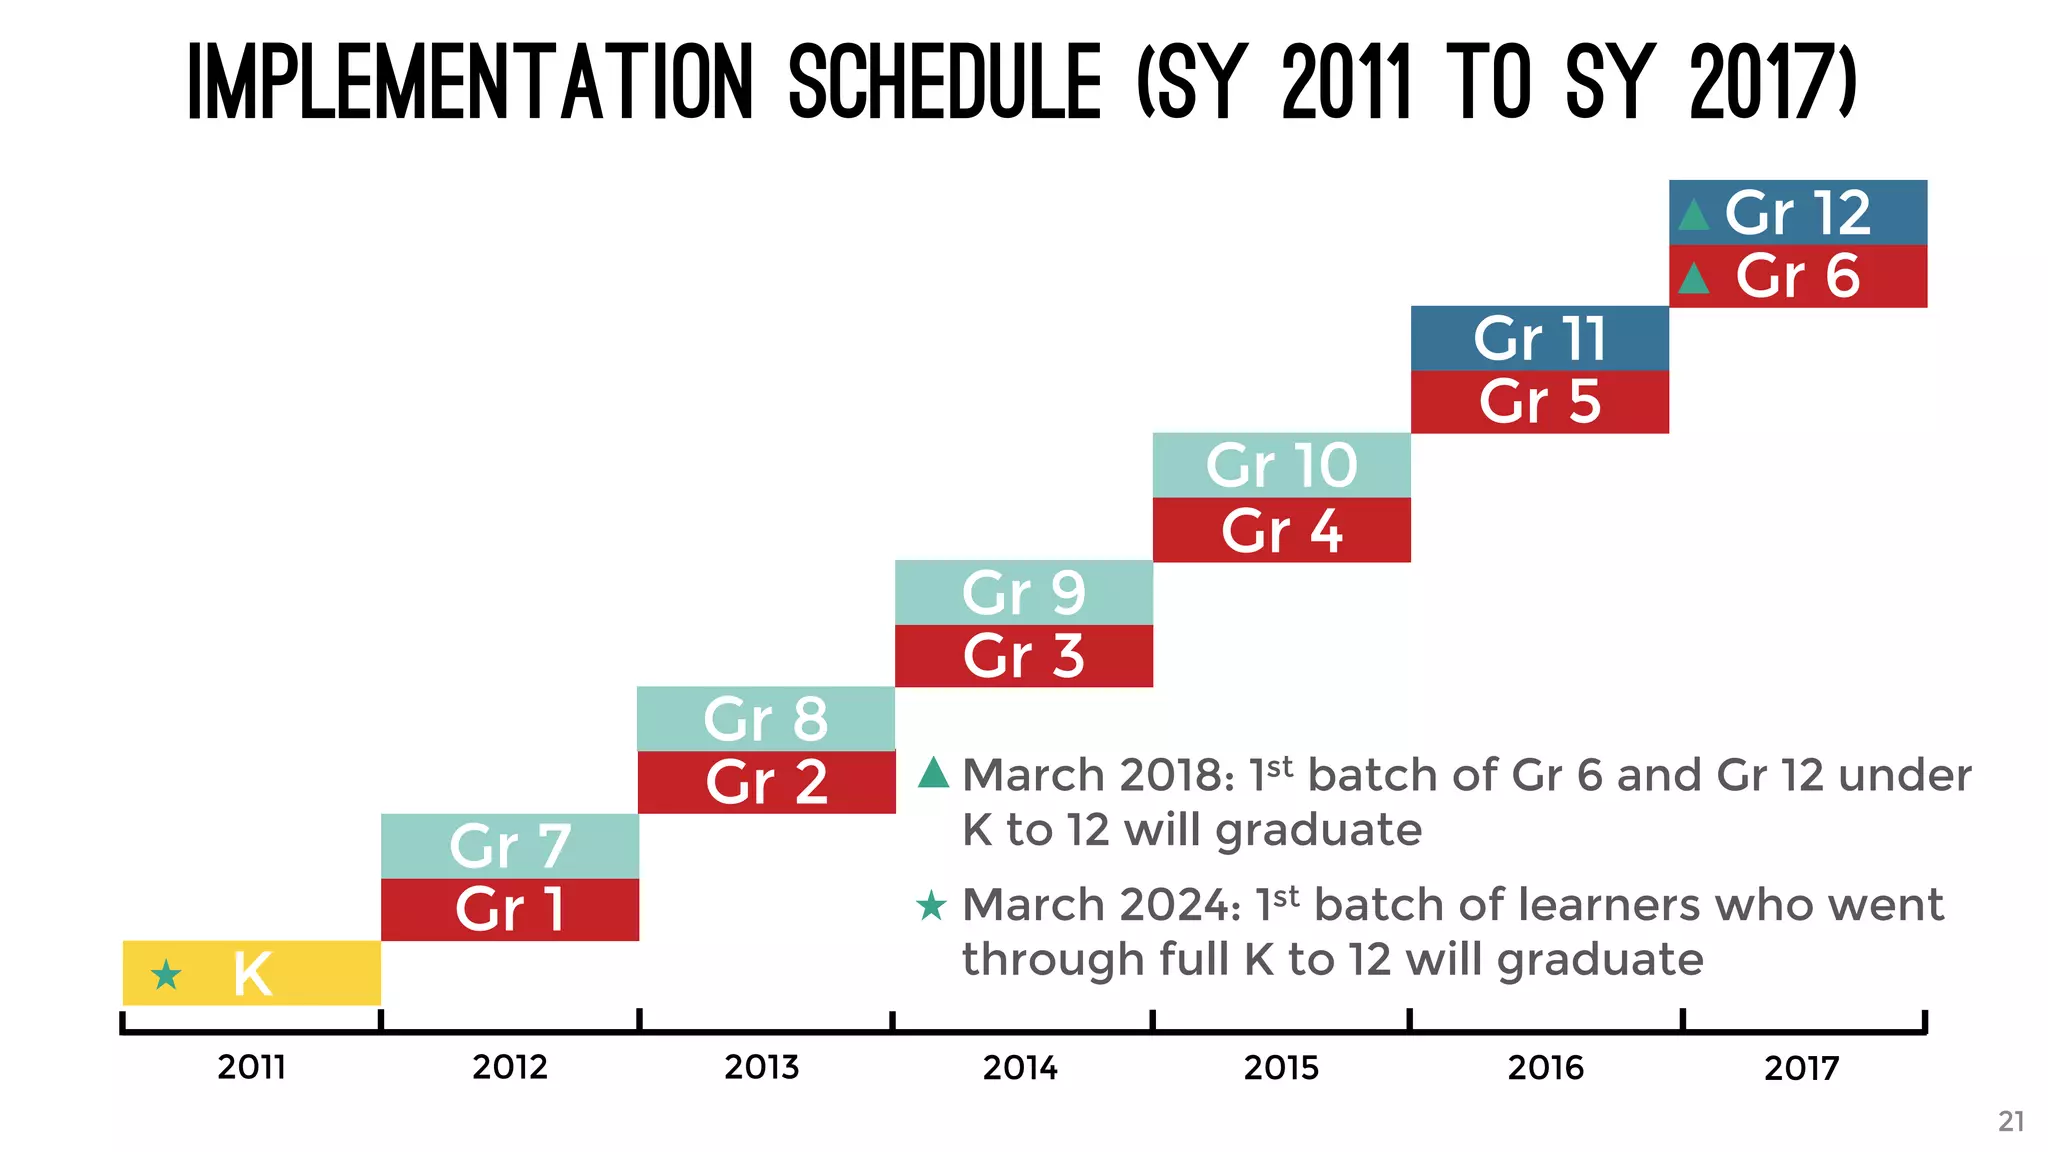
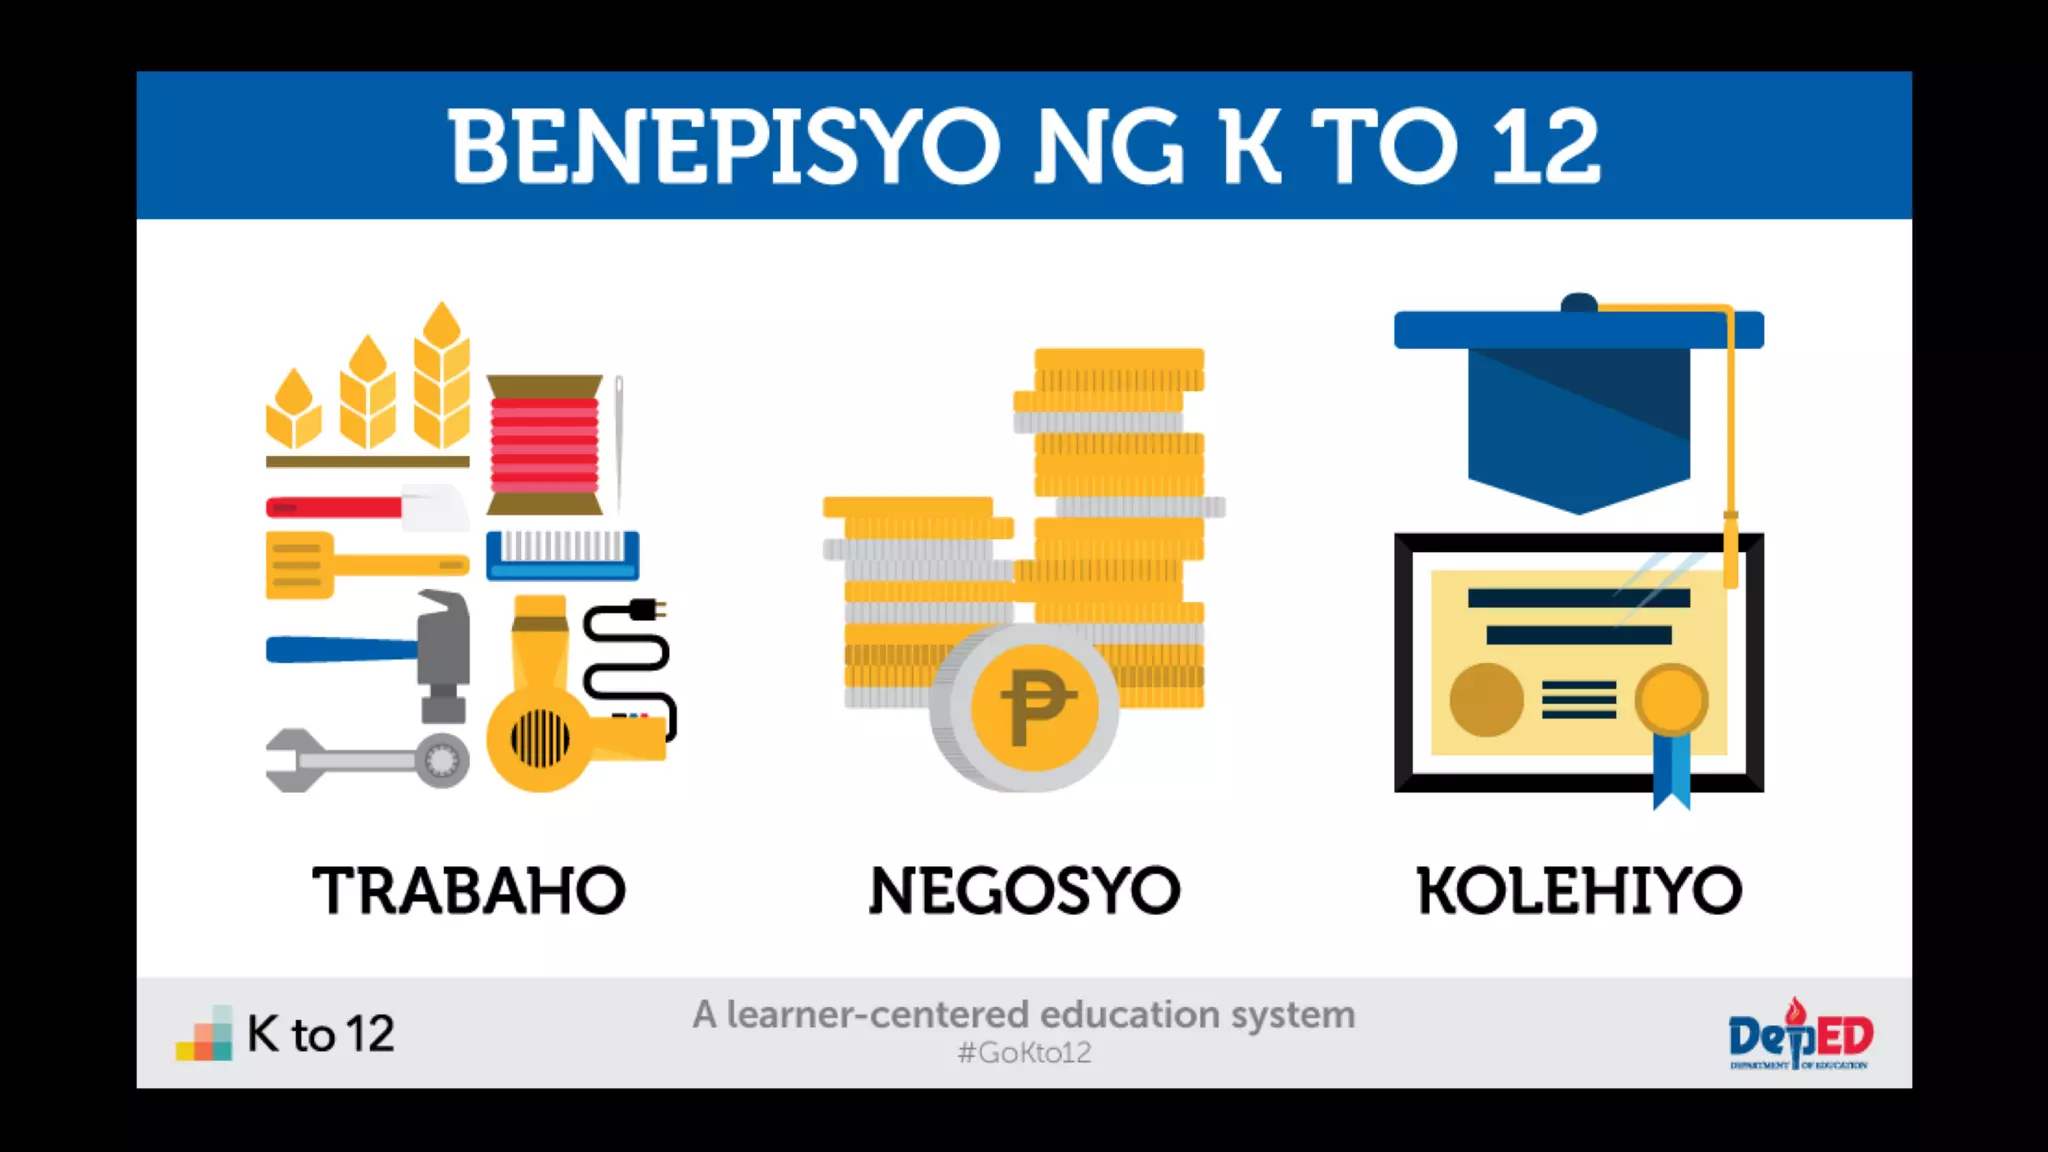
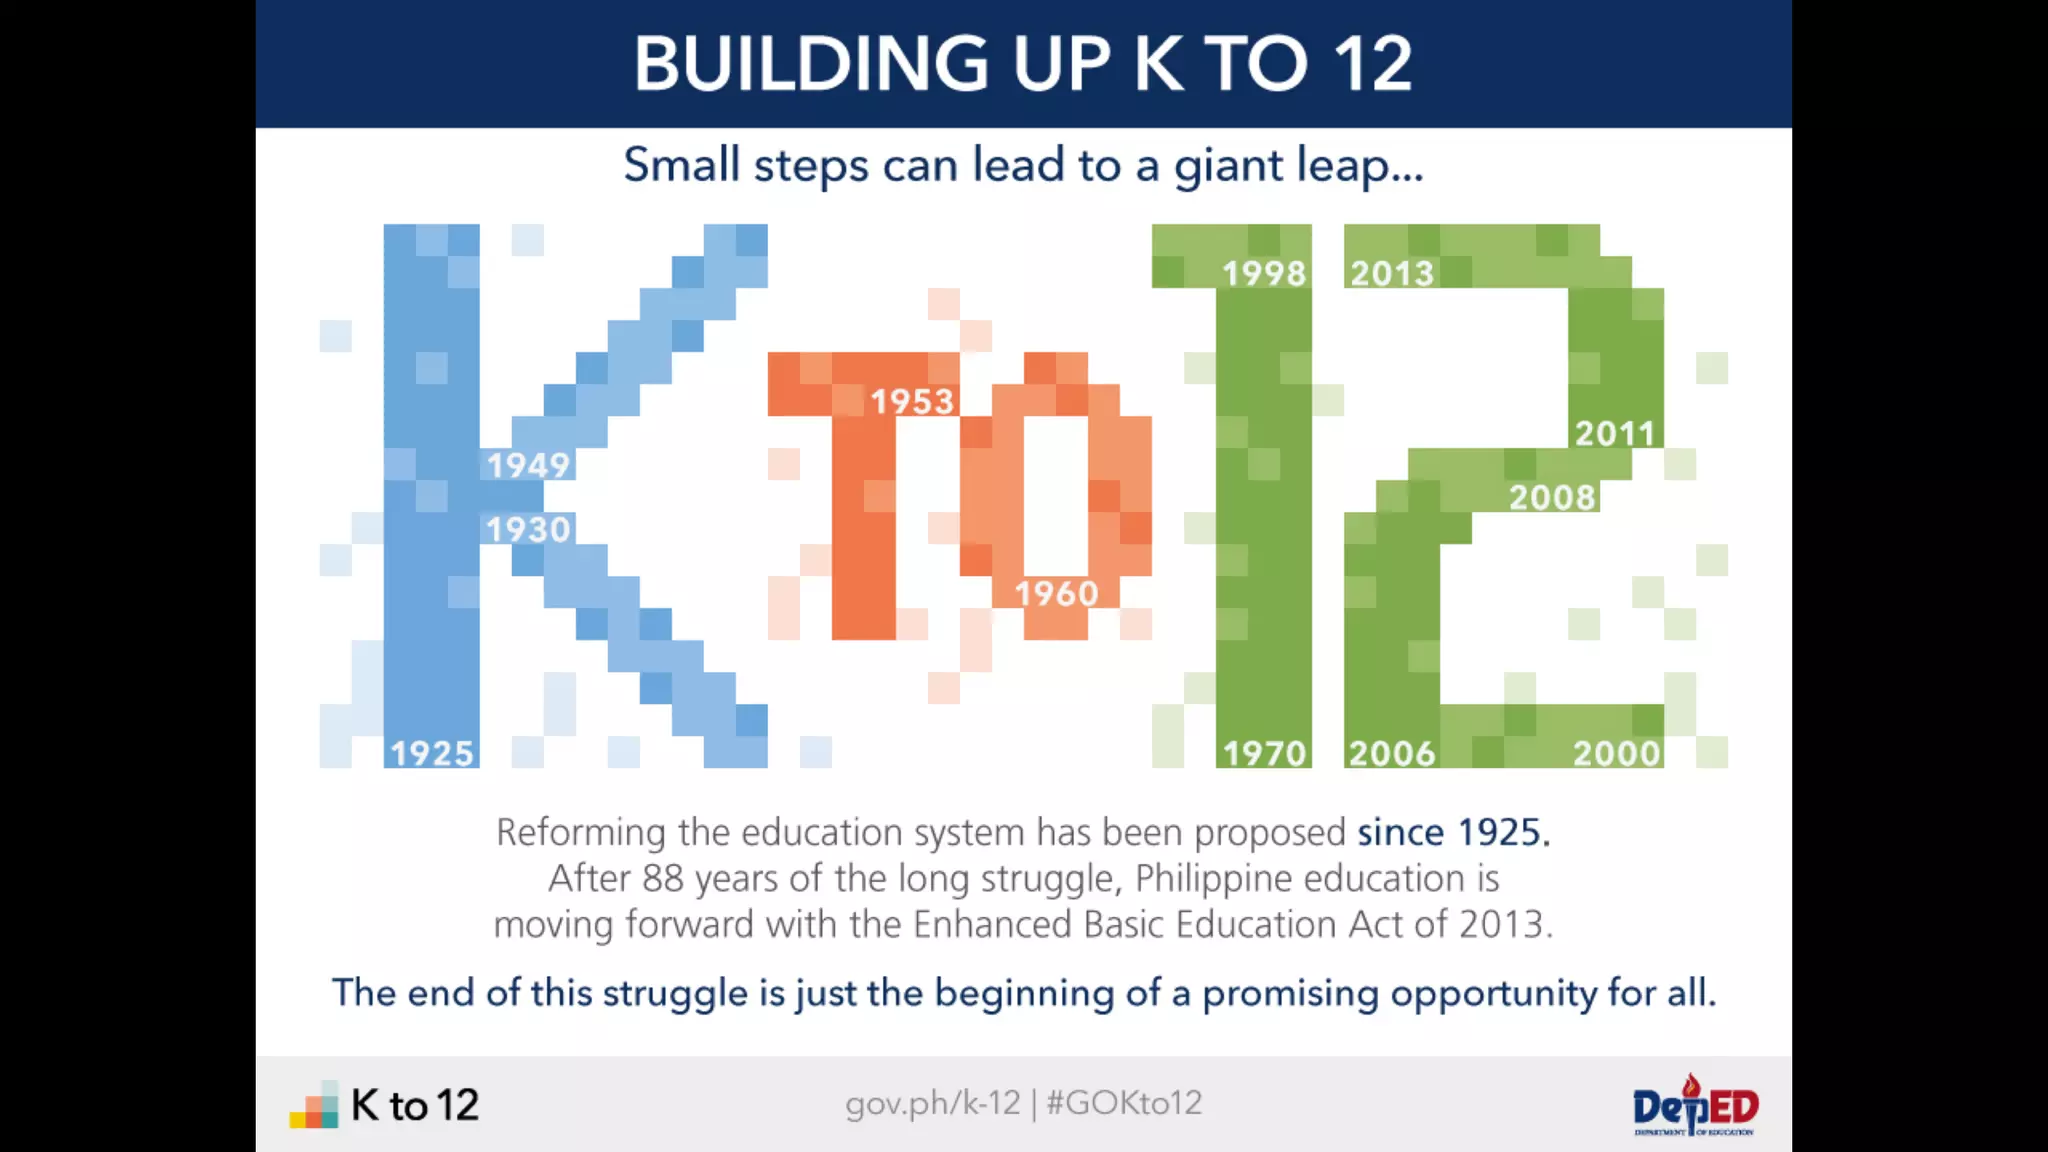
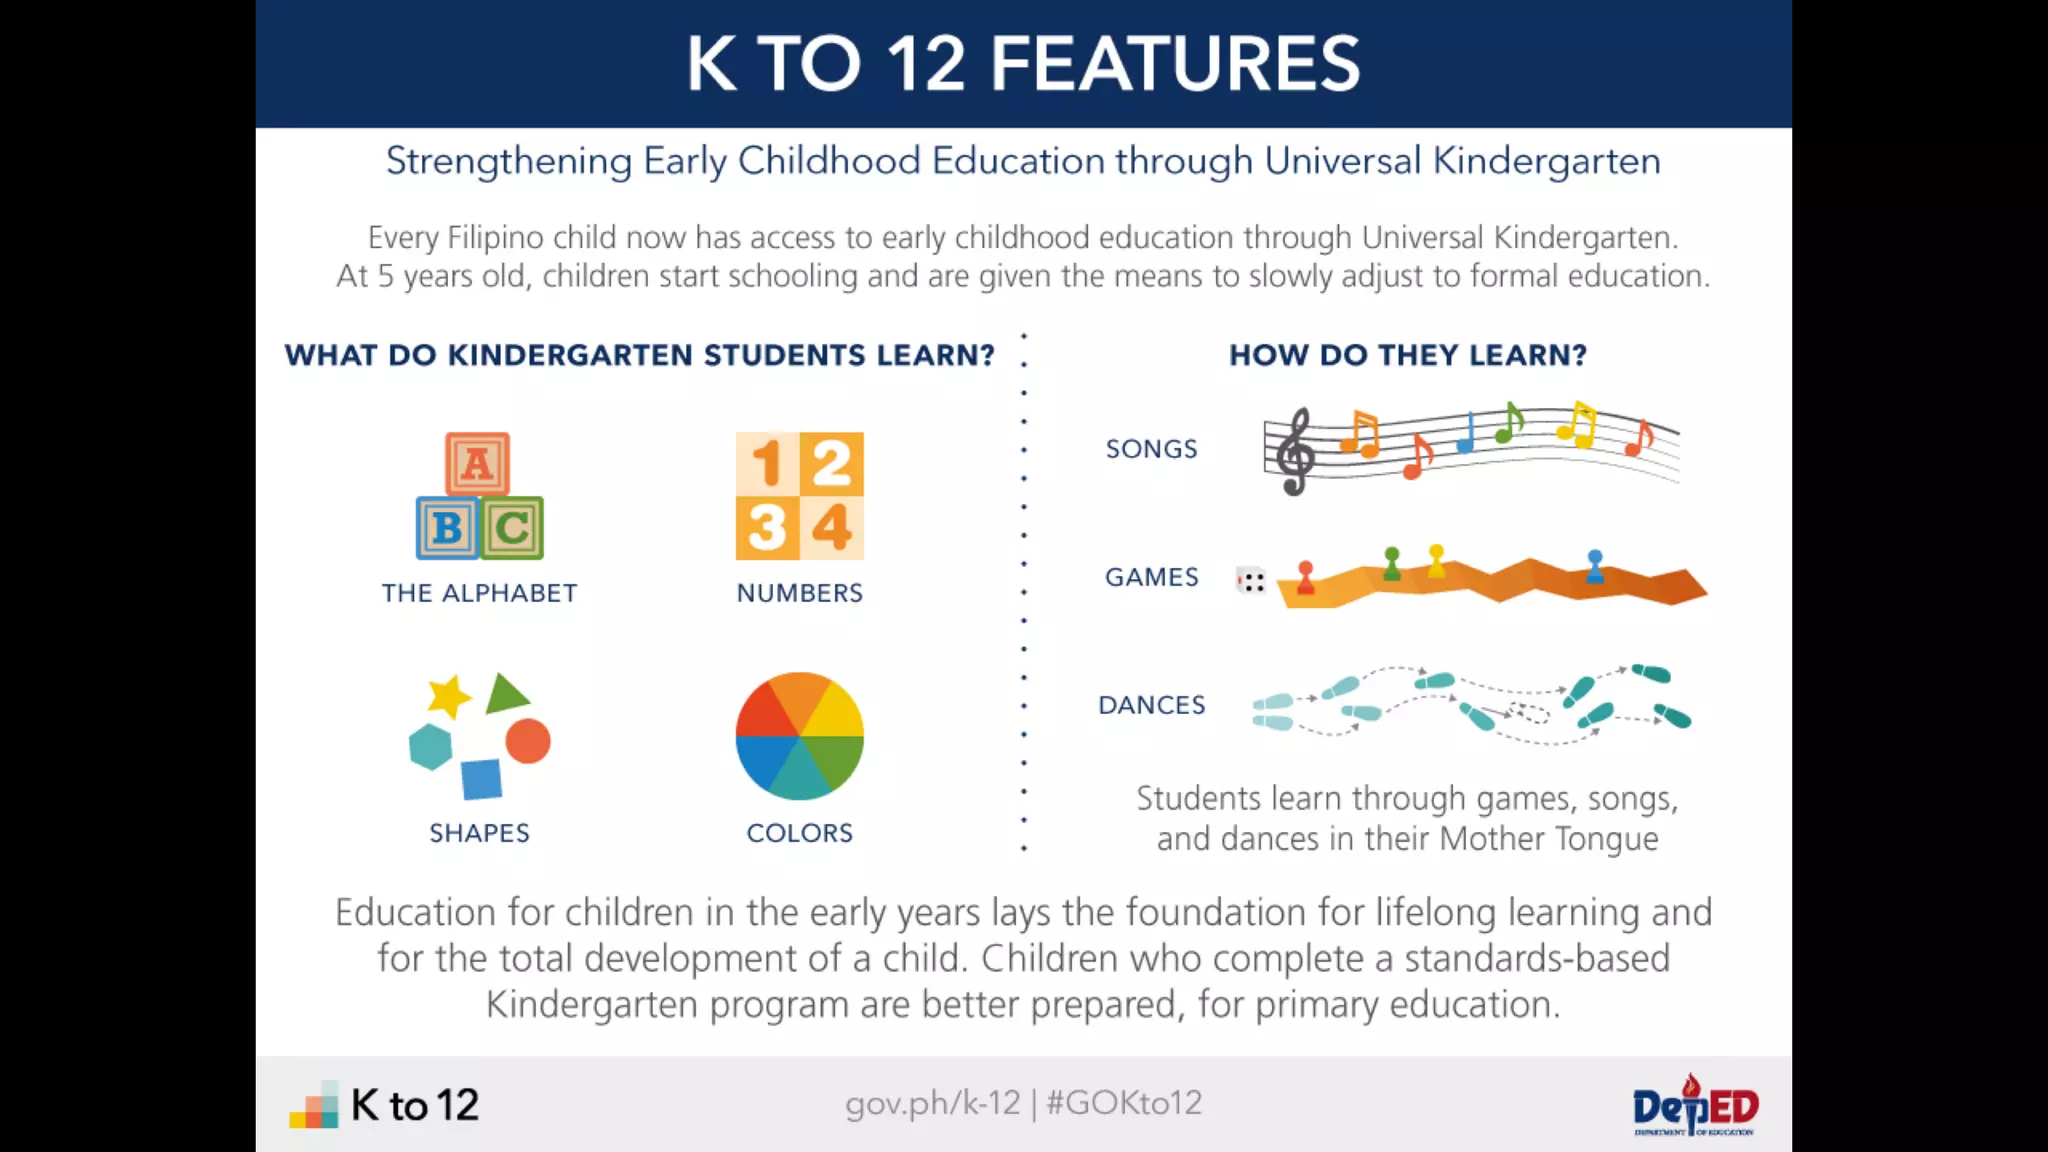
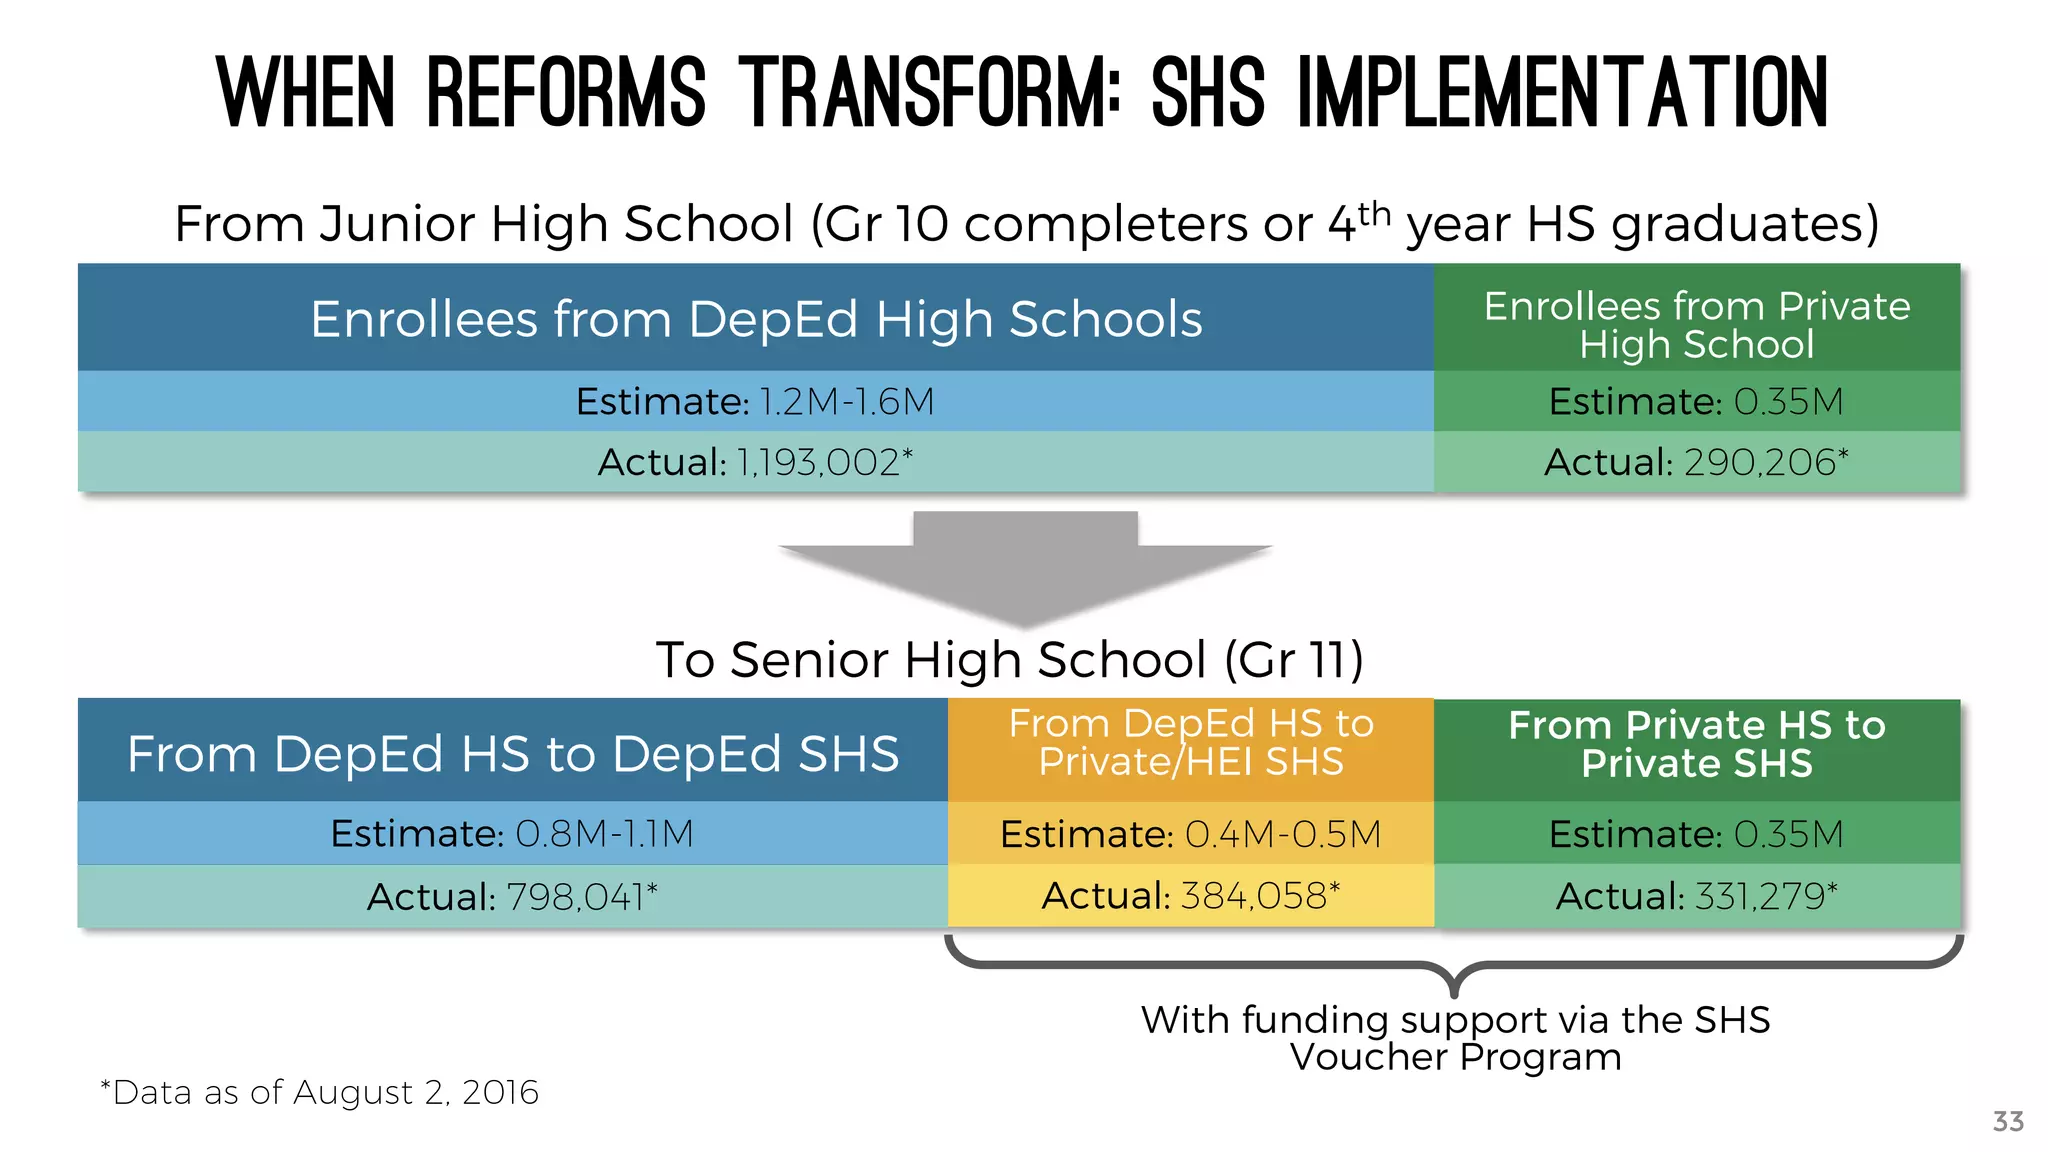
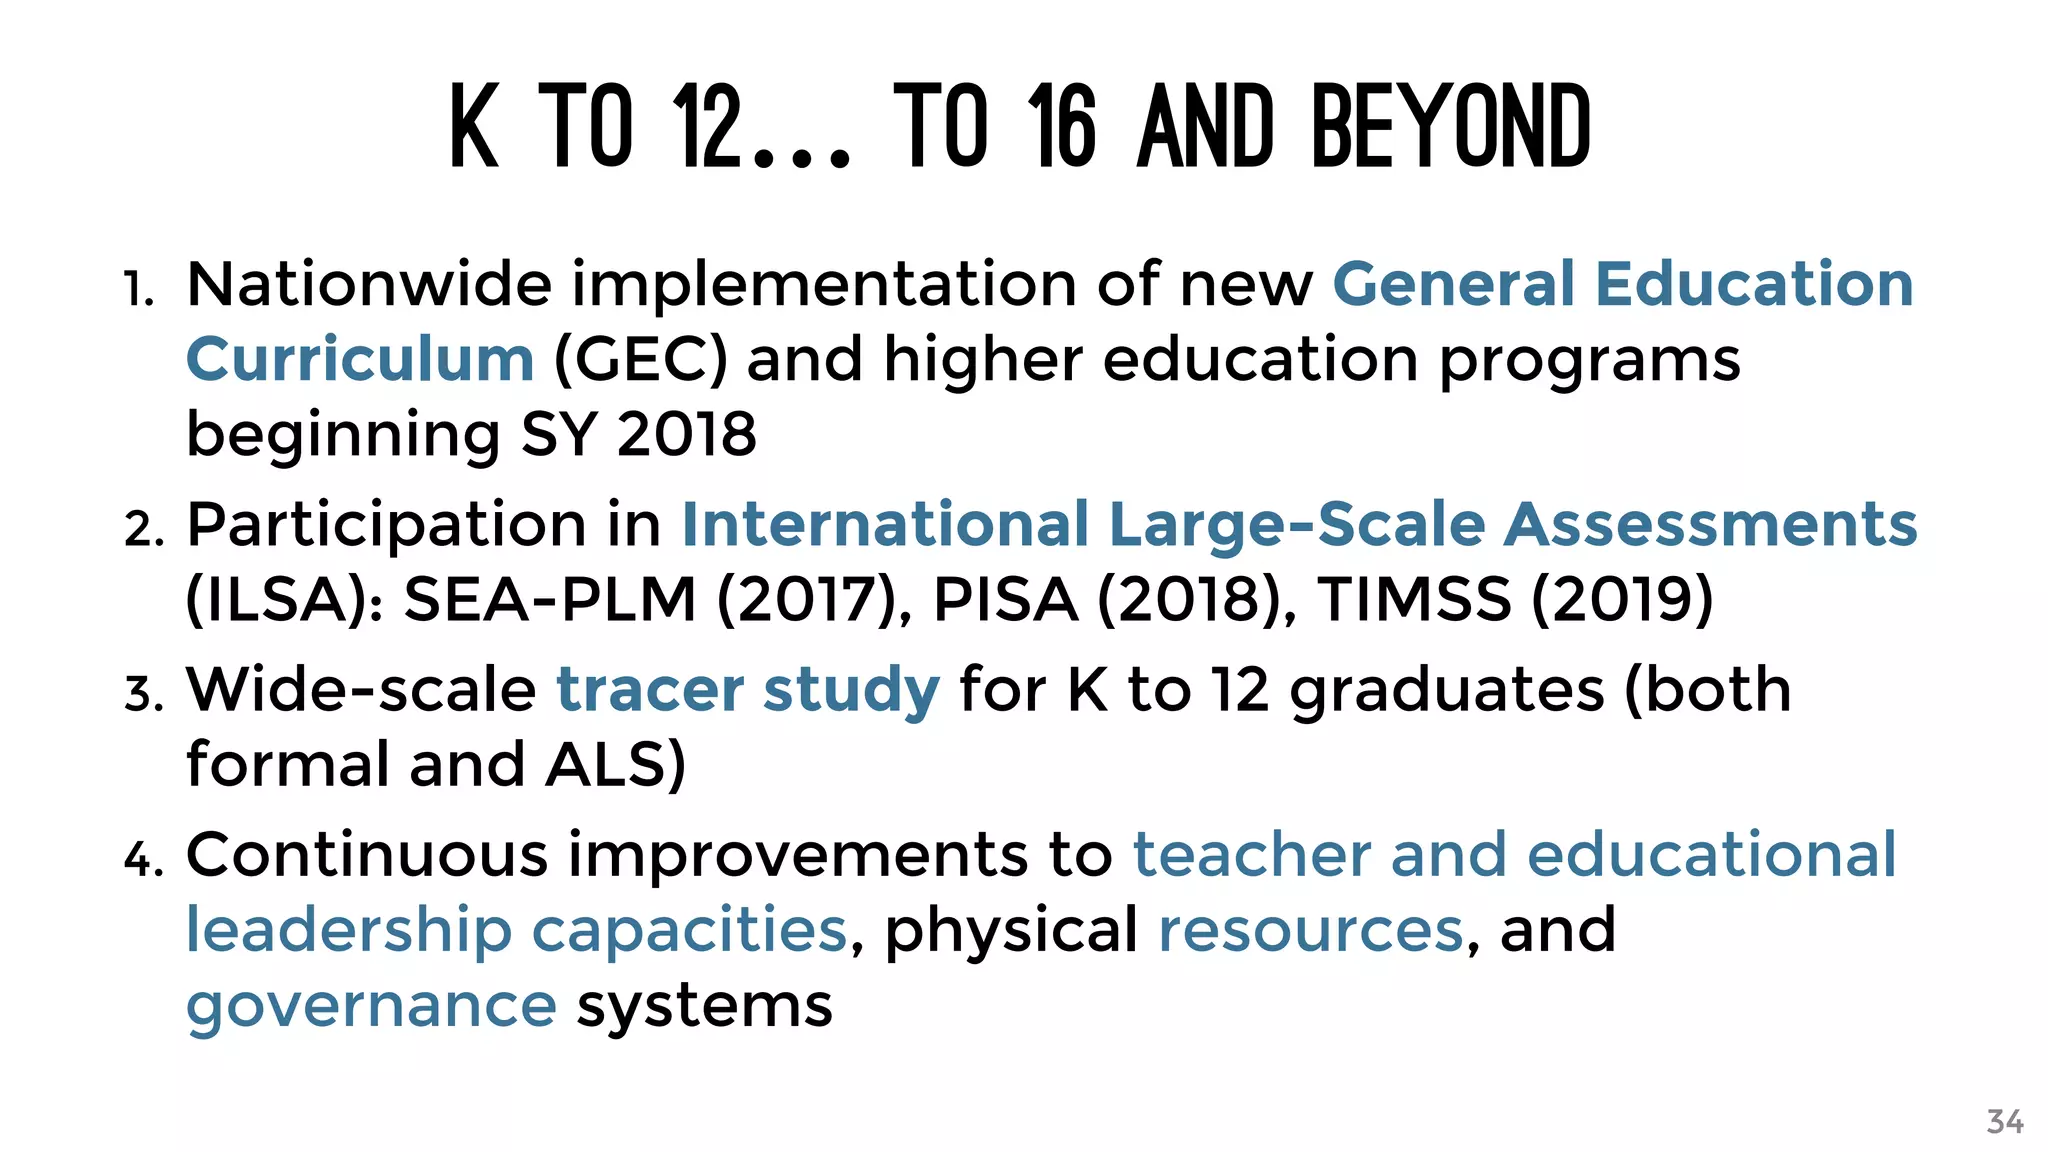

The document discusses the K to 12 education reform program in the Philippines, focusing on improving access to quality education and promoting lifelong learning for all. It includes statistics on enrollment, labor force data, literacy rates, and skills needed in the job market, along with budget allocations for education. The implications of these reforms aim to equip learners with essential skills and prepare them for future educational and job opportunities.


