Downloaded 109 times
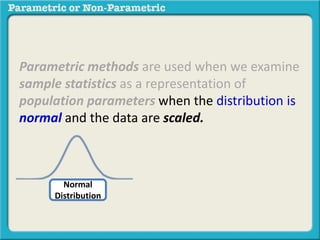
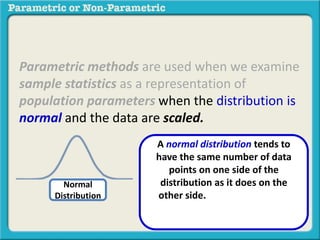
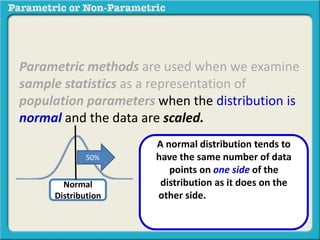
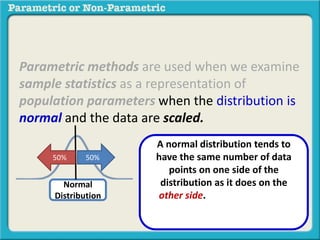
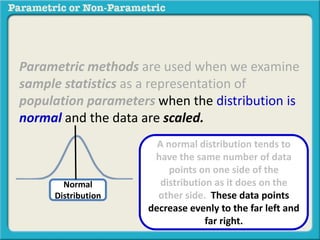
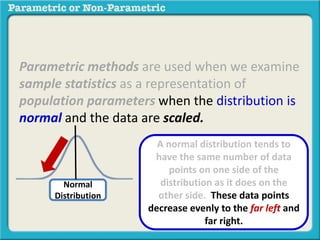
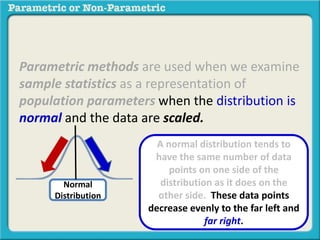
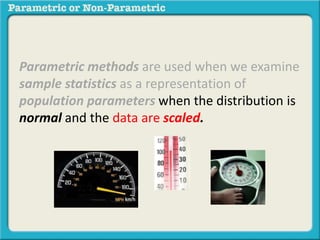
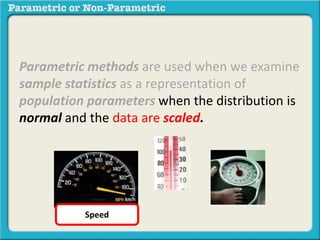
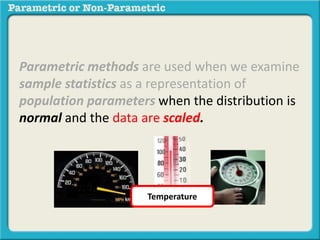
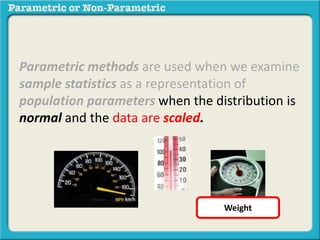
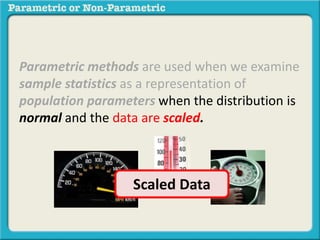
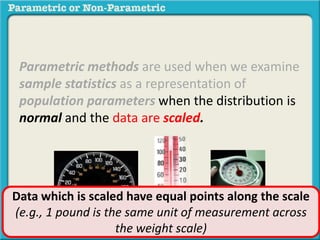


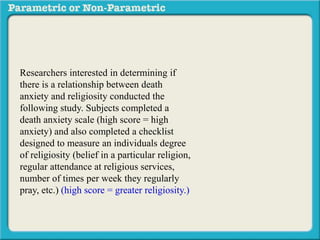

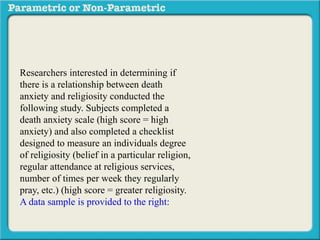
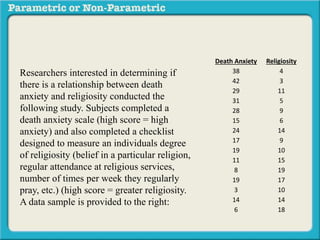
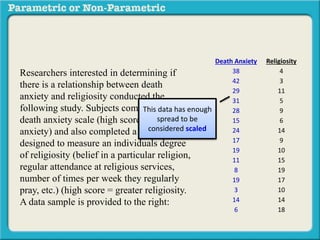
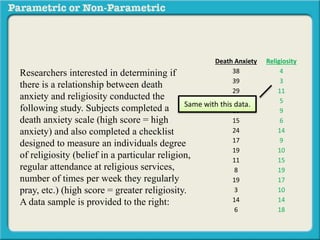
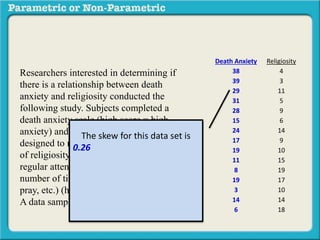
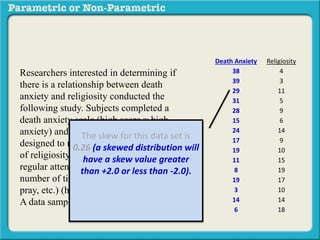
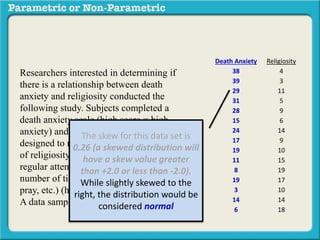
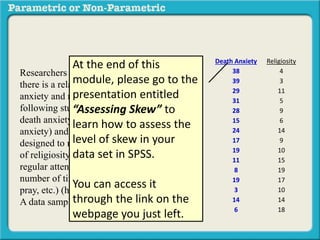
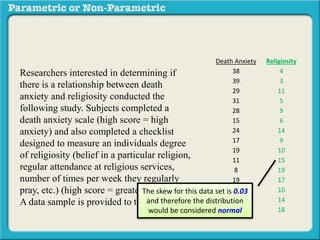
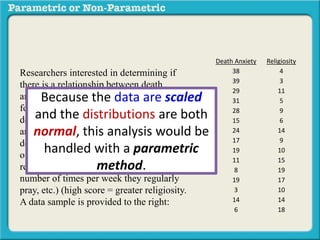
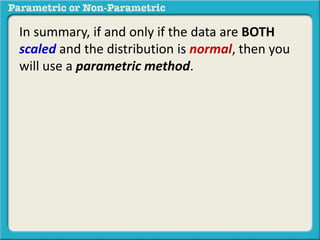
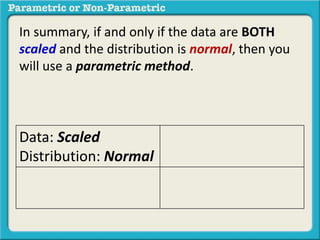
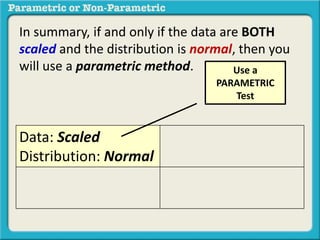
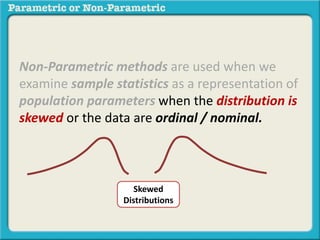
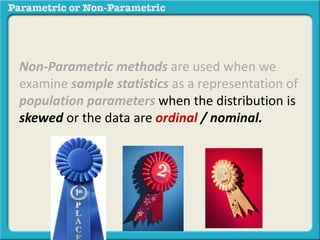
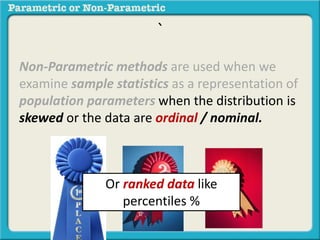


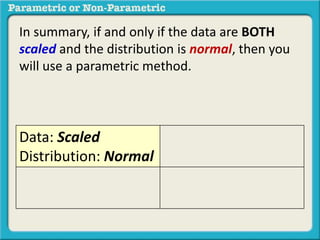
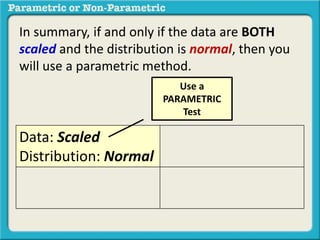
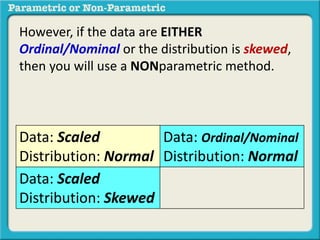
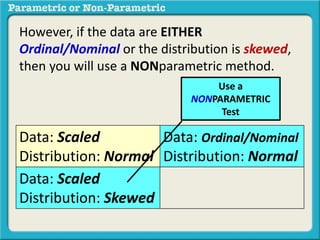
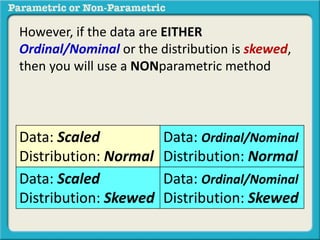
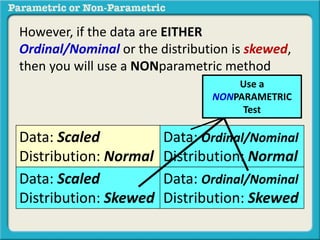

This document discusses when to use parametric vs non-parametric methods for analyzing relationships between variables. Parametric methods are appropriate when data is scaled, meaning points are equally spaced along the scale, and the distribution is normal. An example is provided of researchers examining the relationship between death anxiety and religiosity, where subjects completed scaled questionnaires and the data had a normal distribution. Therefore, a parametric method would be suitable for analysis.


