Download to read offline
![International Research Journal of Engineering and Technology (IRJET) e-ISSN: 2395-0056
Volume: 06 Issue: 06 | June 2019 www.irjet.net p-ISSN: 2395-0072
© 2019, IRJET | Impact Factor value: 7.211 | ISO 9001:2008 Certified Journal | Page 695
Water Quality Monitoring using IoT
Bharati Sengupta1, Soham Sawant2, Mayuresh Dhanawade3, Shubham Bhosale4, Mrs. Anushree
Prabhu5
1U.G. Student, Department of Electronics Engineering, V.E.S.I.T, Mumbai, Maharashtra, India
2U.G. Student, Department of Electronics Engineering, V.E.S.I.T, Mumbai, Maharashtra, India
3U.G. Student, Department of Electronics Engineering, V.E.S.I.T, Mumbai, Maharashtra, India
4U.G. Student, Department of Electronics Engineering, V.E.S.I.T, Mumbai, Maharashtra, India
5Assistant Professor, Department of Electronics Engineering, V.E.S.I.T, Mumbai, Maharashtra, India
---------------------------------------------------------------------***----------------------------------------------------------------------
Abstract- In today’s times, due to urbanization and pollution, it has become necessary to monitor and evaluate the quality
of water reaching our homes. Ensuring safe supply of drinking water has become a big challenge for the modern civilization.
Therefore, it has become crucial to capture data in real time instead of relying on traditional methods that involve collecting
water samples, testing and analysing them in laboratories which are not only costly but also time consuming and lack speedy
distribution of information to relevant authorities for making timely and informed decisions. In this paper, we propose a low
cost system for real time water quality monitoring and controlling using IoT. This system consists of various sensors such as
the pH sensor, turbidity sensor and temperature sensor which are interfaced with Raspberry Pi through Analog-to-Digital
converter (ADC). Based on the data collected by the sensors and processed by the Raspberry Pi, the relay mechanism directs
the solenoid valve to either continue or stop the flow of water from the overhead tank to houses. This entire process takes
place automatically without human intervention thus saving the time to handle the situation manually.
Keywords: Water Quality, pH Sensor, Turbidity Sensor, Temperature Sensor, ADC, Raspberry Pi, Internet of
Things, Drinking Water
1. INTRODUCTION
We consume water every day. It is an essential part of our lives. Therefore, water should be checked now and then. Since
water has a direct effect on life on earth; it has become crucial to check whether the water is in a good condition to use.
Checking the standard of water requires a great deal of hard work. Since water dissolves most of the materials that exist
on Earth, it is very difficult to determine the amount of the matter mixed in it. Water being a universal solvent varies from
place to place, depending on the condition of the source of water and the treatment it receives. The WHO (World Health
Organization) estimated that, in India, around 77 million people are suffering due to not having access to safe drinking
water. In fact, 21% of diseases in India are related to unsafe drinking water. Also, more than 1600 deaths alone are caused
due to diarrhoea in India daily.[2] Therefore, it has become necessary, with the evolving technology, to devise a quick and
efficient method to determine the quality of water.
In order to ensure the safe supply of the drinking water the quality needs to be monitored in real time. Our project focuses
on monitoring factors such as the pH value, turbidity and temperature of water which can be verified on a daily basis. The
normal method of challenging Turbidity and pH is to collect samples manually and send them to laboratory for a water
quality check. However, it has been seen that the samples are unable to reach the water quality examining in real time. We
propose a low cost system for real time water quality monitoring and controlling using IoT. The system consists of physio-
chemical sensors which can measure the physical and chemical parameters of the water such as Temperature, Turbidity,
pH and Flow. First, water contaminants are detected by these sensors. Then the data sensed by the sensors are converted
to a digital format using an ADC and sent to a Raspberry Pi module. The sensor values are processed by the Raspberry Pi
module and sent to cloud. Finally the sensed values are visible on the cloud via cloud computing. Also, according to the
sensor values, the flow of water in the pipeline can be controlled.
There are a lot of other parameters which can be found in water, but these three parameters turbidity, pH and
temperature are crucial in determining the quality. These parameters are considered the main parameters for water
quality testing. As a whole, this project contributes to determining the quality of water in a convenient, compact and user-
friendly method.](https://image.slidesharecdn.com/irjet-v6i6208-191116041458/75/IRJET-Water-Quality-Monitoring-using-IoT-1-2048.jpg)
![International Research Journal of Engineering and Technology (IRJET) e-ISSN: 2395-0056
Volume: 06 Issue: 06 | June 2019 www.irjet.net p-ISSN: 2395-0072
© 2019, IRJET | Impact Factor value: 7.211 | ISO 9001:2008 Certified Journal | Page 696
2. INTERNET OF THINGS
The Internet of Things, or "IoT" for short, is the extension of Internet connectivity beyond computers and smartphones to
a whole range of other things, processes and environments such as physical devices and everyday objects. Embedded with
electronics, Internet connectivity and other forms of hardware such as sensors, these devices can communicate and
interact with others over the Internet, and can be remotely monitored & controlled.[3] IoT has been heralded as one of the
major developments to be realized throughout the Internet portfolio of technologies.
The idea of a network of smart devices was discussed as early as 1982, with a redesigned Coke vending machine at
Carnegie Mellon University, Pittsburgh becoming the first Internet-connected device able to report its inventory. It could
also tell whether recently loaded drinks were cold or not. Today there are 26.6 billion IoT connected devices in the world
and it is estimated that there will be 75.4 billion devices by the year 2025. The global market value of IoT is projected to
reach $7.1 trillion by 2020.[4]
IoT has its applications in a large number of areas such as consumer applications like smart homes, wearable technology
and connected vehicles, commercial applications like medical and healthcare and industrial applications like
manufacturing, agriculture, energy management and environmental monitoring.
In proposing system we employ cloud computing technique for monitoring sensor values on the Internet. Cloud computing
provides the access to applications as utilities, over the Internet.
3. LITERATURE REVIEW
Water is a liquid that is colourless, odourless and flavourless. An Italian scientist “Stanislao Cannizzarro” defined the
chemical formula for the water molecule. The molecular formula for water is H2O. Because of its ability to dissolve most of
the substances, water is also called the Universal Solvent. Even though pure water doesn’t conduct electricity, the
substances that mix up with water make it possible to conduct electricity.[5] Volume of water changes with change in
temperature. The maximum density it can contract to is 1 g/cc at 4°C. If we further cool it, it expands. Water expands the
most at its freezing point. It has a larger volume when it is in liquid form, which explains why an ice cube floats in water or
other liquids. Maintaining the correct pH value and temperature of water is very essential for drinking water as well as for
water in aquatic bodies. A misbalance in the pH levels or temperature of the water can have severe consequences. Water
having pH levels too acidic or too basic is not fit for consumption. Bacteria multiply faster in water having a higher
temperature than standard room temperature. Warm water can hold a lesser amount of dissolved oxygen as compared to
atmospheric temperature water. So, maintaining the right temperature and pH levels of water is very necessary.
There is also a certain standard limit for the amount of turbidity present in water. Turbidity is a measure of the extent to
which the water loses its transparency due to the presence of suspended particulates. More the amount of suspended
solids in the water, murkier it seems and higher is the turbidity. If drinking water has a value of turbidity greater than the
permissible limit, the water is unfit for consumption.
According to the Bureau of Indian Standards (BIS)[6], specifications for potable water are:
● pH value: 6.5 to 8.5
● Turbidity: 1 NTU (Ideally)
5 NTU (Max.)
Change in temperature also has an effect on the pH value of water. Since pH is temperature dependant, the pH of water at
10°C may not be the same at 25°C. As the temperature of water increases, the pH value decreases i.e. making the water
more acidic. As we can see from Table-1, the pH values have very little variation in the acidic region as the temperature
increases but dramatic variations in the basic region.
pH Range Temperature
0°C 25°C 60°C
Acid 0.99 1.00 1.01
Neutral 7.47 7.00 6.51
Base 14.94 14.00 13.02
Table-1: Change in pH due to increase in temperature](https://image.slidesharecdn.com/irjet-v6i6208-191116041458/75/IRJET-Water-Quality-Monitoring-using-IoT-2-2048.jpg)
![International Research Journal of Engineering and Technology (IRJET) e-ISSN: 2395-0056
Volume: 06 Issue: 06 | June 2019 www.irjet.net p-ISSN: 2395-0072
© 2019, IRJET | Impact Factor value: 7.211 | ISO 9001:2008 Certified Journal | Page 697
There are many systems which use GPRS, Zigbee and TCP/IP protocol to transmit data to the analysing devices. Nikhil
Kedia has published a research paper entitled “Water Quality Monitoring for Rural Areas-A Sensor Cloud Based
Economical Project” which highlights water quality monitoring methods, embedded design and information dissipation
procedure, type of sensors which can be used & the role of government in rural areas. The paper also gives information on
how the idea can be implemented using the Sensor Cloud domain.[7] Zulhani Rasin and Mohd Rizal Abdullah have
developed a water quality monitoring system based on the Zigbee protocol. In the system the sensors are connected to a
single circuit which is connected to the Zigbee ZMN2405HP module. The receiver side Zigbee is connected to a computer
that shows the GUI of the network circuit.[8] Matthew Dunbabin, Alistair Grinham and James Udy have built a vehicle for
automated water quality monitoring. It is an Autonomous Surface Vehicle capable of navigating through complex internal
water storages and measuring a range of water quality parameters and greenhouse gas emissions. The 16 feet long solar
powered catamaran can collect this information throughout the water column whilst the vehicle is moving. The
vehicle has a GPS, compass, depth sensor, camera & laser scanner for avoiding obstacles & navigating smoothly through
water.[9] Kulkarni Amruta and Turkane Satish have developed a solar powered water quality monitoring system using the
concept of Wireless Sensor Network (WSN). In this system, a solar panel is used to power the WSN. The system is
composed of nodes and a base station where the node collects the data it receives from different wireless sensors. The
node is connected to the base station through the Zigbee technology that is powered by the solar panel. This is a low cost
system but if, due to environmental factors, the solar panel doesn’t charge then the system will stop working.[10] As we
can see, all the above mentioned systems have some or the other limitation. Also, none of the systems meet the goal of
real-time, low-cost continuous monitoring of water quality parameters. So, to overcome all these limitations, we propose a
low cost system for real time water quality monitoring and controlling using IoT.
4. METHODOLOGY
This section explains the complete block diagram of the proposed system. Also, it presents in detail the explanation of each
and every block. The overall block diagram of the proposed system is as shown in Fig-1. The block diagram consist various
sensors and other units connected to the Raspberry Pi controller.
The various sensors used for water quality assessment are pH Sensor, turbidity sensor and temperature sensor. Out of this
the pH sensor and turbidity sensor are analog sensors while the temperature sensor is a digital sensor. Raspberry Pi 3 B+
used in the proposed system accepts only digital inputs. Therefore the temperature sensor is connected directly to the
GPIO pins of the Raspberry Pi while the pH sensor and the turbidity sensor are connected to the Analog to Digital
Converter (ADC) to obtain digital output. This digital output is then given to the Raspberry Pi for further processing.
A pH sensor measures the hydrogen ion activity in a liquid. At the tip of the pH probe is a glass membrane that permits
hydrogen ions from the liquid being measured to diffuse into the outer layer of the glass, while larger ions remain in the
solution. The difference in the concentration of hydrogen ions outside and inside the glass membrane creates a very small
current. This current is proportional to the concentration of hydrogen ions present in the liquid being measured. If the
concentration of hydrogen ions inside the glass membrane is lesser than hydrogen ions outside it, the solution is an acid.
Otherwise the solution is a base.
Fig-1: Block Diagram](https://image.slidesharecdn.com/irjet-v6i6208-191116041458/75/IRJET-Water-Quality-Monitoring-using-IoT-3-2048.jpg)
![International Research Journal of Engineering and Technology (IRJET) e-ISSN: 2395-0056
Volume: 06 Issue: 06 | June 2019 www.irjet.net p-ISSN: 2395-0072
© 2019, IRJET | Impact Factor value: 7.211 | ISO 9001:2008 Certified Journal | Page 700
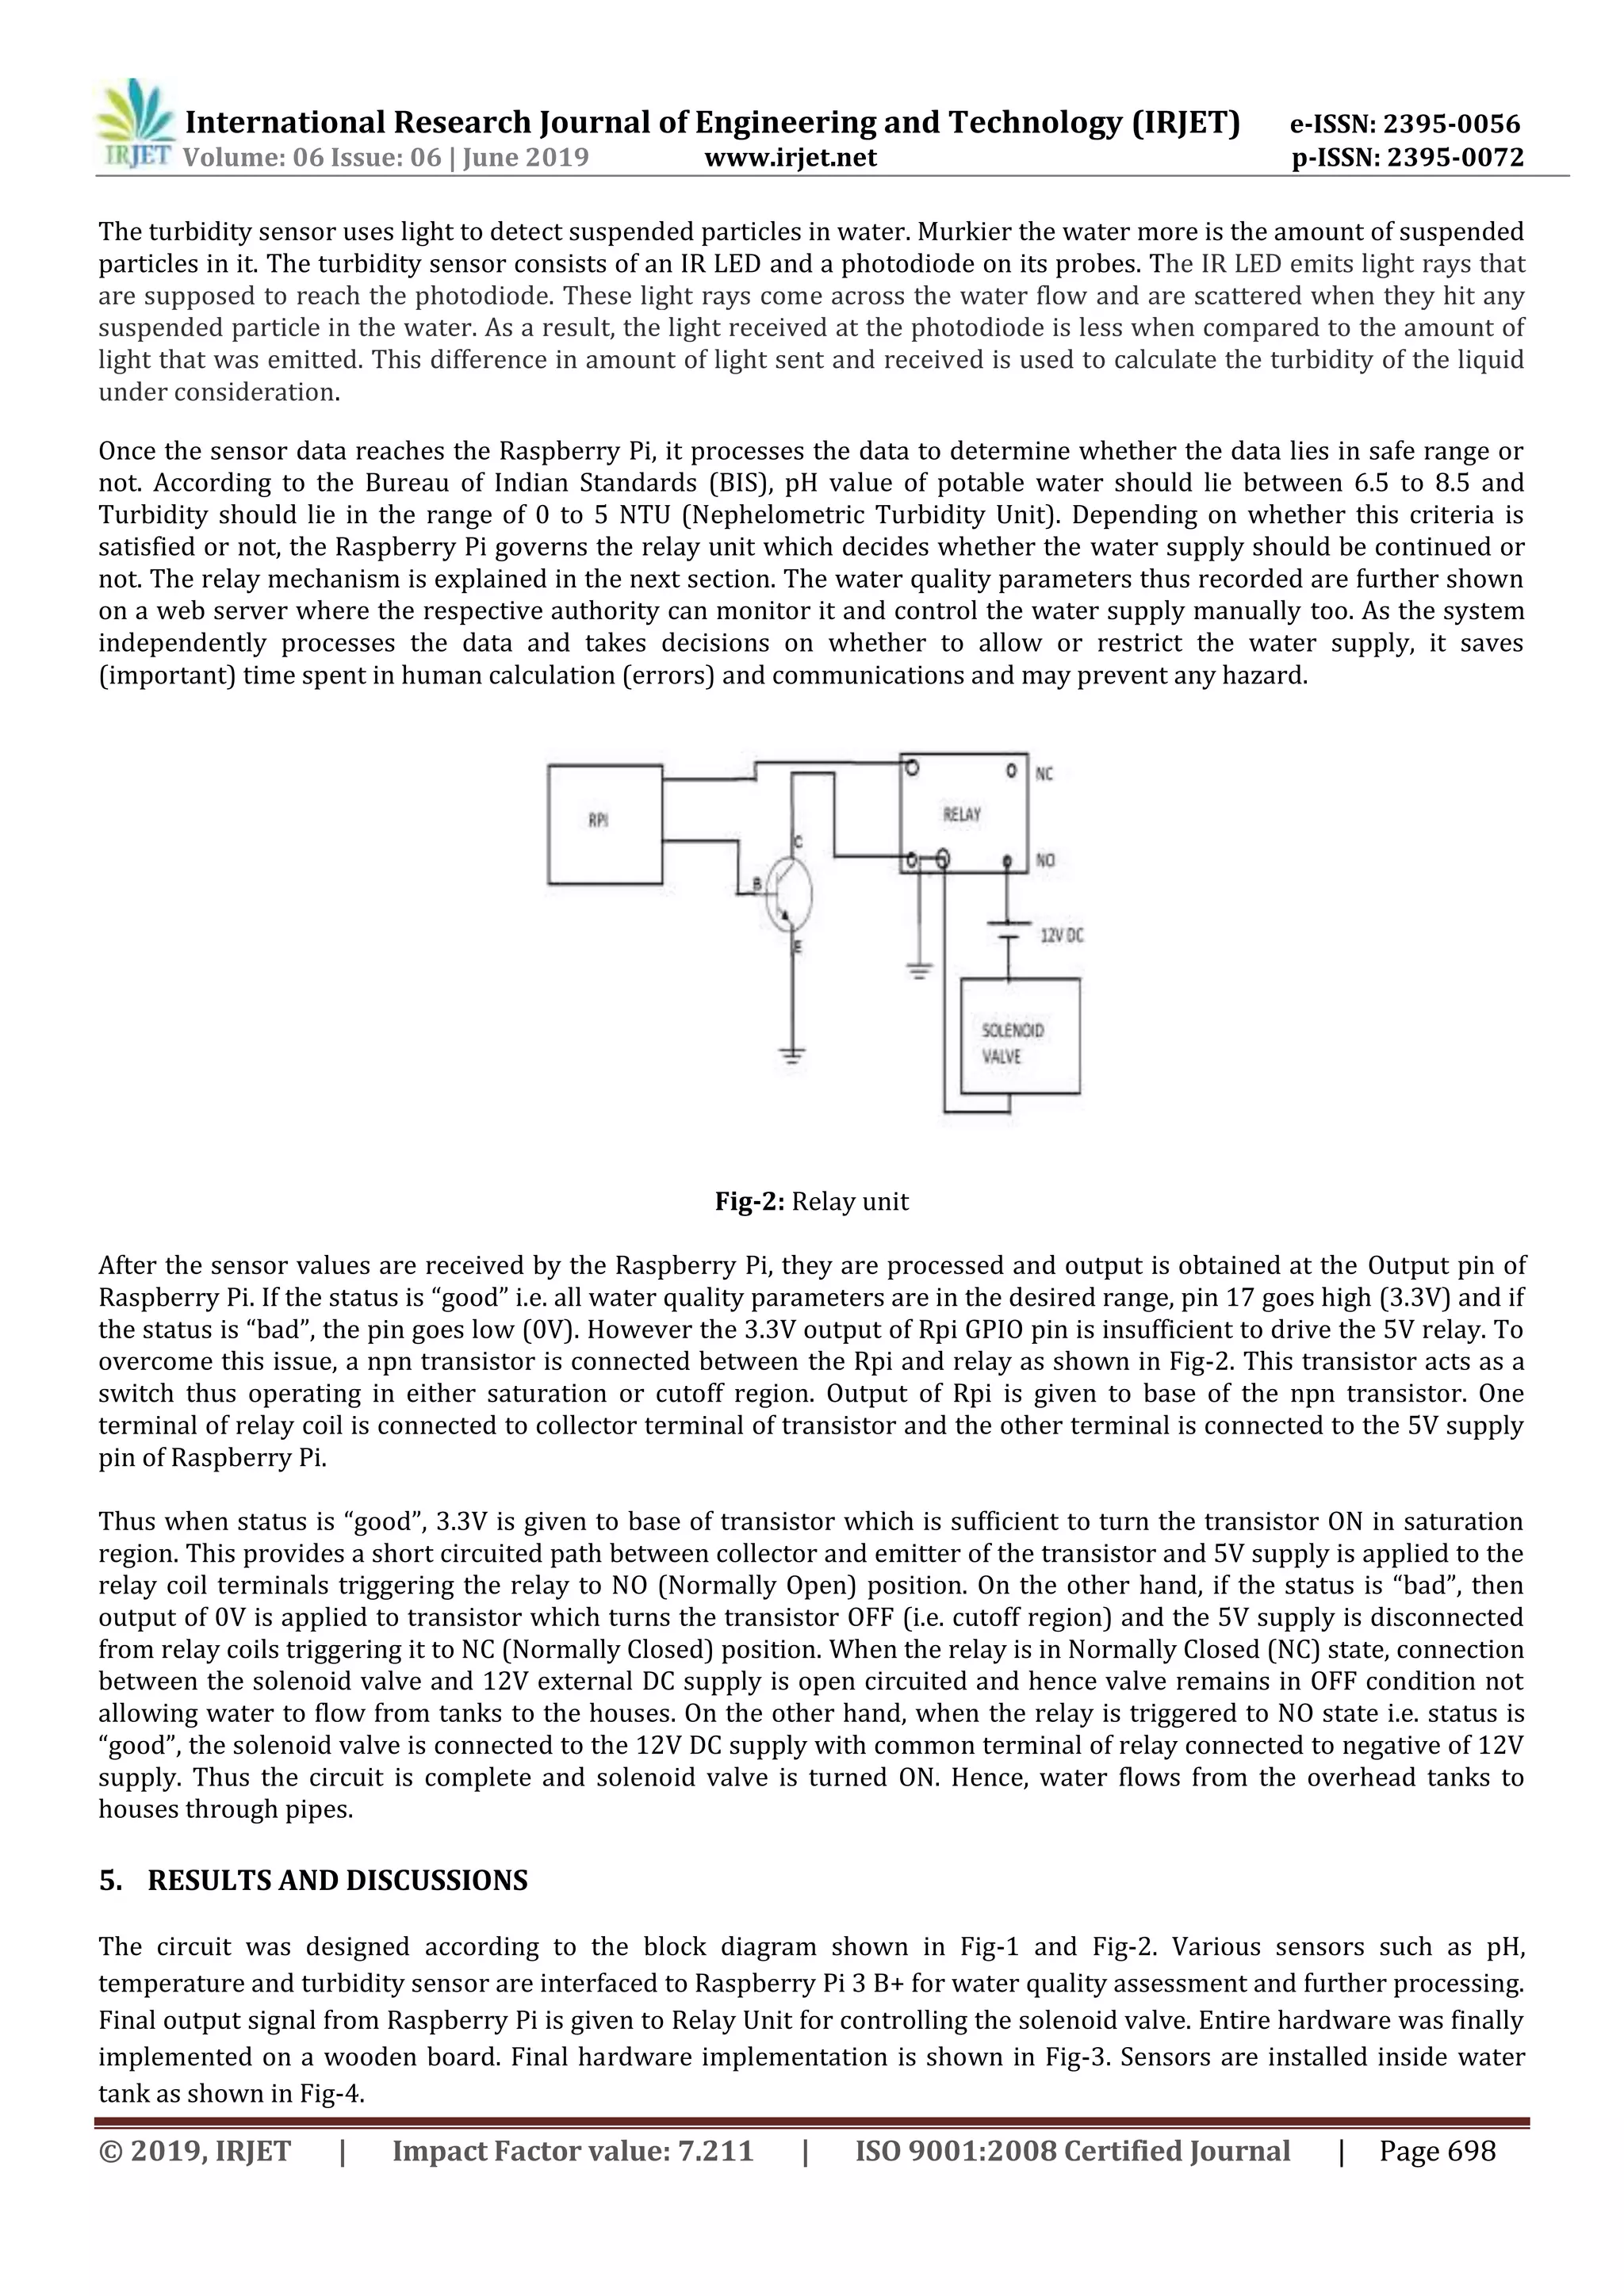
A water sample was taken from a normal water tank. Sensors were placed inside the water tank as shown in Fig-4 and the
output was observed on the computer screen. As seen from the results obtained in Table-2, values of pH, Temperature and
Turbidity are in the range which is considered safe for drinking. Hence, overall status of the water sample is good. This will
allow water to flow through the solenoid valve to the houses.
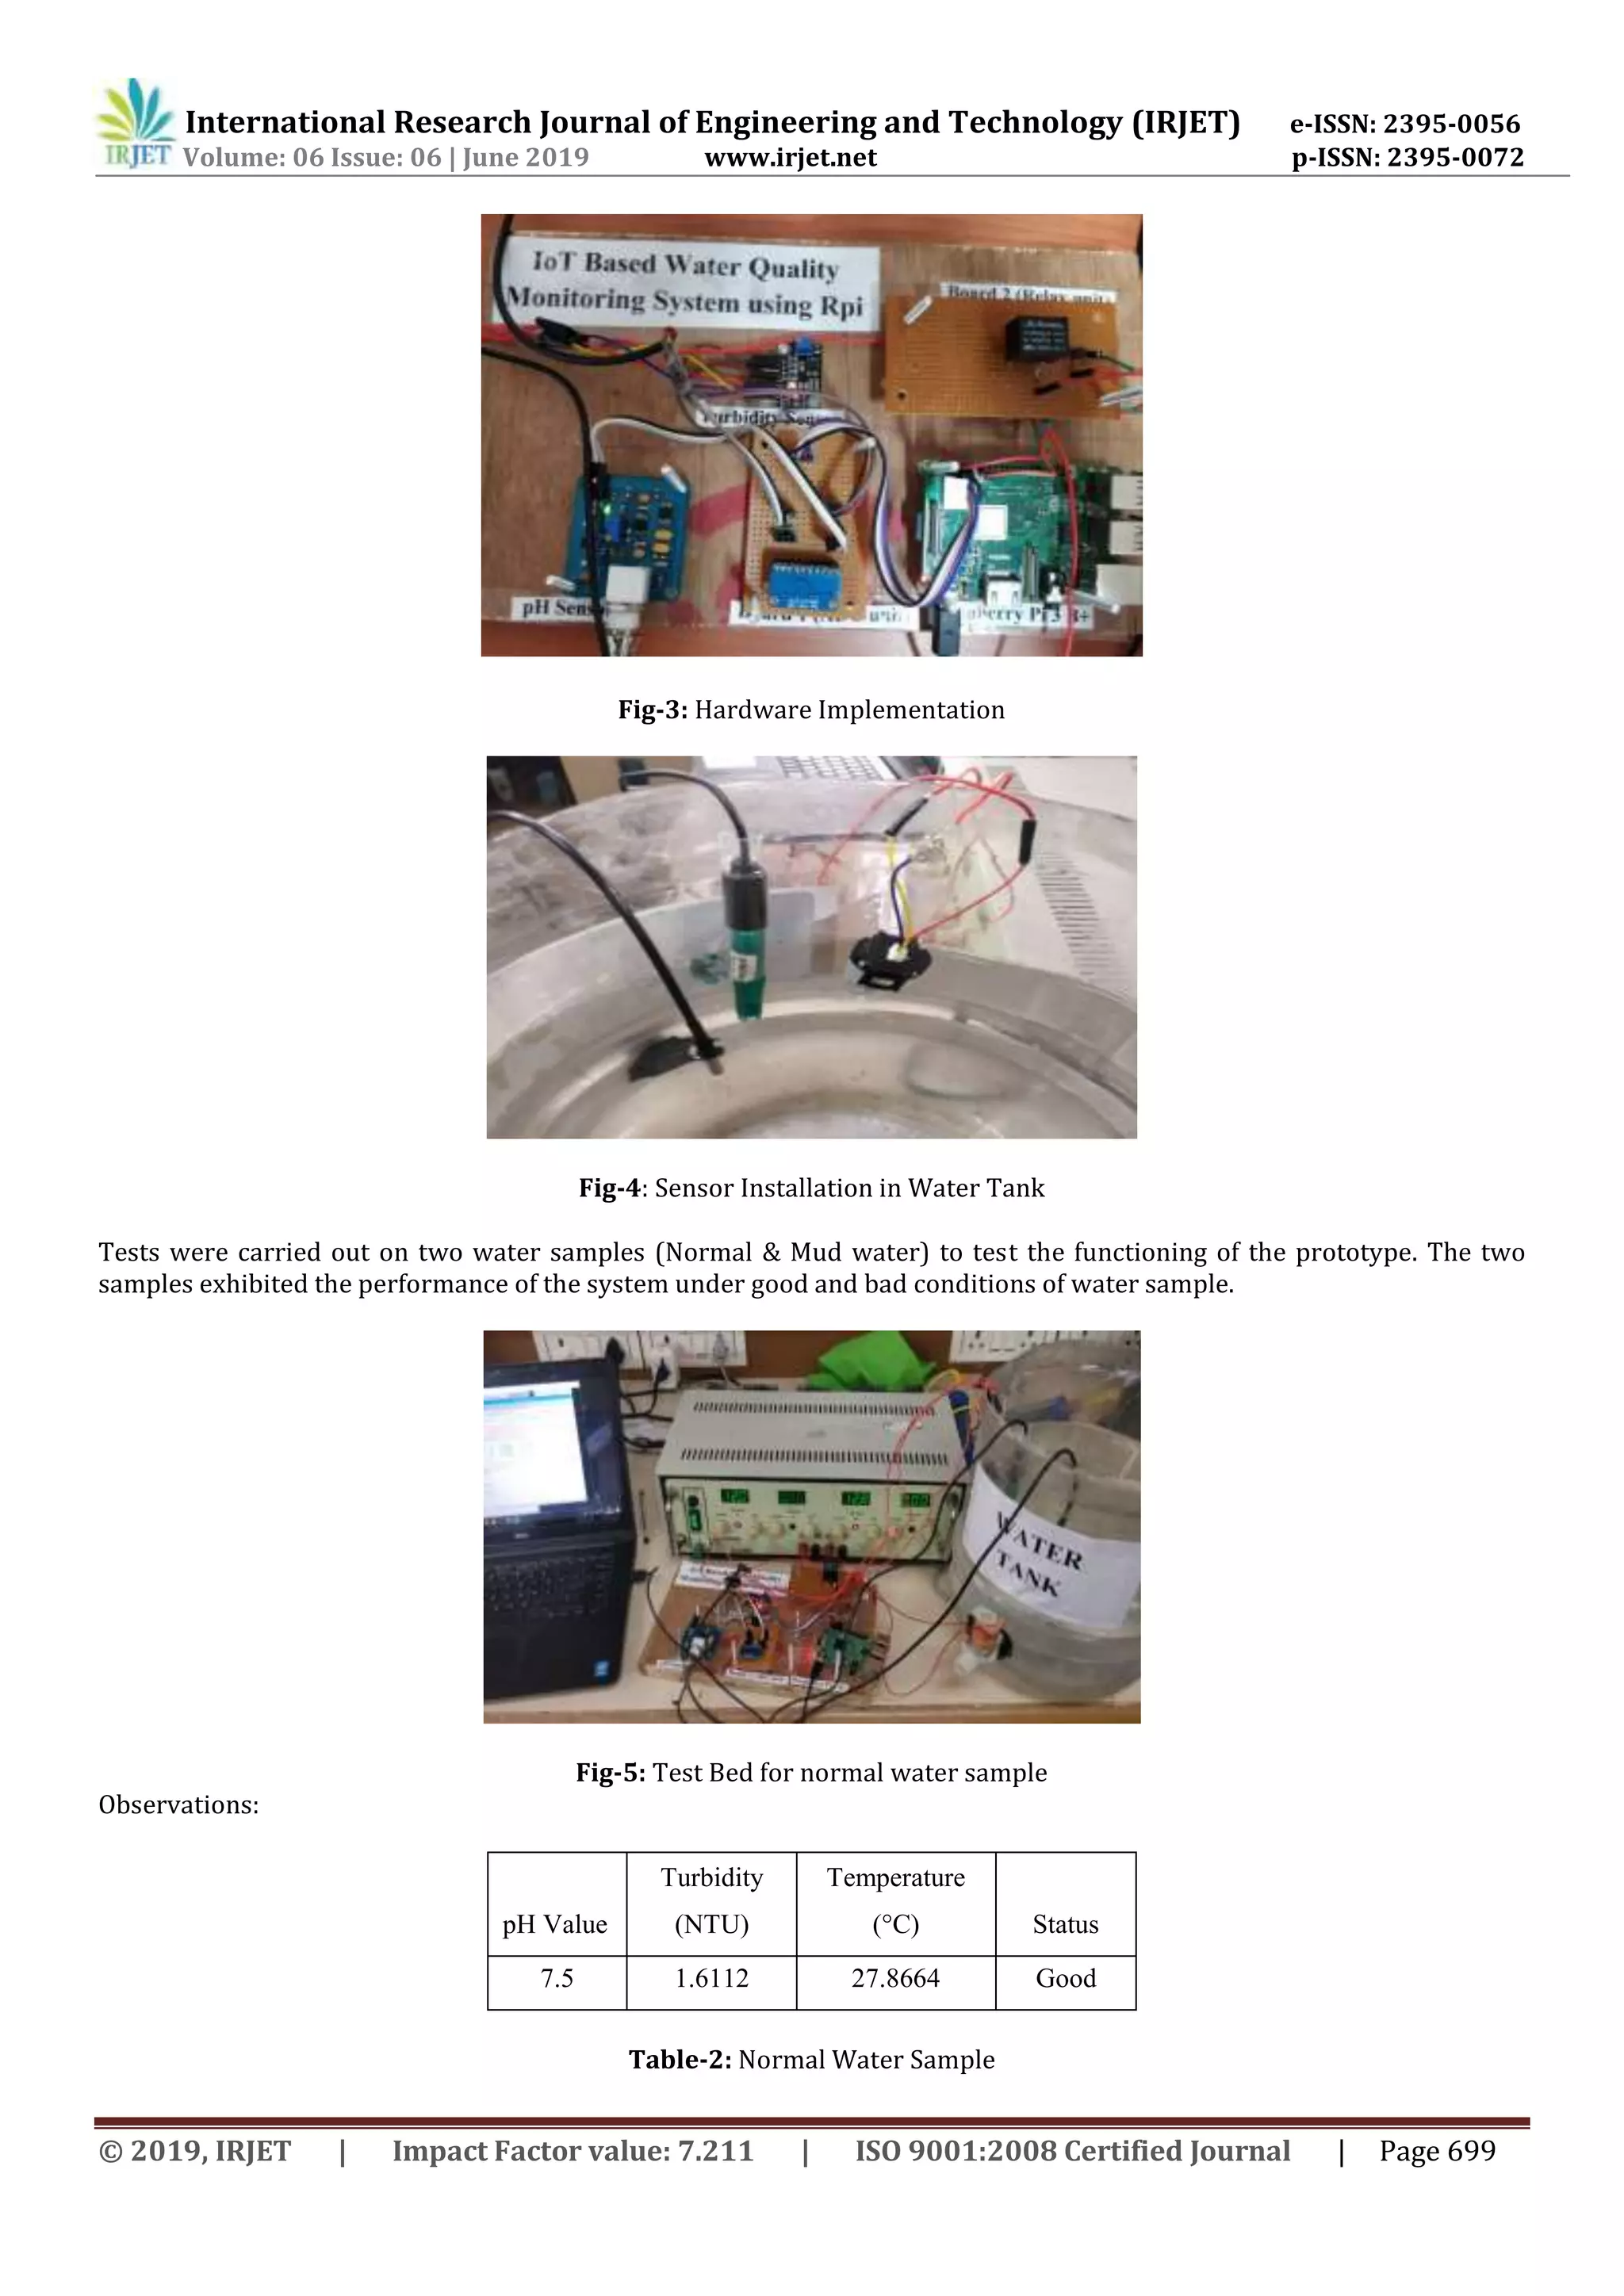
Fig-6: Test Bed for Mud Water Sample
Observations:
pH Value Turbidity (NTU) Temperature (°C) Status
9.2 332.2264 29.4785 Bad
Table-3: Mud Water Sample
For further testing, mud and basic solution was added inside the water tank to indicate aging of the water and adulteration
due to environment. Sensors were placed inside the water tank and the result was observed on the computer. As seen
from Table-3, value of pH is 9.2 which is outside the allowable range for pH of drinkable water. Also, due to addition of
mud, turbidity is increased above allowable range. Thus, overall status of the water sample is Bad i.e. unfit for drinking. As
result obtained is bad, Solenoid valve will be closed and won’t allow flow of water through pipes to houses.
6. CONCLUSION
The design and development of a low cost system for real time water quality monitoring and controlling the flow of water
using IoT is presented. The proposed system consists of various sensors for water quality monitoring and a solenoid valve
for controlling the water flow in the pipeline. These devices are low in cost, highly efficient and flexible. Also, the system
monitors the water quality in real time and takes the necessary measures to prevent water of “bad” quality from reaching
residential homes. An added advantage is that the water quality parameters are visible in real time to the concerned
authorities on the web server so that they can take any necessary action if required from their side. This system can be
used in many fields like water distribution systems, industries, nuclear power plants and can also be used to measure the
water quality parameters of lakes & rivers. This monitoring and controlling process can be performed anytime and
anywhere in the world. In future, we can include biological sensors for better detection of contaminants in water and can
install the system in several locations for high spatiotemporal coverage.
REFERENCES
[1] Jayti Bhatt, Jignesh Patoliya, “Iot Based Water Quality Monitoring System”, IJIEEE, April 2016.
[2] Centre for Environment Education and Technology (CEET), Water and Sanitation. Retrieved from
www.ceetindia.org/water_and_sanitation.html](https://image.slidesharecdn.com/irjet-v6i6208-191116041458/75/IRJET-Water-Quality-Monitoring-using-IoT-6-2048.jpg)
![International Research Journal of Engineering and Technology (IRJET) e-ISSN: 2395-0056
Volume: 06 Issue: 06 | June 2019 www.irjet.net p-ISSN: 2395-0072
© 2019, IRJET | Impact Factor value: 7.211 | ISO 9001:2008 Certified Journal | Page 701
[3] Calum McClelland. “What Is IoT? – A Simple Explanation of the Internet of Things.” IoT For All, January 6, 2019.
Available: www.iotforall.com/what-is-iot-simple-explanation
[4] “Internet of Things (IoT) connected devices installed base worldwide from 2015 to 2025 (in billions).” Statista-The
Statistics Portal. Available: www.statista.com/statistics/471264/iot-number-of-connected-devices-worldwide
[5] Bishal Sigdel, “Water Quality Measuring Station”, Helsinki Metropolia University of Applied Sciences, May 2017.
[6] Indian Standard Drinking Water – Specification, Second Revision IS 10500:2004, Bureau of Indian Standards (BIS).
[7] Nikhil Kedia, “Water Quality Monitoring for Rural Areas- A Sensor Cloud Based Economical Project”, International
Conference on Next Generation Computing Technologies (NGCT-2015), September 2015.
[8] Zulhani Rasin, Mohd Rizal Abdullah, “Water Quality Monitoring System Using Zigbee Based Wireless Sensor Network”,
IJET-IJENS, December 2009.
[9] Matthew Dunbabin, Alistair Grinham, James Udy, “An Autonomous Surface Vehicle for Water Quality Monitoring”,
Australasian Conference on Robotics and Automation (ACRA), December 2009.
[10] Kulkarni Amruta, Turkane Satish, “Solar Powered Water Quality Monitoring System using Wireless Sensor Network”,
Loni University of Pune, Loni (MH), India, 2013.](https://image.slidesharecdn.com/irjet-v6i6208-191116041458/75/IRJET-Water-Quality-Monitoring-using-IoT-7-2048.jpg)

1) The document describes a system for real-time water quality monitoring and control using IoT. 2) The system uses sensors to measure pH, temperature, and turbidity and sends the data to a Raspberry Pi for processing. 3) Based on the sensor readings, the Raspberry Pi can control a relay mechanism and solenoid valve to stop or continue water flow from an overhead tank depending on whether the water quality meets standards.