Documentation on topics Documentation2.edited.docx
2.
CHAPTER 1
INTRODUCTION
1.1 INTRODUCTION
Wateris essential to all living things and plays a decisive role in agriculture, industry and everyday
life. Ensuring water quality, especially in areas where it directly affects the growth of plants and
human health, is at most important. Traditional water testing methods often require manual
sampling and laboratory analysis that can be time -consuming, costly and feasible for real -time
monitoring. With the progress of available microcontrollers and sensors, automated systems can be
developed that provide ongoing observation of the indicators pertaining to water quality.
One of the most vital natural resources is water, and the quality of it has a direct impact on industry,
agriculture, human health, and aquatic life. However, preserving water quality has grown more
difficult as a result of pollution, industrial waste, and climate change. This project is an intelligent
Internet of Things solution that uses data-controlled data and real-time updates to automate water
quality monitoring.
Human health, agricultural production, and environmental sustainability are all significantly
impacted by water quality. Manual sampling and laboratory testing are examples of traditional water
quality monitoring techniques that are expensive, time-consuming, and lack real-time capabilities.
This project suggests a water-powered water management system to address these issues. It offers
real-time, continuous monitoring of important water parameters, including pH, turbidity,
temperature, humidity, conductivity, and dissolved oxygen. Integration of intelligent sensors with a
microcontroller and cloud connection transmits the system living data to a centralized platform,
where it is analyzed and visualized through the interactive control panel. This allows users to
immediately monitor the water quality status, accept the abnormal values warnings, and make
informed decisions to ensure safe and sustainable water use. The system is designed to be scalable,
energy efficient and suitable for deployment in various environments.
The use of built -in systems such as Arduino, popularity in environmental monitoring applications
due to their simplicity, low cost and flexibility. Arduino Uno, an open source board, offers an
excellent platform to integrate multiple sensors and collect data in real time. By combining a
combination of sensors such as pH, soil humidity, temperature and humidity sensors, we can create
3.
a comprehensive monitoringsystem that offers important information about environmental
conditions and water quality.
A vital indication of water quality, the pH sensor is essential for determining how acidic or alkaline
the water is. The growth of plants and aquatic life may be hampered by the presence of dangerous
chemicals or contaminants, which are indicated by abnormal pH values.Similarly, soil humidity
sensors help monitor the water content of the soil, which is necessary for efficient irrigation and
evaluation of water availability for plants. These values can help together in understanding the
interaction between water and soil quality.
Temperature and humidity are also critical factors of the environment that affect water qualityWhile
moisture can impact microbial activity and soil water retention, high temperatures can promote
evaporation and alter the concentration of chemicals in water. By incorporating the DHT11 or
DHT22 sensor, the system can capture data on these parameters in real time and contribute to a
more holistic understanding of the environmental conditions.
The project's goal is to create an intelligent and user-friendly water quality monitoring system that
may be applied in environmental, educational, and agricultural settings. Lever Arduino Uno and
Related Systems Offer Economical, Efficient Prices Water quality monitoring and control solution.
encourages the use of sustainable practices Lastly, help preserve natural resources and boost
productivity by enabling users to make well-informed decisions based on real-time data.
4.
CHAPTER 2
INTRODUCTION TOPROJECT
2.1 INTRODUCTION:
Water quality control system with live updates of different condition
Parameters is an innovative project aimed at providing real -time solutions for monitoring
The quality of water resources
This project focuses on the development of water quality system based on IoT, which allows
monitoring in real time and live updates of the state of various water parameters. Using a series of
calibrated sensors, the system is intended to detect important parameters like pH levels, turbidity,
temperature, dissolved oxygen, total dissolved solids (TD), and electrical conductivity. The
microcontroller is linked to these sensors, which collects data and transmits it to the cloud platform
using wireless communication technologies. The data collected is then visualized on a user -friendly
website or a mobile dashboard, allowing users to monitor real -time water quality, receive
notifications for unusual conditions and access to historical data for analysis. This intelligent
monitoring solution deals with limiting manual testing by offering scalp, automated and cost -
effective access to water resources, ensuring early interventions and promoting the environment.
In order to overcome these obstacles, this proposal suggests creating an Internet of Things-powered
water quality management system that offers live updates and real-time monitoring of the
fundamental water parameters. The system combines a microcontroller (such as an Arduino or
ESP32) that gathers and analyzes data from the water body with a variety of water quality sensors,
including pH, turbidity, temperature, and humidity. Wi-Fi, GSM, or Lora modules are then used to
wirelessly send this data to the cloud platform.
Once in the cloud, the data is stored, analyzed and visualized using your own website or mobile
control panel. The control panel displays live graphs and parameter values and alerts users if any
deductions are deviated from secure thresholds. This is strengthened by the stakeholders - such as
5.
environmental authorities, watertreatment plants, scientists and communities - to take quick steps in
case of potential contamination or equipment failure.
The system is designed to be cost -effective, scalable and customizable for various environments,
including urban distribution systems, rural water supply, reservoirs, rivers, lakes and industrial
drainage channels. Furthermore, by using data logging and cloud analysis, you can examine past
patterns and do predictive maintenance, opening the door to more sustainable and smarter water
management.
This project represents the Internet of Things (IoT)-the water quality control system, which aims to
revolutionize traditional water monitoring procedures by providing continuous insight into real time
to water conditions. The system uses the strength of IoT integration of intelligent sensors, wireless
communication modules, cloud computing and interactive panels and creates a fully automated, end-
end solution for water quality evaluation.
The core of the system is a microcontroller unit - for example, as ESP32 or Arduino To monitor
important water quality characteristics, it can be switched with several calibrated sensors such as
pH, temperature, turbidity, TD (overall dissolved solid), conductivity and dissolved oxygen (to).
These parameters are the necessary indicators of water health and help detect contamination events
in time. The microcontroller collects sensor data and sends it via Wi-Fi, GSM or Lora to the cloud
platform where the data is safely stored and processed.
User interfaces-sealed as responsive web or mobile apps-nits updates in real time and parameters
and generate automatic notifications if values exceed predefined security Prague. The system also
supports historical data monitoring and allows users to analyze trends and predict future water
conditions using data analysis or machine learning.
By automating the data collection and monitoring process, this system based on IoT reduces human
effort, increases accuracy and allows remote access to water quality information from any location.
The system is highly scaled and can be deployed across different environments-the small villages of
large tanks and industrial discharge points.
6.
2.2 LITERATURE REVIEW:
TITLEAUTHOR YEAR METHODOLOGY LIMITATIONS
Water Quality
Assessment Tool
for On-Site Water
Quality Monitorin
g
Segun O.
Olatinwo
Trudi-H. Joubert
2024
Use of edge computing for
on-site analytics and
classification. Data
preprocessing with robust
scaler methods to handle
skewness and outliers
and deeper scalability
issues for larger
datasets were not fully
explored. Requires
further validation in
broader real-world
applications and
diverse geographic
datasets
IoT Innovations in
Sustainable Water
and Wastewater
Management
and Water Quality
Ahmad Alshami,
Eslam Ali,
Abdelrahman
Tarek Zayed
2024
The study adopts a hybrid
approach combining
scientometric analysis and
systematic review. It
employs tools like
VOSviewer and CiteSpace
for scientometric analysis,
focusing on publication
trends, keyword co-
occurrence, and citation
burst analysis.
Communication
Challenges: Limited
range and connectivity
issues of IoT
technologies like Wi-
Fi in specific
environments.
Monitoring
Systems for
Surface Water:
Combining Data
Sources for
Sustainable
Watershed
Management
Yuli
SudrianiViktor
SebestyénJános
Abonyi
2023
Incorporating different
information sources like
in-situ sensors, remote
sensing, and laboratory
measurements. Designing
data acquisition systems
emphasizing metadata
quality and cloud-based
spatio-temporal
integration.
The study largely
reviewed literature
without extensive
empirical testing of
the proposed
FIMS.Limited focus
on socio-economic or
political barriers in
adopting integrated
systems
Quality
Assessment and
Monitoring of
Water Using IoT
Infrastructure
Manish Kumar,
Tinku Singh,
Anubhav Ashwin
Raut, and Pramod
Kumar Singh
2023
used sensors to gather
information on factors
such as dissolved oxygen,
pH, and temperature,
conductivity, and
Hardware security
limitations prevented
continuous
monitoring. The scope
was limited to two
7.
oxidation-reduction
potential.Applied
Principal Component
Analysis (PCA)for feature
selection and Factor
Analysis for weight
assignment.
.
sites (Ganga and
Sangam) and a single
geographic region,
which might restrict
broader applicability.
An Industrial
Cloud-Based IoT
System for Real-
Time Monitoring
and Controlling of
Wastewater.
Ranya M.
M. Salem,
M. Sabry Saraya,
M. T. Ali-Eldin
2022
created a sensor network
for in-pipe contaminant
detection and real-time
water quality monitoring.
Integrated low-cost
electrochemical and
optical sensors to detect
parameters
Limited detection
accuracy for very low
contaminant
concentrations. The
algorithms showed
varying performance,
with the Polygon Area
Algorithm being better
suited for anomaly
detection.
Internet of Water
Things: A Remote
Raw Water
Monitoring and
Control System
Abílio Silva
Júnior,Roberto
Mohammad
Mehedi
Hassan,Victor
Hugo
2021
The proposed IoT system,
termed the Internet of
Water Things (IoWT),
integrates sensors and
cloud-based technologies
to monitor and manage
raw water resources. The
system was tested through
simulations and a
prototype was validated in
real-life scenarios.
The processing time
evaluation alone may
not reflect the overall
system robustness, as
security and
scalability tests were
not comprehensively
addressed.
A Complete
Proposed
Framework for
Coastal Water
Quality
Monitoring System
With Algae
Predictive Model
Nur Aqilah,
Rostam Nurul
Hashimah
Ahamed Hassain
2021
Data collection: made use
of solar-powered sensors
and Internet of Things
(IoT) technology to gather
data on water parameters
like chlorophyll-a,
temperature, and nutrient
levels
The model primarily
focuses on coastal
datasets and requires
adaptation for other
water sources.
Maintenance
challenges for IoT-
based systems, such as
sensor fouling by
8.
algae, were notfully
resolved.
Creation of an
Arduinoand
Wireless Sensor-
Based Water
Quality
Monitoring System
G.Prathiba
Ambika Sekhar 2015
The study emphasizes how
wireless Arduino-based
devices might enable
effective and expandable
water quality monitoring
systems.
Limited focus on
socio-economic or
political barriers in
adopting integrated
systems
Monitoring Water
Quality Using
Sensors Based on
Arduino
Vani. R.M
M.Roopa 2010
The study highlights the
advantages of using
Arduino platforms,
including ease of
implementation and
adaptability for various
environmental monitoring
applications.
Limited detection
accuracy for very low
contaminant
concentrations
2.3 OBJECTIVE:
9.
This project's primarygoal is to develop and deploy an Internet of Things system for real-time water
quality management and monitoring. Through the use of integrated sensors and a microcontroller,
the system seeks to continuously detect important characteristics like pH, humidity, temperature,
and water level.These readings will be transmitted wirelessly to a cloud platform for safe storage
and processing. An easy -to -use web or mobile board will be developed to visualize data in real
time, show trends and alert users when the values exceed safe limits. The project also seeks to create
a scalable and profitable solution that can be implemented in various environments, such as rivers,
lakes, deposits and water supply networks. By automating water quality evaluation and allowing
remote access to live data, the system aims to support timely interventions, promote data -based
decision making and contribute to sustainable management of water resources.
2.4 MOTIVATION:
The need for real -time monitoring: traditional water testing methods are slow and
manualSystems that can deliver real-time data and alerts are becoming more and more
necessary.
Environmental and public concerns: Polluted water sources can harm the ecology and cause
major health issues. Early automation detection can prevent the main consequences.
Reducing human error: manual sampling and testing are susceptible to inaccuracy; Automated
systems improve reliability and consistency.
Restrictions on traditional methods: Conventional water quality testing is manual, time -
consuming and lacks real -time data, making immediate action in the event of contamination.
IoT technological advances: IoT technologies provide innovative, cost -effective and scalable
solutions for automation of water quality monitoring and available data anytime, anywhere.
Proactive decision -making: This system offers users (government bodies, environmental
agencies and local communities) to take active steps to manage and protect water resources by
offering live updates and alerts
CHAPTER 3
BLOCK DIAGRAM
10.
3.1 INTRODUCTION:
The blockdiagram of the Internet of Things water quality management system is presented in this
chapter. Explained is the live status update of multiple parameters. This chapter describes the
various components of the system's power supply unit.
3.2 BLOCK DIAGRAM:
Fig.3.1 block diagram
3.3 POWER SUPPLY:
230V
ARDUINO UNO
CONTROLLER
RPS LCD
WATER LEVEL
SENSOR
TEMPERATURE
&HUMIDITY SENSOR
PH SENSOR
WIFI
MODULE
BUZZER
Step Down
Transformer
Rectifier Filter
Capacitor
Regulator
11.
Regulated
AC Output
Fig:3.2 basicblock diagram of a fixed regulated power supply.
The power supply for the water quality management system with IoT plays a fundamental role in
guaranteeing reliable and continuous operation, particularly in remote or outside locations. In areas
with access to the electrical grid, the system can be feed through a standard CA network supply,
which becomes the CC voltage required to feed the microcontroller and sensors. Rechargeable
lithium-ion batteries are utilized for remote installations in order to supply a portable and efficient
power supply. To further improve sustainability, solar panels can be integrated, providing a
renewable energy solution to load the batteries during the hours of the day, ensuring continuous
operation even in areas without stable electricity. The system is optimized for low energy
consumption, with energy saving characteristics in components such as the ESP32 microcontroller,
which enters the suspension mode when it does not actively collect data. In addition, a solar load
controller guarantees a safe and efficient battery charge, while a battery monitoring circuit monitors
the health of the battery and alerts to users when the power levels are low, minimizing the risk of
unexpected inactivity time.
3.3.1 TRANSFORMER:
Fig 3.3: Transformer Fig 3.4:Center tapped Transformer
The primary and secondary coils—also referred to as "windows"—make up a transformer.
12.
They are connectedby electrical cables known as cores that are inductively linked. An alternative
voltage is induced in the secondary coil as a result of a change in the magnetic field in the nucleus
caused by a change in primary current. An alternating current will pass through the load if it is
applied to high school. Under perfect circumstances, the magnetic field will transmit all of the
primary circuit's energy to the secondary circuit.
So
The secondary voltage of the transformer depends on the number of turns
in the Primary as well as in the secondary.
3.3.2 RECTIFIER:
A device that changes a CA signal into a CC signal is called a rectifier. We employ a diode for
rectification; a diode is a device that stops current in the inverse biased situation and permits current
to flow alone in one direction, i.e., when the diode anode is positive with respect to the cathode, also
known as the bias forward.
Rectifiers go into the following categories:
A) Half Wave rectifier.
13.
Transformer
Fig 3.5: Half-waverectifier
As you can see from the diagram, a half-wave rectifier is the most basic kind of rectifier and only
requires one diode. The diode is biased forward and current passes through it when a CA signal is
applied during the half positive cycle. However, the diode is inversely biased and does not conduct
current during the negative half cycle. It is extremely inefficient to utilize in feed supplies since only
half of the input makes it to the exit.
B) Full wave rectifier:
Fig 3.6: Full-wave Rectifier
Although the half-wave rectifier is rather straightforward, it is incredibly wasteful; therefore, we
would want to employ both cycles of the CA signal for increased efficiency. A transformer with a
central contact can accomplish this; to do so, we would need to double the secondary winding's size
and link it to the center. As a result, D1 conducts and D2 is reverse biased during the half positive
cycle. D1 is inversely biased and the d2 diode conducts during the half-cycle. As a result, both
methods cycles through the load are obtained. The requirement for a transformer with a central
14.
contact is oneof the drawbacks of full wave rectifier design, which raises the circuit's size and
expense. The full wave bridge rectifier can be used to prevent this.
Fig 3.7: Bridge Rectifier with transformer
C) BridgeRectifier:
As its name suggests, it converts the complete wave, that is, both the positive and negative
half cycle in DC, so it is much more efficient than the half -wave rectifier and that also without
using a transformer with a central tip, so that much more complete wave rectifier.
A bridge rectifier is an electronic circuit used to convert CA (alternating current) into DC
(direct current). It consists of four diodes arranged in a bridge configuration. The DC exit is taken
from the remaining two corners of the bridge, while the CA entrance feeds on two opposite corners.
The diodes are placed in such a manner that two diodes lead and permit the current to flow,
producing a unidirectional output during the media positive and negative cycles of the CA entry.
This produces a softer CC output that may be fed into electrical devices by filtering and regulating
it. Power supply frequently use bridge rectifiers to effectively convert CC to CC.
he four diodes that make up the full bridge wave rectifier are D1, D2, D3, and D4. Half-
cycle diodes D1 and D4 exhibit positive activity, while during the negative half-cycle, diodes D2
and D3 conduct. As a result, the transformer's connections continue to change, giving us half-
positive cycles at the output.
15.
Fig 3.8: BridgeRectifier with a center-tapped transformer
It is possible to generate fixed positive and fixed negative voltages by using a center-tapped
transformer for a bridge rectifier, which yields both positive and negative half cycles.
3.3.FILTER CAPACITOR:
Despite providing CC outflow, neither the half-wave nor the full-wave rectifiers offer a steady
output voltage. We must soften the waveform that the rectifier sends us in order to accomplish this.
A condenser at the rectifier output can be used for this. Other names for this condenser are "filter
capacitor," "soft-zing condenser," and "depositor of deposits." There will be some undulation even
after using this capacitor.
In order to maintain the voltage as constant as possible, we position the filter capacitor at the
rectifier output such that the condenser loads at its maximum voltage throughout each half cycle.
Then, we gradually release the energy stored in the filter capacitor through the load as the rectified
voltage drops to zero.
The undulation will lessen if we keep raising the filter capacitor's value. However, the price will
thereafter go up. The circuit's current consumption, the waveform's frequency, and the permitted
undulation all affect the filter condenser's value.
16.
Fig 3.9: Outputof Rectifier due to filter capacitor
Where
Vr is the allowed ripple voltage, which should not exceed 10% of the voltage, and I is the current
circuit consumption in amperes.
F stands for the waveform's frequency.
F=25 Hz because a half-wave rectifier only has one peak each cycle.
A full wave rectifier, on the other hand, has two peaks in a single cycle, meaning that F=100 Hz.
3.3.4 VOLTAGE REGULATOR:
An apparatus that transforms a fluctuating input voltage into a steady, controlled output voltage is
called a voltage regulator. There are two varieties of voltage regulators.
1) A linear voltage regulator
Because it releases extremely resistant voltage as heat, it is also known as a resistive voltage
regulator.
2) Regulators that switch.
They quickly switch the current on and off to control the output voltage. Because its output may be
17.
turned on oroff, it uses relatively little power and is more efficient than linear voltage regulators.
However, because of their change activity, they are more complicated and produce a lot of noise.
Regulators are often more costly at low power output levels, but they are significantly less
expensive than linear regulators for higher output power.
The 78xx series linear voltage regulators, in which the output voltage is indicated by the XX, are the
most widely accessible. Additionally, negative voltage regulators are covered by the 79xx series.
Fig 3.10 Voltage regulator
A voltage regulator receives the signal after the rectifier output has been filtered. A maximum of 35
V is the highest input voltage that can be applied at the input. The input voltage needs to be at least
2-3 volts higher than the output voltage since the regulator often has a 2-3 volt loss. If the input
voltage is lower than the regulator Vmin because of the undulation voltage or for any other reason,
the voltage regulator might not generate the proper regulated voltage.
IC7805:
IC 7805 is a three-terminal integrated positive linear voltage regulator. Allow 10 to 35 volts of input
voltage and 5 volts of output voltage. Although there are models with lower current ratings, it
currently has a 1 amperium rating. It has a 5.0V output voltage set. A current limiter is also built
into the 7805 as a security measure. Numerous businesses, including Fairchild and National
Semiconductors, make 7805.
A voltage regulator with a fixed 5V CC output is the 7805 IC. It belongs to the 78XX series of
voltage regulators, which are frequently used in a variety of electronic circuits to control and
stabilize the voltage. The 7805 has a maximum current rating of approximately 1-1.5a (depending
on heat dissipation) and converts a higher CC input voltage (usually between 7V and 35V) into a
constant 5 V output.
18.
If the 7805becomes overheated, it will automatically lower the output current. The voltage is
indicated by the final two digits; for instance, 7812 denotes a 12 volt regulator. Since the 78xx series
of regulators is unable to regulate negative voltages in systems that supply both positive and
negative regulated voltages, it is intended to work in tandem with the 79XX family of negative
voltage regulators.
One of the most popular and well-known 78xx series regulators is the 7805 and 78, which is helpful
for feeding TTL devices due to its medium power regulation of 5V and counting of small
components.
Table 3.1: IC7805 Specifications
3.4 WATER-LEVEL SENSOR
SPECIFICATIONS IC 7805
Vout 5V
Vein - Vout Difference 5V - 20V
Operation Ambient Temp 0 - 125°C
Output Imax 1A
19.
Water-level sensors workaccording to different principles depending on the type of sensor. Some of
the most common types include:
1. Ultrasonic water level sensor:
• Use ultrasonic waves to measure the distance between the sensor and the surface of the water.
• The sensor emits ultrasonic pulses, and the time it takes for the echo returns determines the water
level.
2. Floating sensor:
• Use a floating object that moves with the water level.
• The float position is mechanically or magnetically linked to a switch or sensor that indicates the
water level.
3. Capacitive water level sensor:
• Detects changes in capacitance caused by the presence or absence of water.
• Capacitance varies with the dielectric constant, which changes as water increases or decreases.
4. Driver sensor:
• Use the conductive water properties to complete an electrical circuit.
• When the water touches specific probes, closes the circuit and triggers a signal that indicates the
water level.
5. Pressure sensor:
• Measure the pressure exerted by the water column on the sensor.
• The higher the water level, the greater the pressure, which can be translated into a depth value.
Applications in IoT -based systems:
20.
In Quality orWater management systems based on IoT, water level sensors are connected to
microcontrollers (for example, Arduino, ESP32 or Raspberry Pi) that collect, process and transmit
data wirelessly. Real -time data can be displayed in mobile applications or web panels, which allows
remote monitoring and control.
Advantages
• Real -time monitoring
• Low energy consumption
• High reliability and precision
• Easy integration with IoT platforms
3.5. ESP8266
21.
The Shanghai, China-basedcompany Espressif Systems created the inexpensive Wi-Fi
microprocessor ESP8266. It is perfect for Internet of Things applications that need wireless
connectivity and data processing in a small, cost-effective device because it has full TCP/IP battery
and microcontroller capabilities.
In August 2014, Western manufacturers first took notice of the chip through the ESP-01 module,
which was developed by the third-party company Ai-Thinker. This compact module allowed
microcontrollers to connect to Wi-Fi networks and perform basic TCP/IP communication using
Hayes-style AT commands. At the time, English documentation for the chip and its commands was
extremely limited. The combination of its very low cost and the small number of external
components — hinting at the possibility of even cheaper production at scale — sparked significant
interest among hackers and developers. Many enthusiasts began experimenting with the chip, the
module, and its software, while also working to translate the Chinese documentation into English.
The ESP8285 is a Esp8266 with one microbyte of flash built in, enabling the creation of single-chip
devices with Wi-Fi connectivity.
Fig:3.12 ESP8266
22.
PROCESSOR: 32-bitRISCO Microprocessor Core operating at 80 MHz, based on the
XTENSA 106micro diamond standard [5].
Memory: or instruction for 32 kib RAM
or 16 Kib ETS System-Data Ram, 32 Kib Instruction Cache RAM, or 80 Kib RAM users
IEEE 802.11 B/G/N WI-FI or integrated switch TR, Balun, LNA, power amplifier, and
coincidence network o Wep or WPA2 authentication, or open networks
External QSPI Flash: Up to 16 MIB (512 kib at 4 mib generally included) is allowed.
I²C (software implementation);
SPI; 16
gpio pins [6]
In order to share pins with the GPIO, I²S interacts with DMA.
UART in specific pins, as well as the ability to enable a transmission UART in GPio2
10-bit ADC (ADC with a successive approach)
23.
OPERATIONS:
Espressif Systems introduceda software development kit (SDK) in October 2014 that allowed the
chip to be programmed directly, doing away with the requirement for an additional microcontroller.
[7] Since then, Espressif has released numerous official SDK versions; the company maintains two
SDK versions: one based on call returns and the other on Fretos. [8]
The ESP-Open-Open-SDK open source tools chain, which is based on the GNU Compiler
Collection tool chain (GCC) and is maintained by Max Filippov, is an alternative to the official
Espressif SDK. [10] Mikhail Grigorev's "unofficial development kit" is an additional option. [11]
[12]
Other SDK, mostly open source, include:
Firmware based on Arduino-A C++. Like any other Arduino device, the ESP8266 CPU and its Wi-
Fi components can be programmed using this nucleus. Github offers the Arduino Esp8266 nucleus
for purchase.
• ESP8266 BASIC: An open-source, simple interpreter designed especially for the Internet of
Things (IoT). The auto-elbitrion browser serves as the basis for this development environment.
• ESP EASY: created by enthusiasts for home automation.
Efromo: El Esca is a system that uses simple yet effective configuration files to control ESP8266
and ESP32 devices. Additionally, it allows these devices to be controlled remotely using home
automation platforms.
• ESP-Open-RTos: an open source frertos-based software frame for the SP8266.
• ESP-Open-SDK: An integrated SDK for ESP8266/ESP8285 chips that is free and open to the
greatest extent feasible.
• Espruino: A Javascript firmware and SDK that closely mimics Node.js. admits ESP8266 and other
MCUs.
• The open source spurion ESP8285/ESP8266.
24.
• Puerto deJones outside The ESP8266 microcontroller is next.
• Micrypthon: an ESP8266 platform Micrypthon port, which is a Python implementation for
integrated devices.
An open source operating system for linked devices is Mongoose OS. ESP8266 and ESP32 are
admitted. Create in JavaScript or C. [13]
• Nodemcu: A Lua-based firmware.
• Platformio: a unified treatment plant and multiplatform that sits atop the Arduino code and
libraries.
• The ESP8266's Punyforth-Figh programming language.
SMMG: An actively developed C/C ++ asynchronous frame with several network capabilities and
outstanding performance.
• Ulisp: A LISP programming language variant created especially to run on CPUs with constrained
RAM.
• ZBASIC for ESP8266: A subset of Microsoft Visual Basic 6 that has been modified to serve as a
control language for the ESP8266 and ZX microcontroller family.
ESP8266 and other microcontrollers can be programmed in Python with Zerynth-Marco IoT.
3.6. PH SENSOR:
INTRODUCTION:
TYPE:
A PH meter, also known as a potentiometric pH meter, is a scientific device that measures the
activity of hydrogen ions in water-based solutions, indicating their acidity or alkalinity, expressed as
25.
PH. It operatesby detecting the difference in electrical potential between a pH electrode and a
reference electrode, which directly correlates to the pH level of the solution. PH meters are widely
used in a variety of fields, from industrial quality control to laboratory research.
The voltage between two electrodes is measured by the potentiometric pH meters, which then
translate this electrical signal into the appropriate pH value. These devices typically include a screen
calibrated in pH units, a pair of electrodes or a combination electrode, and a basic electrical
amplifier. Glass electrodes and reference electrodes, or a mix of both, are more frequently used in
this arrangement in a single probe. The solution under test has these electrodes placed in it. The
electrodes' design is very important; they are usually made of glass, shaped like a rod, and feature a
bulb with a sensor at the bottom.
For the concentration of hydrogen ions, the glass electrode is specifically made to be selective. The
hydrogen ions in the test solution interact with other positively charged ions in the glass bulb as they
submerge themselves in a solution. The opera pH sensor measures the voltage difference between
two electrodes, usually a glass electrode and a reference electrode, while submerged in a solution.
This ion exchange generates an electrochemical potential in the bulb, which the meter recognizes
and converts into a pH value. The amount of hydrogen ions (H ) in the water has a direct correlation
⁺
with this electrical potential. An electronic amplifier detects this potential difference and converts it
into pH units based on the Nernst equation. The resulting pH value is transmitted to the
microcontroller (for example, Arduino) for subsequent processing, storage or cloud -based
transmission. This real -time pH monitoring is essential to evaluate water quality in various
applications, including drinking water, agriculture and environmental monitoring systems.
According to the Nestn equation, the electrochemical potential through the glass bulb has a linear
relationship with pH.
The reference electrode is made out of a metallic conductor that attaches to the screen and is not
affected by the pH of the solution. An electrolyte solution, usually potassium chloride, is submerged
in this driver and comes into touch with the test solution via a porous ceramic membrane. [9] A
voltmeter that displays voltage in pH units is part of the screen.
An electrical circuit is completed when the glass electrode and reference electrode are submerged in
the test solution; in this circuit, the voltmeter generates and detects a potential voltage. It can be said
26.
that the circuitthat emerges from the reference electrode's conductive element links to the potassium
chloride solution around it and then makes contact with the test solution via the ceramic membrane.
olution, the glass electrode's selective hydrogen ion glass, the solution inside the glass electrode, the
glass of the glass electrode, and lastly, the visualization device's voltage. The potential difference
produced by the variation in the amounts of hydrogen ions on each side of the glass membrane
between the test solution and the solution inside the glass electrode determines how much the
voltage changes from one test solution to another. The pH has no effect on any other possible
variations in the circuit, which are fixed by calibration.
To make things simpler, a lot of pH meters employ a combined probe, which combines the reference
electrode and glass electrode into one unit. The combination electrodes on glass electrodes are
described in full in the article.
To ensure measurement accuracy, the pH meter is calibrated using known pH solutions, usually
before to each use. [11] The electrodes are used as probes to measure the pH of a solution. They are
submerged in the test solutions and left there long enough for the hydrogen ions in the test solution
to balance with the ions on the glass electrode's bulb surface. The pH is measured steadily by this
balance.
pH ELECTRODE AND REFERENCE ELECTRODE DESIGN:
The producers have strict control over the production process and the microstructure that
results from the glass membrane in the pH electrodes. Nonetheless, some elements of the design are
openly accessible. Alkaline ions can carry the current through the glass used in pH electrodes
because it functions as a solid electrolyte. In order to provide a consistent membrane shape and
streamline the production process, the pH-sensitive glass membrane is usually spherical. To increase
durability, these membranes are frequently up to 0.4 millimeters thicker than their predecessors.
Alkaline and hydrogen ions in the solution can bond to the glass surface thanks to its chemical
silicate activity. As a result, an ion exchange capacity between 10−610^{-6} 10−6 and 10−810^{-8}
10−8 mol/cm² is produced. Ionic load, ionic volume, and the coordination number—the number of
ions linked to other ions—all contribute to selectivity for hydrogen ions (H ). Manufacturers of
⁺
electrodes utilize patented glass compositions to maximize these properties; lithium glass is one of
the most popular and efficient.
27.
Although some versionsemploy the saturated calomel electrode, the silver chloride electrode
is the most commonly used reference electrode in pH meters. Because of its great repeatability and
ease of manufacture, the silver chloride variety is preferred. Typically, a platinum cable immersed in
a potassium chloride solution comes into touch with a silver/silver chloride mixture. The reference
solution and test solution are kept apart by a ceramic lid, which prevents cross-contamination and
maintains low electrical resistance.
OPERATION:
The pH meter must be calibrated before to each test in order to obtain extremely accurate
readings. Calibration of the pH meter is typically performed once every day of operation. Due to the
glass electrode's inability to sustain an electrostatic potential for extended periods of time, this is
required. Its accuracy can be impacted by variables like temperature fluctuations, pollution, and
electrode aging, therefore routine calibration is necessary for accurate readings.
The pH sensor calibration is carried out using a minimum of two standard buffer solutions that span
the anticipated measurement range in accordance with the principles of good laboratory practice
(LPG). Buffer solutions with pH values of 4.00 and 10.00 are frequently utilized for general
applications in order to ensure accuracy in both basic and acidic environments.
The pH meter often comes with two calibration controls: one that sets the meter reading to
match the value of the first standard buffer, and another that modifies the reading to match the
second buffer.
This two -point calibration guarantees precise and reliable pH measurements, counting the
variations of the sensor slope and compensation variations, which are essential to maintain precision
in environmental monitoring and water quality analysis.
Many PH meters include a third control to establish the temperature, since the precise
measurement of the pH is influenced by temperature variationsInformation on the temperature
dependence of the buffer pH value is typically provided by standard buffer sachets from many
suppliers. Sometimes the calibration is done to three separate pH values for more accuracy.
Automatic temperature adjustment (ATC) via thermocounts integrated onto electrode probes is a
feature of advanced PH meters. The electrode's voltage, which is roughly 0.06 volts per pH unit, is
in line with the pH scale during calibration. Good laboratory practice requires that the probes be
28.
rinsed with distilledor deionized water after each use to remove waste and dry-dry with a scientific
wipe without fluff to avoid dilution of subsequent samples. This ensures accuracy and extends the
electrode's usable life and be stored in a specific solution specific for the type of electrode.
Fig.3.13 Ph ELECTRODE
TYPE OF PH SENSOR:
he pH meters come in a variety of forms, from basic and inexpensive pens to complex lab
equipment with computer interfaces and numerous input channels for temperature and indicator
readings that enable pH values to be automatically adjusted in response to temperature changes.
These meters may have digital or analog outputs and can be fed by batteries or connected to network
electricity. Some advanced models use telemetry to transmit wireless signals from electrodes to the
visualization unit. For special uses, such as harsh and delicate biological microenvironmental
industrial settings, specialized meters and probes are also available. Modern ph meters that use solid
state electrodes provide alternatives with higher durability and specificity, as do holographic ph
sensors that use colorimetric techniques by utilizing several PH indicators, in addition to
conventional designs based on glass electrodes.
29.
Fig.3.14 Ph SENSOR
ArnoldOrville Beckman filed for the US patent in October 1934. After being asked by the
California Fruit Growers Exchange (Sunkist) to design a rapid and accurate way to assess the acidity
of the lemon juice, Beckman created the prototype while working as a chemistry assistant at the
California Institute of Technology. In order to manufacture scientific equipment, Beckman founded
National Technical Laboratories on April 8, 1935. The pH meter was distributed by Arthur H.
Thomas. The business made $60,000 in 1936, its first full year of revenue, from the sale of 444
meters of pH. The instrument's popularity expanded quickly, and in the years that followed, millions
of units were sold. The PH Beckman meter was named an ACS historical chemical milestone in
2004 in honor of its significance as the first commercially effective electronic pH meter.
Around 1936, the 1935-founded Denmark Radieve Corporation started selling PH meters for
medical applications. But at the time, Europe largely ignored the development of automatic pH
meters for industrial use.In contrast, American instrument manufacturers successfully advanced
technology, producing adequate industrial pH meters for a wide range of applications, including
water treatment systems, breweries, paper mills, and alumin production facilities. Later, in the
1970s, Jenco Electronics de Taiwan designed and produced the first portable digital pH meter,
which was sold under the Parmer Cole corporation's brand. This was a major step toward the
development of portable and user-friendly pH measurement solutions.
30.
3.7. TEMPERATURE SENSOR:
TheLM35 temperature sensor series consists of precision integrated-circuit sensors that produce an
output voltage directly proportional to the temperature in degrees Celsius.
LM35 SENSOR SPECIFICATION:
Compared to linear temperature sensors calibrated in Kelvin, the LM35 sensor has the benefit of
providing a direct Celsius output, eliminating the need for the user to subtract a significant amount
of constant voltage in order to convert the values.To offer typical ¼ ° C clarity at room temperature
and ¾ ° C in the full temperature range of -55 to +150 ° C, the LM35 sensor doesn't need any extra
calibration or cutting. Wafer-level cutting and calibration guarantee the low cost. The interface for
reading or controlling circuits is particularly simple because to the LM35's relatively low output
impedance, linear output, and accurate intrinsic calibration. It can be utilized with special materials
or with varying amounts of materials. It has a very low self-defense of less than 0.1 °C in fixed air
because it only draws 60 µA from its supply. While the LM35C sensor is classified for a range of -
40 ° to +110 ° C (-10 ° with increased precision), the LM35 sensor is classified to operate in a
temperature range of -55 ° to +150 ° C. T. While the LM35C, LM35CA, and LM35D are also
offered in the PAR-92 plastic transist container, the LM35 series is packaged in hermetic transist
packets up to 46. Additionally, the LM35D sensor comes in a 220 plastic packaging and a tiny
surface assembly contour pack.
LM35 sensor sources:
TheLM35 temperature sensor is a widely used component produced by multiple
manufacturers, each providing specific datasheets, technical specifications, and downloadable
resources. Some of the well-known manufacturers and distributors of the LM35 include:
National Semiconductor
ON Semiconductor
Texas Instruments
Fairchild Semiconductor
STMicroelectronics
Jameco Electronics
Analog Devices
Temperature Remembering with LM35:
This is how you can make an LM35 temperature registrar to using the PIC 12F675
microcontroller as a data warehouse and data warehouse. It generates a series output, which
allows you to see the results on a PC, and also calculates the temperature reading in Fahrenheit,
transmitting both the value of pH and the temperature to the serial port at intervals of half a
second. This real -time data output improves monitoring capabilities and facilitates easy record
or additional analysis on external devices.
LM35 Sensor Applications:
Common types of electrical temperature sensors often present challenges when applied. For
instance, thermocouples generate very low output signals and require cold-junction compensation,
while thermistors have nonlinear responses. Furthermore, these sensors' outputs usually don't
correlate linearly with conventional temperature scales. Many of these issues were resolved by early
monolithic temperature sensors like the LM3911, LM134, and LM135, although their outputs were
based on the Kelvin scale. Thankfully, the LM34 (for Fahrenheit) and LM35 (for Celsius) precision
integrated circuits were released in 1983. Although the LM34 is the main emphasis of this
34.
application note, theideas can be readily modified for usage with the LM35 with the right scale
changes.
The LM35/LM34 produces 10 mv/° F, is accurate to within ± 0.4 ° F at room temperature (77 ° F),
and has a typical non-linearity of Sol ± 0.35 ° F for a temperature range of −50 to +300 ° F.
Interface with the reading or control circuits is made easier by the LM34's low linear output and
output impedance characteristic. The LM34 temperature sensor has an inherent advantage over
many other temperature sensors on the market: it is resistant to low-level leakage currents, which
can have a substantial impact on measurement accuracy. Unlike some monolithic temperature
sensors that produce very small output currents, typically around 1 μa/° K, the LM34 offers an
analog voltage output of higher level directly proportional to the temperature in Fahrenheit degrees.
This design minimizes the impact of escape currents. For example, in sensors with an output of 1
μa/° K, a leakage current as small as 1 μA can introduce a 1 ° K error, which leads to inaccurate
temperature readings. However, the LM34 is much less susceptible to such deviations, so it is more
reliable for the monitoring of the precision temperature in environments where the electrical noise or
the minor escape may be present. On the other hand, the LM34 sensor can be operated as a current
way that provides 20 μa/° F of output current. The same 1 μA of escape current will cause an error
in the output of the LM34 of only 0.05 ° F (or 0.03 ° K after the scale). The device can be operated
with individual or dual supplies. With less than 70 μA of the current drainage, the LM34 sensor has
very little self-defend (less than 0.2 ° F in fixed air) and comes in a metal can pack at 46, a small
outline package SO-8 and a TO-92 plastic package.The LM34 sensor has extremely little self-
defense (less than 0.2 ° F in fixed air) and has a current drainage of less than 70 μA. It comes in a
metal can pack at 46, a compact outline container SO-8, and a plastic TO-92 package.
Oven temperature control systems and remote temperature monitoring are just two examples of the
many uses for the adaptable LM35 and LM34 temperature sensors. The device is simple to operate
and will be within 0.02 degrees Fahrenheit of the surface it is glued or fastened to. The GND pin
will have the same potential as the metal if the user chooses to weld the sensor to a metal surface
using the TO-46 packaging.
35.
CHAPTER 4
ARDUINO CONTROLLER
4.1INTRODUCTION:
Arduino is an open source hardware and software platform that encompasses a community-driven
project and ecosystem. It focuses on designing and producing single-plate microcontrollers and
microcontroller kits for use in interactive systems and digital devices. Because these systems can
control outputs (such engines, LEDs, or screens) and detect inputs from the physical world (like
temperature, light, or movement), Arduino is a flexible tool for developing integrated systems and
prototypes in both professional and educational settings. The general public license of GNU (GPL)
or the general public license of GNU Lesser (LGPL) governs their goods and permits anyone to
produce Arduino boards and distribute software. Arduino boards can be purchased commercially as
DIY kits or pre-assembled.
A range of microprocessors and controllers are used in Arduino plate designs. The boards can
communicate with several expansion tables, bread panels (shields), and other circuits because they
are outfitted with sets of digital and analog input/output pins (I/S). This adaptability makes it easier
to connect sensors, actuators, and other electrical components for experimentation or project
development by enabling the construction of customized configurations for a variety of applications.
Programs for personal computers can be loaded onto the boards using serial communications
interfaces, such as the Universal Serial (USB) bus on certain models. Typically, a variant of the
computer languages C and C++ is used to program microcontrollers. The Arduino project offers an
integrated development environment (IDE) based on the processing language project in addition to
conventional compiler tool chains.
The Arduino project started out as a course for students at the Interaction Design Institute Ivrea in
Ivrea, Italy, in 2003. Its goal was to give both beginners and experts a simple and affordable
approach to build gadgets that use sensors and actuators to interact with their surroundings. Simple
robots, movement detectors, and thermostats are typical examples of such devices for the primary
fans.
Some of the project's founders used to frequent a tavern in Ivrea, Italy, which is where the Arduino
36.
name originated. Arduinde Ivrea, the Margrave of the March of Ivrea and the king of Italy from
1002 to 1014, is honored by the bar's name.
Fig.4.1. Arduino Hardware image.
4.2 HISTORY:
The Interaction Design Institute Ivrea (IDII) in Ivrea, Italy, was the birthplace of the Arduino project
in 2003. The students at the time had faith in the simple seal microcontroller, which costs about $50,
a substantial sum for many. As part of his Master's thesis in IDII, Hernando Barragán worked with
Massimo Banzi and Casey reality to develop the wiring platform in order to make it more accessible
and affordable. Reas, who co-founded the processor development environment with Ben Fry, helped
achieve the wiring's goal of enabling non-engineers to produce digital products with basic tools.
An ATMEGA168 microcontroller, a printed circuit plate (PCB), an IDE built on processing, and a
collection of programming libraries were all merged in the wiring. Massimo Banzi, David Mellis,
and David Cuartieles later introduced support for the ATMEGA8 microcontroller, which is the most
profitable, in 2003. They decided to split the project instead of carrying on with the wiring, which is
how Arduino came to be.
Massimo Banzi, David Cuartieles, Tom Igooe, Gianluca Martino, and David Mellis made up the
first Arduino Core team [2], however Barragán was not asked to join.
Lighter and less costly variants of the wiring platform were released into the open source
community once it was finished. More than 300,000 official Arduinos were reportedly commercially
37.
produced by themiddle of 2011, and 700,000 official joints were in use by 2013. Former Arduino
CEO Federico Musto acquired a 50% stake in the business in October 2016. Up until recently,
Musto held a doctorate from the Massachusetts Institute of Technology. According to a Wired
article from April 2017, Musto "manufactured his academic record... on his company's website,
LinkedIn's personal accounts, and even in Italian commercial documents"According to some
accounts, he also holds an MBA from the University of New York." A year later, but later, but later,
but even later, the year later, Massimo Banzi announced that the Arduino Foundation would indicate
"a new beginning for Arduino" by focusing on community participation and the platform's state,
which is more accessible for developers and manufacturers. Wired reported that none of the
University had any history of muto assistance, and Musto later acknowledged in an interview with
Wired that he had never won those titles at the time. It was the State, the State, the State, and the
State, and the State, and the State, and the State, and the State, and the State, and the State, and the
State, and the State, and the State, and the State, and the State, and the State, and the State, and the
State, and the State, and the State, and the State, and the State, and the State, and the State, and the
State, and it has not been the State. It's unclear.
4.3 OPERATION:
Hardware from Arduino is open source. The Arduino website offers hardware reference designs that
are shared under a Creative Commons Attribution Sharbity 2.5 license. For certain hardware
versions, production and design files are also accessible. Engineers have asked that the Arduino
name be limited to the original product and not used for derivative works without authorization,
even if hardware and software blueprints are freely available under Copyleft licenses. The project is
open to including alternative names in the final product, according to the official policy paper on the
usage of Arduino's name. The project's name has been omitted from a number of commercially
released Arduino-compatible products by utilizing names that finish in -Duino.
38.
Fig.4.2. Back sideof the module.
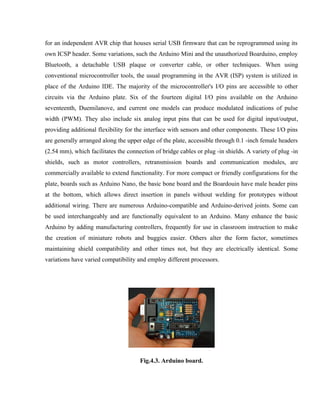
The majority of Arduino boards, including ATMEGA8, ATMEGA168, ATMEGA328,
ATMEGA1280, and ATMEGA2560, are based on 8-bit 8-bit AVR microcontrollers. To meet the
needs of various projects, these microcontrollers differ in terms of flash memory, I/O pins, and other
features.
When the Arduino Due was released in 2012, Arduino broadened its alliance, the first plaque to
present a Cortex-M3 32-bit microcontroller, the SAM3X8E ATMEL, which provides more
processing power and advanced capabilities. The boards generally include simple or double row
pins or female headers, allowing easy integration with external circuits and enabling programming
or the addition of expansion modules known as shields. The I²C serial communication bus allows
the shields to be layered and frequently directed separatelyenhancing scalability and modularity.For
consistent clock time, the majority of Arduino boards come with a glass oscillator or ceramic
resonator operating at 16 MHz and a 5 V linear voltage regulator. However, specialized boards such
as Lilypad Arduino are designed for portable electronic devices and work at 8 MHz, omitting
voltage regulators on board due to the restrictions of the form factors.
Arduino microcontrollers come pre-configured with a starting charger, which makes
loading programs into the chip's flash memory easier. The Optiboot starting charger is the Arduino
One's preset starter. Program code is transferred to the boards via a serial link to a different
computer. To convert between RS-232 logic levels and transistor transistor (TTL) logic level
signals, certain Arduino Series plates have a level level change circuit. Serial USB adapters, such
the FTDI FT232, are used to implement the Universal Serial Bus (USB) programming for the
current Arduino boards. Certain boards, like those of the posterior model, swap out the FTDI chip
39.
for an independentAVR chip that houses serial USB firmware that can be reprogrammed using its
own ICSP header. Some variations, such the Arduino Mini and the unauthorized Boarduino, employ
Bluetooth, a detachable USB plaque or converter cable, or other techniques. When using
conventional microcontroller tools, the usual programming in the AVR (ISP) system is utilized in
place of the Arduino IDE. The majority of the microcontroller's I/O pins are accessible to other
circuits via the Arduino plate. Six of the fourteen digital I/O pins available on the Arduino
seventeenth, Duemilanove, and current one models can produce modulated indications of pulse
width (PWM). They also include six analog input pins that can be used for digital input/output,
providing additional flexibility for the interface with sensors and other components. These I/O pins
are generally arranged along the upper edge of the plate, accessible through 0.1 -inch female headers
(2.54 mm), which facilitates the connection of bridge cables or plug -in shields. A variety of plug -in
shields, such as motor controllers, retransmission boards and communication modules, are
commercially available to extend functionality. For more compact or friendly configurations for the
plate, boards such as Arduino Nano, the basic bone board and the Boardouin have male header pins
at the bottom, which allows direct insertion in panels without welding for prototypes without
additional wiring. There are numerous Arduino-compatible and Arduino-derived joints. Some can
be used interchangeably and are functionally equivalent to an Arduino. Many enhance the basic
Arduino by adding manufacturing controllers, frequently for use in classroom instruction to make
the creation of miniature robots and buggies easier. Others alter the form factor, sometimes
maintaining shield compatibility and other times not, but they are electrically identical. Some
variations have varied compatibility and employ different processors.
Fig.4.3. Arduino board.
40.
4.4 ARDUINO PINS:
1.Power USB
The Arduino plate can be feed using the USB cable from your computer. It is connect the USB cable
to the USB connection (1).
2.Power (Barrel Jack)
Arduino boards can be fed directly from the CA network power supply by connecting it to the barrel
connector (2).
3.Voltage regulator
The voltage regulator on the Arduino plate is responsible for controlling and stabilizing the voltage
supplied to the plate. Ensures that CC voltages used by the processor and other components remain
consistent, avoiding fluctuations that could affect the performance of the board or damage its
components.
4.Crystal oscillator
The crystal oscillator helps the Arduino Board to administer tasks related to time. Calculate time
generating a consistent clock signal. The 16,000h9H number printed on the top of the glass indicates
that the frequency is 16,000,000 HERTZ (16 MHz), providing a stable synchronization reference for
the processor to perform functions based on time with precision.
5,17. Arduino's restart
You can restore your Arduino board to restart the program from the beginning of two ways:
1. When pressing the Restart button (17) on the board.
2. Connecting an external restart button to the restart pin (5) on the plate.
6,7,8,9 Pins (3.3, 5, GND, vin)
41.
• 3.3V (6):provides an output of 3.3V and is frequently utilized for components that need a lower
voltage.
• 5V (7): supplies 5V output, used for components that work at 5V.
• GND (8): The circuit is finished using the Arduino's earth pins. For convenience, there are several
GND pins accessible.
• VIN (9): As an alternative to USB or Jack Barrel power, it can be used to supply the Arduino plate
with power from an external energy source.
10.Analog pins
There are six analog input pins on the Arduino Board 1 (A0 to A5). Signals from analog sensors,
including temperature or moisture sensors, are read using these pins. The Board's CPU converts
analog signals into digital values, enabling the Arduino to process and utilize the data for a variety
of purposes.
11.Main microcontroller
The microcontroller (11), the brain of every Arduino board, is located within it. Different Arduino
models may include somewhat different integrated circuits (ICs), although the majority employ
ATMEL microcontrollers, which are now owned by Microchip. Prior to loading a program from the
Arduino IDE, it is crucial to identify the particular microcontroller (IC) on its plate because this will
impact compatibility. Usually, the microcontroller's top has this information. You can consult the IC
data sheet for comprehensive specifications and features.
12.PIN ICSP
The ICSP (12), or serial programming header in circuit, is typically used to program AVR
microcontrollers in the Arduino. It consists of pins for Mosi (teacher out of slave), miso (slave
teacher), SCK (series clock), restoration, VCC and GND. This interface is often known as SPI
(peripheral interface in series), which allows you to communicate with external devices acting as the
master of the SPI bus, controlling the flow of data to and from slave devices. It is a useful tool for
low -level programming and purification.
13.Power LED indicator
42.
When the Arduinoplate is linked to a power source, the power LED on the plate ought to light up,
signifying that the plate is being fed properly. An issue with the connection, such as a problem with
the power source, the USB cable, or the plate itself, is indicated if the LED does not light up.
14.LED TX and RX
In the Arduino one, the TX (transmission) and RX (receiving) labels are found in pins 0 and 1 for
serial communication. In addition, the TX and RX LEDs in PIN 13 flash during data transmission
and reception, with the intermittent speed of the TX LED depending on the speed of baud.
15.Digital E/S
The Arduino one has 14 digital I/O pins, with 6 that provide PWM output. These pins can be used as
inputs to read digital values or as outputs to control modules such as LED. The pins labeled "~" are
to generate pwm signals.
16.Aref
Analog reference is referred to as ARF. It is employed to determine the highest limit for analog
readings by setting an external reference voltage for the analog input pins, ranging from 0 to 5 volts.
CHAPTER-5
SOFTWARE
5.1: Introduction
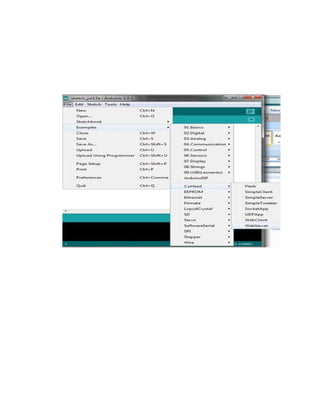
This projectis implemented using the following software:
Express PCB – for designing circuit
Arduino IDE compiler - for compilation part
Proteus 7 (Embedded C) – for simulation part
5.2: The interface
When a project starts, it will be received with a yellow contour. This yellow contour is the
dimension of the PCB. Usually, after placing pieces and traces, move them to your final position and
then cut the PCB to the correct size. However, when designing a plaque with a certain restriction of
size, cut the PCB to the right size before starting.
Fig: 5.1 Toolbar needed for interface
The select tool: it is quite obvious what this does. It allows you to move and manipulate pieces.
When this tool is selected, the upper toolbar will show buttons to move traces to the upper/lower
copper layer and turn the buttons.
The zoom tool to the selection: does that exactly.
The place pad: a button allows you to place small welding pads for custom connections or
components that are not in the pieces library, provided that the dimensions of the piece are available.
When this tool is selected, the upper toolbar will give you a large selection of round holes, square
holes and surface assembly pads.
45.
The place component:The tool allows you to select a component of the upper toolbar and then
click on the work space. The components can always be turned with the select tool if the orientation
is incorrect.
The trail of place: the tool allows you to place a solid trace on the dashboard of different
thicknesses. The upper toolbar allows you to select the upper or lower layer to place the trace.
The corner of inserting in the Trace button: does exactly what he says. When this tool is selected,
click on a trail will insert a corner that can be moved to the route around the components and other
traces.
The Delete a trace button is not very important since the delete key will achieve the same result.
5.3: Design Considerations:
A PCB can be designed in a number of ways before a project begins, and the one that best suits the
project's requirements must be selected. Is it one side or two sides?
The IoT-based water quality control system's software design must prioritize modularity, allowing
easy maintenance and scalability as more sensors or characteristics are added. It must guarantee the
acquisition and processing of real -time data, with algorithms to filter and calibrate the sensor
readings. The system needs reliable communication protocols to transmit data to the cloud, ensuring
the integrity and safety of data through encryption and access control. The user interface must be
intuitive, offering clear views and alerts, while considering energy management for energy
efficiency, especially in remote implementations. Finally, the software must have a solid handling of
errors and mechanisms for fault tolerance to ensure continuous and reliable operation.
When making a PCB, you have the option of making a single -side plate or a double -sided plate.
Single side boards are cheaper to produce and easier to record, but much more difficult to design for
large projects. If many pieces are used in a small space, it can be difficult to make a single side table
without jersey on traces with a cable. While technically there is nothing wrong with this, it should
be avoided if the signal that travels on traces is sensitive (for example, audio signals).The user
interface must be intuitive, allowing users to easily visualize water quality metrics and trends, and
receive timely alerts for abnormal conditions. Energy efficiency is also a key consideration,
46.
especially for remoteimplementations, which requires low power modes to extend battery life and
guarantee continuous operation. In addition, the software must be resistant to hardware or
connectivity problems, with failure tolerance mechanisms, ensuring that the system remains
functional even in case of sensor failure or network interruptions.
A double -face table is more expensive to produce professionally and more difficult to record on a
DIY board, but it makes the design of the components much smaller and easier. It should be
mentioned that you should check the components to make sure you can use a welder to access your
pins if a trace is executed in the upper layer.Large condensers, relays and similar parts that do not
have axial cables cannot have traces at the top unless the tables are professionally silver.
CHAPTER 6
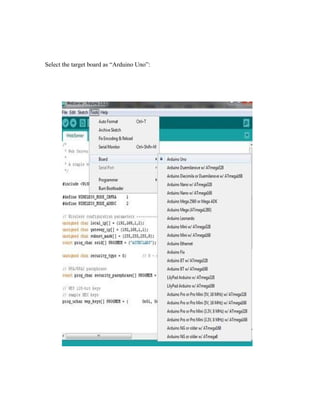
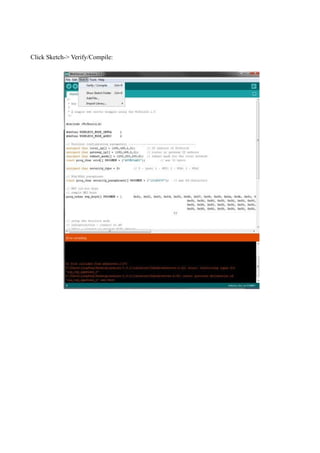
ARDUINO COMPILING
48.
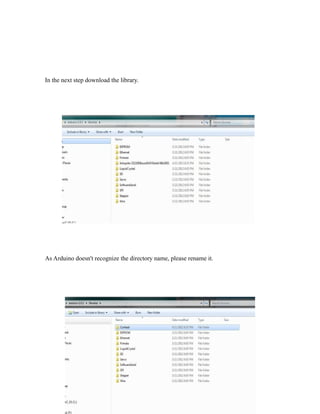
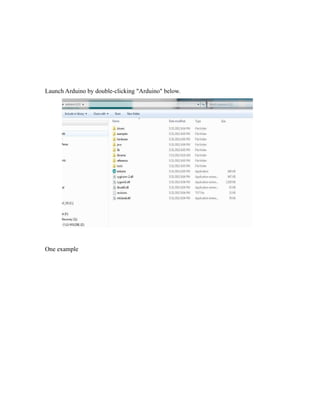
In the nextstep download the library.
As Arduino doesn't recognize the directory name, please rename it.
CHAPTER 7
RESULTS
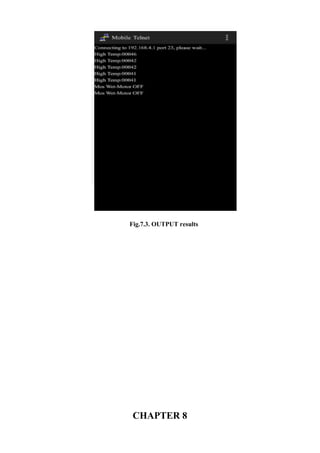
By providingreal-time monitoring and effective data management of water quality parameters,
the IoT-based water quality management system effectively satisfied its primary goals. The system
ensured accurate data collection and transfer to the cloud by continuously measuring important
parameters like pH, humidity, temperature, and water level. This allowed users to access water quality
data remotely through an intuitive board, improving accessibility and decision making. The system
alert function immediately notified users when water quality exceeded predefined safety thresholds,
allowing quick responses to possible pollution. In addition, the design incorporated electrical
efficiency solutions, such as battery savings modes and integration of solar panels, ensuring reliable
operation even in areas outside the network. Additionally, the system's scalability was shown, enabling
simple extension through the addition of additional sensors or monitoring sites without requiring major
architectural changes. In general, the project demonstrated the effectiveness of IoT technology to allow
continuous monitoring of water quality in real time, which is vital for a better management of water
resources and public health protection.
In general, a moisture/temperature range is already specified in the module data sheet, and
every time the real values are out of this range, the microcontroller automatically ignites the water
pump, which is mounted on the output pins. The microcontroller also has a united solenoid valve to
ensure that the pipes water the fields uniformly so that no area becomes obstruct or is too dry. The end
user can monitor the entire system through a Telnet and Telegram application. The smart irrigation
system makes it possible for farmers to monitor and riegen their fields remotely, without any
discomfort.
An Internet of Things (IoT)-based smart agriculture system that makes use of Telnet may
automate water monitoring by assessing soil moisture and the climate, which includes temperature and
humidity.In addition, sensor data will be displayed on the Telnet Cloud page in text format. When the
power supply is in the microcontroller, it verifies the moisture content of the soil, temperature and
humidity. If the moisture content is not up to the threshold level, it makes the engine automatically
turn on and automatically turns off if it reaches the threshold level and according to the movement of
the valve in the pipe, when the climatic condition is such that it is raining, then the microcontroller
poses from the engine to the rain. After the rain, verify the threshold value established in the system
and take the necessary action. All sensors and water data are graphically shown on the Telnet IoT
cloud page used for monitoring. We can see the sensor data in the Telegram application in the form of
text on the Android mobile phone. The advantages of this system, is a profitable irrigation controller,
54.
increases efficiency anddecreases waste, is easy to monitor, reduces the cost of man and reduces
runoff water and nutrients.
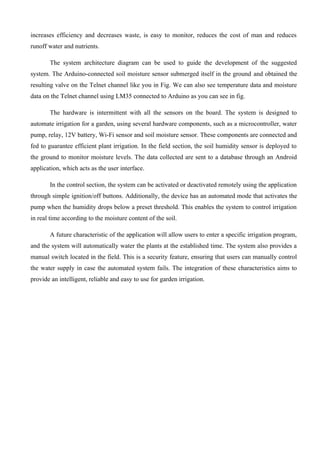
The system architecture diagram can be used to guide the development of the suggested
system. The Arduino-connected soil moisture sensor submerged itself in the ground and obtained the
resulting valve on the Telnet channel like you in Fig. We can also see temperature data and moisture
data on the Telnet channel using LM35 connected to Arduino as you can see in fig.
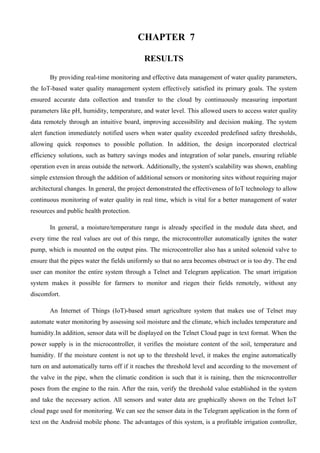
The hardware is intermittent with all the sensors on the board. The system is designed to
automate irrigation for a garden, using several hardware components, such as a microcontroller, water
pump, relay, 12V battery, Wi-Fi sensor and soil moisture sensor. These components are connected and
fed to guarantee efficient plant irrigation. In the field section, the soil humidity sensor is deployed to
the ground to monitor moisture levels. The data collected are sent to a database through an Android
application, which acts as the user interface.
In the control section, the system can be activated or deactivated remotely using the application
through simple ignition/off buttons. Additionally, the device has an automated mode that activates the
pump when the humidity drops below a preset threshold. This enables the system to control irrigation
in real time according to the moisture content of the soil.
A future characteristic of the application will allow users to enter a specific irrigation program,
and the system will automatically water the plants at the established time. The system also provides a
manual switch located in the field. This is a security feature, ensuring that users can manually control
the water supply in case the automated system fails. The integration of these characteristics aims to
provide an intelligent, reliable and easy to use for garden irrigation.
CONCLUSION AND FUTURESCOPE
8.1 CONCLUSION:
This project's IoT-based water quality control system effectively illustrates how real-time data
collection and analysis can significantly improve environmental monitoring. When integrating sensors
with IoT modules, the system continually tracks the key parameters of water quality, such as pH,
temperature and humidity, providing live updates to users through an intuitive interface.
In conclusion, the water quality management system effectively integrates modern IoT technologies to
address the growing need for continuous real -time monitoring of water quality. When using key water
parameters, cloud integration for data storage and an intuitive user interface for real -time access, the
system provides a robust solution for environmental monitoring. The system successfully guarantees a
precise collection of data, immediate alerts of abnormal conditions and a scalable implementation in
several environments. It is suitable for isolated areas with restricted access to electricity due to its
energy-efficient design, which includes solar and battery energy alternatives. This project highlights
the potential of the IoT in environmental monitoring, offering a sustainable and proactive approach to
water quality management, ultimately contributing to safer water resources and public health
protection.
Interested parties may ensure adherence to water quality regulations, identify early pollution, and take
the necessary corrective action thanks to this real-time information.The scalability and modularity of
the system also allow future improvements, such as predictive analysis and integration of AI. In
general, this project contributes to the broader objective of sustainable water management by
combining technology with environmental awareness.
.
59.
8.2 FUTURE SCOPE:
Foradditional improvement, this system is used for irrigation of large land acres. In
addition The system can be integrated to confirm that the crops and soil nutrients are growing. By
incorporating automatic learning algorithms to optimize watering, the system can be further enhanced.
Through the analysis of variables including soil humidity levels, meteorological circumstances, and
plant growth patterns, these algorithms would enable the system to learn and comprehend the unique
requirements of various crops. With these data, the system could make smart decisions, adjusting the
schedules and irrigation amounts based on real -time environmental conditions and crop requirements.
Automatic learning would make the system more predictive and adaptive, minimizing
water waste and guaranteeing that crops get the proper amount of water at the right time. This would
enable a fully automated irrigation system, which increases crop production efficiency and necessitates
less manual intervention. Long-term dependability and sustainability are increased by the system's
ability to forecast issues like drought or water-on-water.
There is a lot of room for improvement and growth in the water quality management
system's future scope with IoT. Predictive analysis may be possible with the combination of AI and
autonomous learning, enabling the system to spot new issues with water quality before they become
serious. The addition of advanced sensors to measure more parameters, such as heavy metals and
chemical pollutants, would provide a more complete evaluation of water safety. A dedicated mobile
application could be developed for easier access and notifications, while global deployment in several
bodies of water could expand its impact on environmental management. The system could also be
integrated with smart water treatment technologies to automatically adjust treatment processes based
on real -time data. Blockchain could be used to guarantee the integrity of the data, making it safer and
more transparent, while energy collection solutions would improve the autonomy of the system in
remote locations. These developments would improve system capabilities, ensuring more efficient,
sustainable and reliable water monitoring throughout the world.


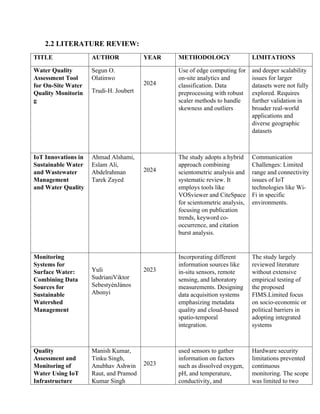
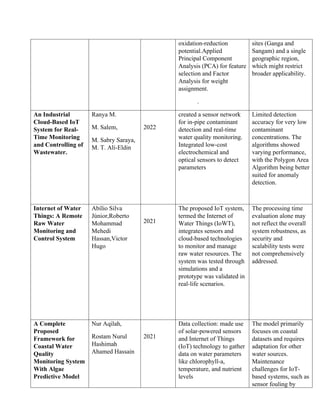
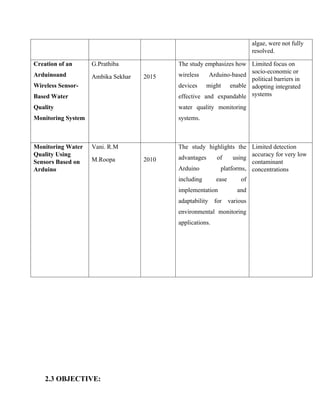
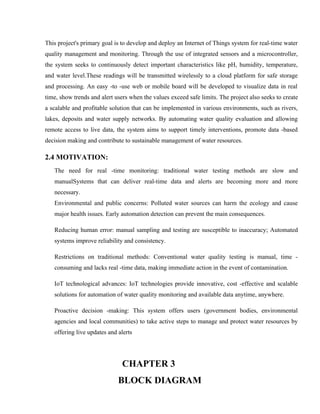
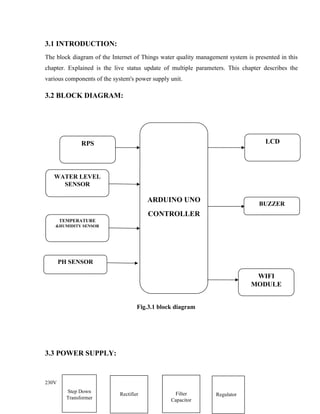
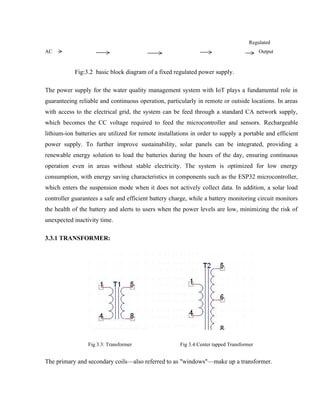
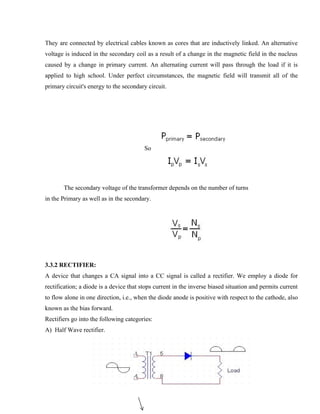
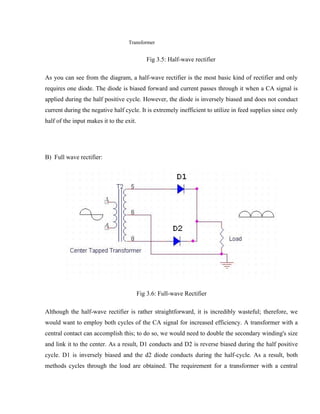
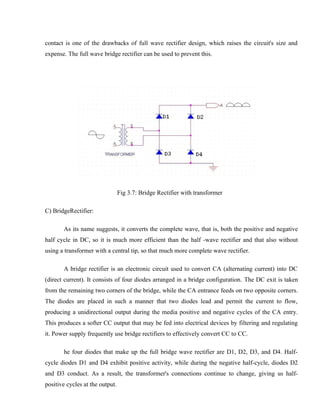
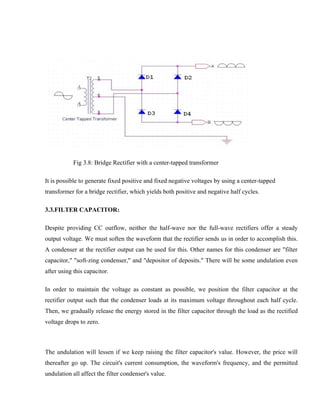
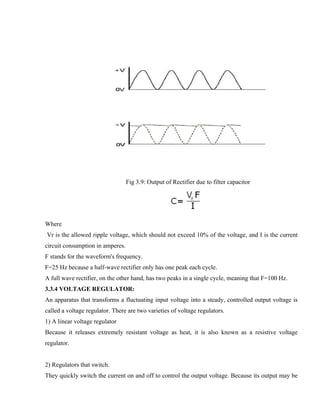
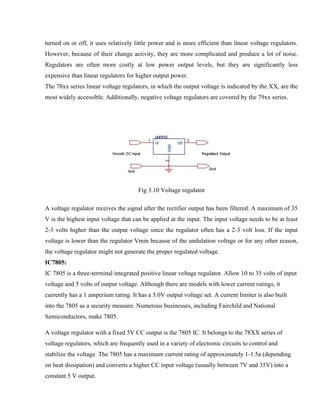
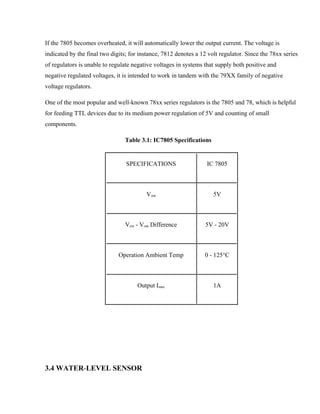
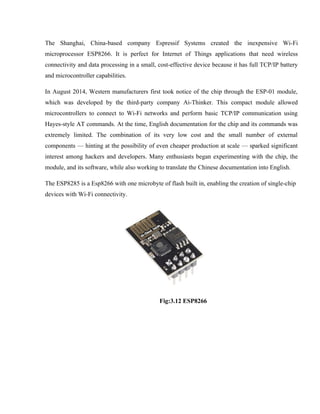
![ PROCESSOR: 32-bit RISCO Microprocessor Core operating at 80 MHz, based on the
XTENSA 106micro diamond standard [5].
Memory: or instruction for 32 kib RAM
or 16 Kib ETS System-Data Ram, 32 Kib Instruction Cache RAM, or 80 Kib RAM users
IEEE 802.11 B/G/N WI-FI or integrated switch TR, Balun, LNA, power amplifier, and
coincidence network o Wep or WPA2 authentication, or open networks
External QSPI Flash: Up to 16 MIB (512 kib at 4 mib generally included) is allowed.
I²C (software implementation);
SPI; 16
gpio pins [6]
In order to share pins with the GPIO, I²S interacts with DMA.
UART in specific pins, as well as the ability to enable a transmission UART in GPio2
10-bit ADC (ADC with a successive approach)](https://image.slidesharecdn.com/documentation2-250508094250-daa280f8/85/Documentation-on-topics-Documentation2-edited-docx-22-320.jpg)
![OPERATIONS:
Espressif Systems introduced a software development kit (SDK) in October 2014 that allowed the
chip to be programmed directly, doing away with the requirement for an additional microcontroller.
[7] Since then, Espressif has released numerous official SDK versions; the company maintains two
SDK versions: one based on call returns and the other on Fretos. [8]
The ESP-Open-Open-SDK open source tools chain, which is based on the GNU Compiler
Collection tool chain (GCC) and is maintained by Max Filippov, is an alternative to the official
Espressif SDK. [10] Mikhail Grigorev's "unofficial development kit" is an additional option. [11]
[12]
Other SDK, mostly open source, include:
Firmware based on Arduino-A C++. Like any other Arduino device, the ESP8266 CPU and its Wi-
Fi components can be programmed using this nucleus. Github offers the Arduino Esp8266 nucleus
for purchase.
• ESP8266 BASIC: An open-source, simple interpreter designed especially for the Internet of
Things (IoT). The auto-elbitrion browser serves as the basis for this development environment.
• ESP EASY: created by enthusiasts for home automation.
Efromo: El Esca is a system that uses simple yet effective configuration files to control ESP8266
and ESP32 devices. Additionally, it allows these devices to be controlled remotely using home
automation platforms.
• ESP-Open-RTos: an open source frertos-based software frame for the SP8266.
• ESP-Open-SDK: An integrated SDK for ESP8266/ESP8285 chips that is free and open to the
greatest extent feasible.
• Espruino: A Javascript firmware and SDK that closely mimics Node.js. admits ESP8266 and other
MCUs.
• The open source spurion ESP8285/ESP8266.](https://image.slidesharecdn.com/documentation2-250508094250-daa280f8/85/Documentation-on-topics-Documentation2-edited-docx-23-320.jpg)
![• Puerto de Jones outside The ESP8266 microcontroller is next.
• Micrypthon: an ESP8266 platform Micrypthon port, which is a Python implementation for
integrated devices.
An open source operating system for linked devices is Mongoose OS. ESP8266 and ESP32 are
admitted. Create in JavaScript or C. [13]
• Nodemcu: A Lua-based firmware.
• Platformio: a unified treatment plant and multiplatform that sits atop the Arduino code and
libraries.
• The ESP8266's Punyforth-Figh programming language.
SMMG: An actively developed C/C ++ asynchronous frame with several network capabilities and
outstanding performance.
• Ulisp: A LISP programming language variant created especially to run on CPUs with constrained
RAM.
• ZBASIC for ESP8266: A subset of Microsoft Visual Basic 6 that has been modified to serve as a
control language for the ESP8266 and ZX microcontroller family.
ESP8266 and other microcontrollers can be programmed in Python with Zerynth-Marco IoT.
3.6. PH SENSOR:
INTRODUCTION:
TYPE:
A PH meter, also known as a potentiometric pH meter, is a scientific device that measures the
activity of hydrogen ions in water-based solutions, indicating their acidity or alkalinity, expressed as](https://image.slidesharecdn.com/documentation2-250508094250-daa280f8/85/Documentation-on-topics-Documentation2-edited-docx-24-320.jpg)
![PH. It operates by detecting the difference in electrical potential between a pH electrode and a
reference electrode, which directly correlates to the pH level of the solution. PH meters are widely
used in a variety of fields, from industrial quality control to laboratory research.
The voltage between two electrodes is measured by the potentiometric pH meters, which then
translate this electrical signal into the appropriate pH value. These devices typically include a screen
calibrated in pH units, a pair of electrodes or a combination electrode, and a basic electrical
amplifier. Glass electrodes and reference electrodes, or a mix of both, are more frequently used in
this arrangement in a single probe. The solution under test has these electrodes placed in it. The
electrodes' design is very important; they are usually made of glass, shaped like a rod, and feature a
bulb with a sensor at the bottom.
For the concentration of hydrogen ions, the glass electrode is specifically made to be selective. The
hydrogen ions in the test solution interact with other positively charged ions in the glass bulb as they
submerge themselves in a solution. The opera pH sensor measures the voltage difference between
two electrodes, usually a glass electrode and a reference electrode, while submerged in a solution.
This ion exchange generates an electrochemical potential in the bulb, which the meter recognizes
and converts into a pH value. The amount of hydrogen ions (H ) in the water has a direct correlation
⁺
with this electrical potential. An electronic amplifier detects this potential difference and converts it
into pH units based on the Nernst equation. The resulting pH value is transmitted to the
microcontroller (for example, Arduino) for subsequent processing, storage or cloud -based
transmission. This real -time pH monitoring is essential to evaluate water quality in various
applications, including drinking water, agriculture and environmental monitoring systems.
According to the Nestn equation, the electrochemical potential through the glass bulb has a linear
relationship with pH.
The reference electrode is made out of a metallic conductor that attaches to the screen and is not
affected by the pH of the solution. An electrolyte solution, usually potassium chloride, is submerged
in this driver and comes into touch with the test solution via a porous ceramic membrane. [9] A
voltmeter that displays voltage in pH units is part of the screen.
An electrical circuit is completed when the glass electrode and reference electrode are submerged in
the test solution; in this circuit, the voltmeter generates and detects a potential voltage. It can be said](https://image.slidesharecdn.com/documentation2-250508094250-daa280f8/85/Documentation-on-topics-Documentation2-edited-docx-25-320.jpg)
![that the circuit that emerges from the reference electrode's conductive element links to the potassium
chloride solution around it and then makes contact with the test solution via the ceramic membrane.
olution, the glass electrode's selective hydrogen ion glass, the solution inside the glass electrode, the
glass of the glass electrode, and lastly, the visualization device's voltage. The potential difference
produced by the variation in the amounts of hydrogen ions on each side of the glass membrane
between the test solution and the solution inside the glass electrode determines how much the
voltage changes from one test solution to another. The pH has no effect on any other possible
variations in the circuit, which are fixed by calibration.
To make things simpler, a lot of pH meters employ a combined probe, which combines the reference
electrode and glass electrode into one unit. The combination electrodes on glass electrodes are
described in full in the article.
To ensure measurement accuracy, the pH meter is calibrated using known pH solutions, usually
before to each use. [11] The electrodes are used as probes to measure the pH of a solution. They are
submerged in the test solutions and left there long enough for the hydrogen ions in the test solution
to balance with the ions on the glass electrode's bulb surface. The pH is measured steadily by this
balance.
pH ELECTRODE AND REFERENCE ELECTRODE DESIGN:
The producers have strict control over the production process and the microstructure that
results from the glass membrane in the pH electrodes. Nonetheless, some elements of the design are
openly accessible. Alkaline ions can carry the current through the glass used in pH electrodes
because it functions as a solid electrolyte. In order to provide a consistent membrane shape and
streamline the production process, the pH-sensitive glass membrane is usually spherical. To increase
durability, these membranes are frequently up to 0.4 millimeters thicker than their predecessors.
Alkaline and hydrogen ions in the solution can bond to the glass surface thanks to its chemical
silicate activity. As a result, an ion exchange capacity between 10−610^{-6} 10−6 and 10−810^{-8}
10−8 mol/cm² is produced. Ionic load, ionic volume, and the coordination number—the number of
ions linked to other ions—all contribute to selectivity for hydrogen ions (H ). Manufacturers of
⁺
electrodes utilize patented glass compositions to maximize these properties; lithium glass is one of
the most popular and efficient.](https://image.slidesharecdn.com/documentation2-250508094250-daa280f8/85/Documentation-on-topics-Documentation2-edited-docx-26-320.jpg)
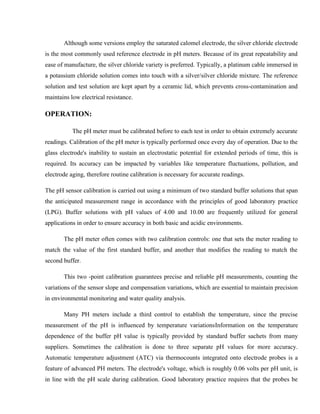
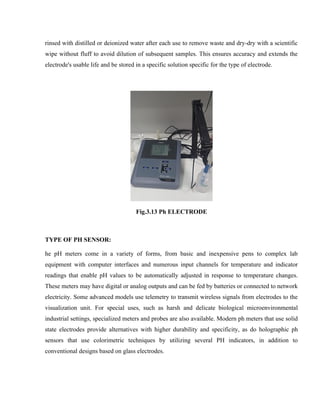
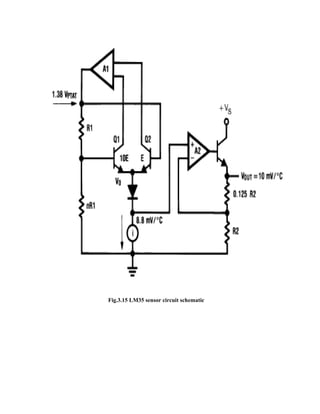
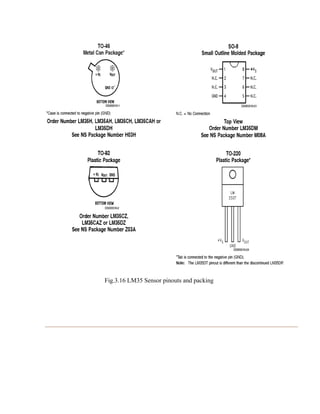
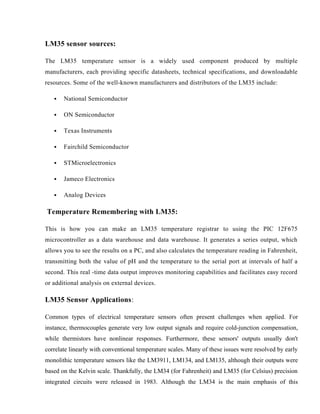
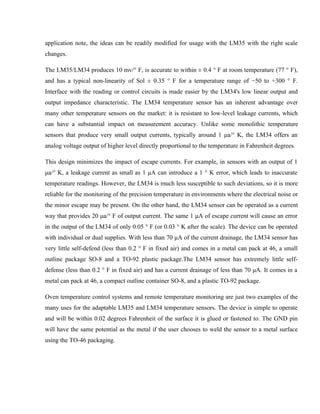
![name originated. Arduin de Ivrea, the Margrave of the March of Ivrea and the king of Italy from
1002 to 1014, is honored by the bar's name.
Fig.4.1. Arduino Hardware image.
4.2 HISTORY:
The Interaction Design Institute Ivrea (IDII) in Ivrea, Italy, was the birthplace of the Arduino project
in 2003. The students at the time had faith in the simple seal microcontroller, which costs about $50,
a substantial sum for many. As part of his Master's thesis in IDII, Hernando Barragán worked with
Massimo Banzi and Casey reality to develop the wiring platform in order to make it more accessible
and affordable. Reas, who co-founded the processor development environment with Ben Fry, helped
achieve the wiring's goal of enabling non-engineers to produce digital products with basic tools.
An ATMEGA168 microcontroller, a printed circuit plate (PCB), an IDE built on processing, and a
collection of programming libraries were all merged in the wiring. Massimo Banzi, David Mellis,
and David Cuartieles later introduced support for the ATMEGA8 microcontroller, which is the most
profitable, in 2003. They decided to split the project instead of carrying on with the wiring, which is
how Arduino came to be.
Massimo Banzi, David Cuartieles, Tom Igooe, Gianluca Martino, and David Mellis made up the
first Arduino Core team [2], however Barragán was not asked to join.
Lighter and less costly variants of the wiring platform were released into the open source
community once it was finished. More than 300,000 official Arduinos were reportedly commercially](https://image.slidesharecdn.com/documentation2-250508094250-daa280f8/85/Documentation-on-topics-Documentation2-edited-docx-36-320.jpg)