SlideShare a Scribd company logo
1 of 6
Download to read offline
International Research Journal of Engineering and Technology (IRJET) e-ISSN: 2395-0056
Volume: 06 Issue: 06 | June 2019 www.irjet.net p-ISSN: 2395-0072
© 2019, IRJET | Impact Factor value: 7.211 | ISO 9001:2008 Certified Journal | Page 1226
Mode choice Behaviour Analysis of Students in Thrissur city
Jerry Soman1, Vincy Verghese2
1PG scholar, Dept of Civil Engineering, JECC Cheruthuruthy, Kerala, India
2Assistant Professor, Dept of Civil Engineering, JECC Cheruthuruthy, Kerala, India
---------------------------------------------------------------------***------------------------------------------------------------------
Abstract – Travel behaviour plays an important role in
transportation planning. Modechoiceanalysisistheprocessof
arriving at a decision about which mode to use under a set of
circumstances. Choice of a particular mode by a student
affects the general efficiency of travel within the city. Main
objective of the study is to find out the travel pattern, identify
the factors to choose the mode and predict the model. Various
techniques are available for mode choice modelling.
Multinomial logit models are found to be efficient in
estimating the different mode sharesinascenariowheremore
than two choices of modes of travel are availableforastudent.
Multinomial logistic regression is to analyse the mode choice
behaviour of students in Thrissur city. SPSS is used to develop
the model for different modes.
Keywords: Travel behaviour, SPSS, Multinomial logit
model
1.INTRODUCTION
Transportation modellings plays an vital role in planning.
Major roles of transportation modelling are forecasting
travel demand based on variations in the transportation
planning system. Different types of models are there that
have been developed to create actual travel patterns of
people and existing conditions. Models are used to predict
changes in travel pattern and utility of the transportation
system. Thrissur city is the third largest urban
agglomeration in Kerala about 1,854,783 population and
the 20th largest in India. There are several number of
schools within the city and outside the city. Mode choice
behaviour of students in urban and rural area is different.
The sex ratio of male and femaleis1092:1000.Development
of models in rural and urban region helps the transportation
planners to add in transport policies. And after work trips
the second most occurrence of congestion are school tripsat
the peak time. Forecasting will help to design the transport
planning systems and considering the travel behaviour of
the study area. It also helps to develop a system that can
accommodate the travel demand forthefuture.Theproblem
faced is incomplete information that makes the uncertain
conditions. If we need to reach on predictability; it can be
achieved through the probability of individual decision and
its leading characteristics. However, private automobiles
remain the predominant school travel mode (45.3%mode
share) followed by school buses (39.4 %), while walking or
bicycling together account for only 12.7% of the total school
transportation mode share in the USA as in 2000.Inaddition
to personal and social factors such as parents’ education,
income and attitudes, children’s age, race, gender and
attitudes, and peer influence studies have found many built
environmental factors associated with school travel
behaviours. Environmental approaches to promote walking
to or from school have become increasinglypopularwiththe
recognition that a safe environment is a prerequisite to any
promotional efforts. Further, environmental improvements
are relatively permanent and can lead to population-level
changes over time if successful. Among the environmental
correlates, home-to-school distance has shown to be the
most consistent and often the strongest predictor of school
travel mode choice, followed by safety and weather
.However, shortening the distance to school is not simple. It
requires long-term, multilevel policy and environmental
changes, such as school sitting, zoning, and land
development policies.
1.1 Objectives
The main objectives of the study are:
‱ Study the mode choice behaviour of students
‱ Identifying the various factorsthatcontributetothe
selection of a particular mode in the city for
educational trips.
‱ To develop a model to predict the mode choice
behaviour of students Thrissur city for both rural
and urban region
Before you begin to format your paper, first write and save
the content asa separate text file. Keep your textand graphic
files separate until after the text has been formatted and
styled. Do not use hard tabs, and limit use of hard returns to
only one return at the end of a paragraph. Do not add any
kind of pagination anywhereinthepaper.Donotnumbertext
heads-the template will do that for you.
Finally, complete content and organizational editing before
formatting. Please take note of the following items when
proofreading spelling and grammar:
2. LITERATURE SURVEY
The access travel characteristics are discussed with respect
to mode use pattern, availability of access modes,
satisfaction with the access environmentandcharacteristics
of the access leg of a trip in comparison to primary and
egress legs. Acceptable trip lengths by walk and bicycle
International Research Journal of Engineering and Technology (IRJET) e-ISSN: 2395-0056
Volume: 06 Issue: 06 | June 2019 www.irjet.net p-ISSN: 2395-0072
© 2019, IRJET | Impact Factor value: 7.211 | ISO 9001:2008 Certified Journal | Page 1227
modes in accessing transit stations are computed from their
cumulative frequency distribution of trip lengths. The
commuters are segmented into different socio economic
subgroups using characteristics like occupation, type of
house, vehicle availability and household income. The mean
and acceptable walking and bicycling distances found for
different subgroups.(Rajat Rastogi and K V Krishna Rao
,2003)
Matched home locations and different school travel modes
were examined using conditional logistic regressions.
Despite the same/similar objectivelymeasureddistanceand
home location, perceptions of distance, sidewalk and traffic
conditions, park presence, and convenience of walking
differed between walkers and automobile users Parental
attitudes and children’s preferences were associated with
the odds of walking. Safety concerns(traffic danger,stranger
danger, and getting lost) were higher among drivers, but
only significant in bivariate analyses. To promotewalking to
school, route/street improvements appear promising, but
parallel educational and promotional efforts may be needed
to address perceptual and attitudinal barriers.(Chanam lee
and jeongjae yoon ,2013)
3. METHODOLOGY
The work intends to find a proper model forstudentstrips to
predict the future travel demand and finding important
characteristics. It is aimed at identifying various factors that
contribute to the selection of a particular mode in the city..
MNL modelling was adopted in the study because of its
capability in estimating the mode shares where more than
two choices of modes of travel.The first phase is researching
for topic and study literature, and then data was collected
data of Thrissur city. Preliminary analysis is done to study
the data. Student trips are distributed on different modes-
Two wheeler, bus, car, three-wheeler, cycle and walk.
Validation is the process of checking the model for its
accuracy in prediction. The last phase is concluding the
study. Numbers of studies were done under transportation
planning and selectively on mode choice behaviour,
integration of multi-modes, Intra-city level characteristics
and attitudinal behaviour. To develop better model needs
good data collection. As the data increases the model gives
better output. The method used for data collection to
development model formodechoiceisquestionnairesurvey.
Total number of student tripsgettingfromtheschool is1200
.The available questionnaire survey data contains data of
travel characteristics as well as traveller characteristics.
From the data, the important variables were needed to
identify. The consideredtravel characteristicsaretotal travel
time, travel cost, distance, vehicle ownership, gender, age
and income. Model development is the most important step
in this study and it is done by the help of Statistical package
system software . The models used to study the modechoice
behaviour are multinomial logit model. The common
modelling method for mode choice are Multinomial Logit
model(MNL) due to it leads to simpler, providing more
economic model and increasing the power to detect the
relationships with other variables. The most preferred
softwares used for multinomial logit models are SPSS
(Statistical Package for the social sciences). The developed
model should be validated.
4. DATA COLLECTION
Assuming the population to be normally distributed,
empirical formulas given by Levy and Lemeshow (2008)
[shown in Eqs. (2) and (3) were used to determine the
sample size.
(2)
where n0 = sample size for infinite population; Z = statistical
parameter corresponding to confidence level (Z is 1.96 for
95% confidence interval); e = desired margin of error
(adopted as 5%); p = hypothesized true proportion for
population (adopted as 0.5 to account for the worst case)
and
q = 1- p n (3)
where n = sample size for finite population; N = population
size.
For a very good model, study needs large quantity of data.In
this a questionnaire form is prepared forstudentstofindout
their travel behaviour, factors which influence to select the
mode.From the google map, names of the schools are got.
From the number of schools, schools of mixed students are
taken for the survey. Eliminate girls and boys only school
from the list. Then select the schools which are in
corporation ward. From that, schools are divided into urban
schools and rural schools. After that from urban area, 4
schools are selected and from rural area, 4 schools are
selected. From the selected schools 50 samples from each
section (upper primary, high school and higher secondary)
are collected. Total number of samples are 150 from each
school. Urban area and rural area is determined by whether
there is residential buildings, commercial buildings and
highway. Four schools from urban area and four schools
from rural area are randomly selected to collect the data.
The questionnaire format is shown below. As the data
increases model gives better output. Questionnaire format
include travel characteristics, travellers characteristics.
From the data important variables were needed to identify.
Questionnaire surveys involve collecting the information
regardinghouseholdcharacteristics,personal characteristics
and the travel decisions made in the recent past.
International Research Journal of Engineering and Technology (IRJET) e-ISSN: 2395-0056
Volume: 06 Issue: 06 | June 2019 www.irjet.net p-ISSN: 2395-0072
© 2019, IRJET | Impact Factor value: 7.211 | ISO 9001:2008 Certified Journal | Page 1228
5. DATA ANALYSIS
Stratification of the collected samples is discussed in the
following sections. The collected data is entered in the
Microsoft excel and the preliminary analysis is done. Data
analyses are the process of identifying the right data for
achieving the objective of the study. It is the process of
obtaining raw data and converting into useful information
and used for mode choice modellingwhichhelpsfordecision
making process. Data was collected through questionnaire
survey and the objective is to find the most influencing
variables on the mode choice behaviour of students and to
develop a model of student mode choice in Thrissur City.
The collected data is organised into a format given in the
following tables to fit for analysis within a spread sheet for
easy data processing. The data are divided into categories
and coding is done for easy analysis. Table shows different
categories of mode, gender, age, income,distanceandvehicle
ownership.The analysis was done by Microsoft excel using
filtration tool. Preliminary analysis is done on the data. The
data is presented graphicallyforgenderwisemodeselection,
age wise mode selection, income wise mode selection ,
distance wise mode selection.
Table -1: Categories and coding pattern for the study
Categories Coding pattern
Mode Two wheeler 1
Car 2
Bus 3
Cycle 4
Auto 5
Van 6
Walk 7
Gender (G) Male 1
Female 2
Age (A) 10-12 1
13-15 2
Preliminary analysis is done on the data. The data is
presented graphically for urban and rural region based on
mode split
Fig -1: Mode split
Mode split data is the primary step of mode choice
modelling. Most students prefers bus (67.83%) as their
mode of choice. 4.85% of students are preferring cycle as
their mode , three wheeler and van have 16.24% and
0.333%.walking and bike have 4.35% and 0.16%. from this
graph we can clearly identified that more percentage of
urban students are using bus as their mode and least
percentage of mode choosing is for two wheeler.
Preliminary analysis of Rural region:
Fig -2: Mode split
Mode split data is the primary step of mode choice
modelling. Most students prefers bus (44.83%) as their
mode of choice. 5% of students are preferring cycle as their
mode , three wheeler and van have 6.16% and
0.167%.walking and bike have 41.5% and 0.5%. from this
graph we can clearly identifiedthatmorepercentageof rural
region students are using bus as their mode .
6. MODEL DEVELOPMENT
Mode choice modeling is the third important steps of the
transportation planning after trip generation and trip
distribution. Mode choice modelling helps to find the
traveller‘s choice of mode. For modeling the mode choice,
there is need of proper analysis of the data. Modelling
predicts how road users will split themselves between
transits and other vehicles. Mode choice modeling is to be
done by identifying different modes, identifying the
International Research Journal of Engineering and Technology (IRJET) e-ISSN: 2395-0056
Volume: 06 Issue: 06 | June 2019 www.irjet.net p-ISSN: 2395-0072
© 2019, IRJET | Impact Factor value: 7.211 | ISO 9001:2008 Certified Journal | Page 1229
attributes and characteristics and constructing an
experimental design that is appropriate for those attributes
and characteristics. Before doing the model coorelation of
variables have to be found out.When using MNL regression,
one category of the dependent variable is chosen as the
reference category. All parameters in the model are
interpreted with reference to it. It is the standard/reference
category to which others (response category) would
naturally be compared. The coefficients are estimated
through an iterative maximum likelihood method. Odds
ratios are determined for all independent variables for each
category of the dependent variable except the reference
category. Odds ratio represents the change in the odds of
being in the dependent variable category versus the
reference category associated with a one unit change in the
independent variable. In analysis, the mode of conveyance
is chosen as dependent variable,astheproblemisconcerned
with choice of mode. In order to get the preference of bus
relative to other modes, bus is chosen as the reference
category. Bus was compared
Table -2: The likelihood ratio test for Urban region
with car and two-wheeler separately to understand the
factors The independent variables chosen are age group,
gender, income, vehicle ownership, distance, travel time,
travel cost, level of education,reason,
It can be found that only travel time have significance less
than 0.05. So we can conclude that the travel time used in
the model have significant contribution toward predicting
the mode choice behaviour of students in urban region.
From table variables of urban model MNL regression model
of car in relation with bus,the factor travel time has a
positive coefficient of 0.780, which means increase in travel
time, students are choosing car over bus as their mode of
travel. The odds ratio obtained in the output of travel time is
2.182, indicating that for each unit of increase in travel time,
the mode choice of students increase by 2.182 times.InMNL
regression model of auto in relation with bus, the factor
travel time has a positive coefficient of 0.663, which means
increase in travel time, students are choosing auto over bus
as their mode of travel. The odds ratio obtainedintheoutput
of travel time is 1.940, indicating that for each unit of
increase in travel time, the mode choice of students increase
by 1.940 times. The factor reason=1 has a negative
coefficient of 1.931, which meansstudentsarechoosingauto
over bus as their mode of travel because the reason comfort.
The odds ratio obtained in the output of reason is 0.145,
indicating that students are lesser comfort with the mode
auto by 0.145 times over bus. In MNL regression model of
walk in relation with bus the factor travel time has a
negative coefficient of 0.723, which meansdecreaseintravel
time, students are choosing walk over bus as their mode of
travel. The odds ratio obtained in the output of travel time is
2.062, indicating that for each unit of decreaseintravel time,
the mode choice of students decrease by 2.062 times.
Table 3 shows a statistical comparison of intercept-only
model and final model. Intercept only describesa model that
does not include any predictor variables and simply fits an
intercept to predict the output variable. Final describes a
model that includes the specifiedpredictorvariablesand has
been arrived at through an iterative process that maximizes
the log likelihood of the outcomes seen in the output
variable. By including the predictor variables and
maximizing the log likelihood of the outcomes seen in the
data, the final model is an improvement on the intercept-
only model. The likelihood ratio test shows the contribution
of each variable to the model. This fact is revealed by the
statistical tests on the two models as given in Table.Thechi-
square statistic is the difference between the –2 log-
likelihoods of the null/intercept-only and final models.
Because the significance level of the test is less than 0.05, it
can be concluded that the final model is outperforming the
null model.The pseudo R2 value of the final model according
to Nagelkerke for urban model are 0.500 and pseudo R2
value for rural model are 0.400. Pseudo R2 value indicates
the proportion of variance of the response variable
explained by the predictors and its maximum value is 1.
Larger pseudo R2 statisticsindicatethatlargerpercentageof
variation can be explained by the model.
Model Fitting
Criteria
Likelihood Ratio Tests
Effect -2 Log
Likelihood of
Reduced
Model
Chi-
square
df Sig
Intercept 374.224a 0.000 0
Income 380.207b 5.982 5 0.308
Distance 378.265 4.041 5 0.544
Travel Time 396.847 22.622 5 0.000
Vehicle
ownership
375.159b 0.934 5 0.968
Traffic 377.164 2.939 5 0.709
Comfort 378.376b 4.151 5 0.528
Level Of
Education
380.134 5.910 5 0.315
Reason 397.175 22.951 20 0.291
International Research Journal of Engineering and Technology (IRJET) e-ISSN: 2395-0056
Volume: 06 Issue: 06 | June 2019 www.irjet.net p-ISSN: 2395-0072
© 2019, IRJET | Impact Factor value: 7.211 | ISO 9001:2008 Certified Journal | Page 1230
Comfort level and traffic. The independent variables are
classified into various categories.The likelihood ratio tests
that show the contribution of each variable to the model of
urban area are shown below.
Table -3: Values of likelihood ratio tests for Urban area:
Model fitting
criteria
Likelihood ratio tests
Model -2 log
likelihood
Chi square df Sig
Intercept
only
475.860
Final 374.224 101.636 55 0.000
Utility equation for Urban model
U(Car) = 0.78*TT
U(Auto) = 0.663*TT-1.931*R1
U(Walk) = -0.723*TT
Table -4: Variables for urban region
6.1 validation
From the 1200 data collected analysisisperformed bytaking
800 samples and remaining 400 aretakenforvalidation.The
procedure followed by validation is given below:
i. Score of the utility model is found out
ii. Found out the mode choice of students using this
equation.
P(Y=1) =
iii. Maximum value of each mode is taken as predicted
output
iv. Compared the value of observed and predicted
v. Determine the prediction percentage
vi. prediction percentage for rural model is 72.5% and
for urban model it is 42.85%
7. CONCLUSIONS
The study Mode Choice behaviour of students in Thrissur
City‖ aims at developing a model for school in Thrissur city
using SPSS software. The study considered some selected
modes only which are dominant. The main conclusions
drawn from the study are:
 Factors influencing the mode choice of students in
rural region are age, gender, level of education,
distance ,travel time, comfort and travel cost
 Factors influencing the mode choice of students in
urban region are income, distance, travel time,
vehicle ownership,traffic,reasonforchoosingmode
and comfort level.
 Common variables coming under urban and rural
model are distance and travel time.
 Both rural and urban region most of the students
are using bus as their mode of travel.
REFERENCES
[1] Guerraa, E.,(2018).”Urban form, transit supply, and
travel behaviorinLatinAmerica:EvidencefromMexico's
100 largest urban areas”Transport Policy 69 ,98–105
[2] V Sohonia,A., Thomasa,M.,(2017)”Modeshiftbehaviorof
commuters due to the introduction of new railtransit
mode”Transportation Research Procedia , 2603–2618
[3] K.M. Keyes,A., Crawford-Brown,D.,(2018)“Thechanging
influences on commuting mode choice inurbanEngland
under Peak Car: A discrete choice modelling
approach”Transportation Research Part F ,167–176
[4] Roider,O.,Rudloff,C.,(2012),“an individualized travel
information systemfor optimizing mode and route
choice behaviour of commuters” Procedia - Social and
Behavioral Sciences ,1948 – 1957
[5] Xianyua,J.,(2013).”An exploration of the
interdependencies between trip chaining behavior and
travel mode choice”Procedia - Social and Behavioral
Sciences,1967 – 1975
[6] Ding,L., Zhang,N.,“A Travel Mode Choice Model Using
Individual Grouping Based on
Cluster Analysis”Procedia Engineering ,786 – 795
International Research Journal of Engineering and Technology (IRJET) e-ISSN: 2395-0056
Volume: 06 Issue: 06 | June 2019 www.irjet.net p-ISSN: 2395-0072
© 2019, IRJET | Impact Factor value: 7.211 | ISO 9001:2008 Certified Journal | Page 1231
[7] Kaewkluengkloma,R.,Satiennamb,W.,(2017),”Influence
of psychological factors on mode choice behaviour:Case
study of BRT in Khon Kaen City,
Thailand”TransportationResearchProcedia ,5072–5082
[8] Sreerag ,S., Sachdeva,S.,”Mode Choice Modelling for
Work Trips in Thiruvanthpuram City”journalof Basic
and Applied Engineering Research ,Vol 3, Issue 4
[9] Verma,M., Manoj,M.,(2016),“Analysisoftheinfluencesof
attitudinal factors on car ownership decisions among
urban young adults in a developing country like India”
Transportation Research Part F , 90–103

More Related Content

Similar to IRJET- Mode Choice Behaviour Analysis of Students in Thrissur City

IRJET- Pedestrian Safety Analysis at School Zones
IRJET-  	  Pedestrian Safety Analysis at School ZonesIRJET-  	  Pedestrian Safety Analysis at School Zones
IRJET- Pedestrian Safety Analysis at School ZonesIRJET Journal
 
Student Performance Prediction via Data Mining & Machine Learning
Student Performance Prediction via Data Mining & Machine LearningStudent Performance Prediction via Data Mining & Machine Learning
Student Performance Prediction via Data Mining & Machine LearningIRJET Journal
 
PPT - Chetan D - Format for PPT for phase one presentation
PPT - Chetan D - Format for PPT for phase one presentationPPT - Chetan D - Format for PPT for phase one presentation
PPT - Chetan D - Format for PPT for phase one presentationSuhasRamachandra10
 
Bicycle Infrastructure Improvement Study and Implementation Plan
Bicycle Infrastructure Improvement Study and Implementation PlanBicycle Infrastructure Improvement Study and Implementation Plan
Bicycle Infrastructure Improvement Study and Implementation PlanZack Lofton, AICP, CNU-A
 
Women’s Perceptions of Metro Rail Service Quality using Structural Equation M...
Women’s Perceptions of Metro Rail Service Quality using Structural Equation M...Women’s Perceptions of Metro Rail Service Quality using Structural Equation M...
Women’s Perceptions of Metro Rail Service Quality using Structural Equation M...IRJET Journal
 
IRJET- A Review on Feasibilty Study on Facilities for Pedestraians at Iblur J...
IRJET- A Review on Feasibilty Study on Facilities for Pedestraians at Iblur J...IRJET- A Review on Feasibilty Study on Facilities for Pedestraians at Iblur J...
IRJET- A Review on Feasibilty Study on Facilities for Pedestraians at Iblur J...IRJET Journal
 
IRJET - Recommendation of Branch of Engineering using Machine Learning
IRJET - Recommendation of Branch of Engineering using Machine LearningIRJET - Recommendation of Branch of Engineering using Machine Learning
IRJET - Recommendation of Branch of Engineering using Machine LearningIRJET Journal
 
Analysis of Learning Behavior Characteristics and Prediction of Learning Effe...
Analysis of Learning Behavior Characteristics and Prediction of Learning Effe...Analysis of Learning Behavior Characteristics and Prediction of Learning Effe...
Analysis of Learning Behavior Characteristics and Prediction of Learning Effe...Shakas Technologies
 
Factors influencing actual use of
Factors influencing actual use ofFactors influencing actual use of
Factors influencing actual use ofcsandit
 
IRJET- Review on Assessment of Mode Shift Behavior due to Introduction of New...
IRJET- Review on Assessment of Mode Shift Behavior due to Introduction of New...IRJET- Review on Assessment of Mode Shift Behavior due to Introduction of New...
IRJET- Review on Assessment of Mode Shift Behavior due to Introduction of New...IRJET Journal
 
IRJET- Review on Assessment of Mode Shift Behavior due to Introduction of...
IRJET-  	  Review on Assessment of Mode Shift Behavior due to Introduction of...IRJET-  	  Review on Assessment of Mode Shift Behavior due to Introduction of...
IRJET- Review on Assessment of Mode Shift Behavior due to Introduction of...IRJET Journal
 
A Study on Data Mining Techniques, Concepts and its Application in Higher Edu...
A Study on Data Mining Techniques, Concepts and its Application in Higher Edu...A Study on Data Mining Techniques, Concepts and its Application in Higher Edu...
A Study on Data Mining Techniques, Concepts and its Application in Higher Edu...IRJET Journal
 
Formulating a trip production prediction model for the residential land use i...
Formulating a trip production prediction model for the residential land use i...Formulating a trip production prediction model for the residential land use i...
Formulating a trip production prediction model for the residential land use i...eSAT Journals
 
Formulating a trip production prediction model for
Formulating a trip production prediction model forFormulating a trip production prediction model for
Formulating a trip production prediction model foreSAT Publishing House
 
Sustainability 12-07535 (1)
Sustainability 12-07535 (1)Sustainability 12-07535 (1)
Sustainability 12-07535 (1)saali5984
 
PERCEPTION TOWARDS MOBILE LEARNING ACTIVITIES AMONG POST GRADUATE STUDENTS
PERCEPTION TOWARDS MOBILE LEARNING ACTIVITIES AMONG POST GRADUATE STUDENTSPERCEPTION TOWARDS MOBILE LEARNING ACTIVITIES AMONG POST GRADUATE STUDENTS
PERCEPTION TOWARDS MOBILE LEARNING ACTIVITIES AMONG POST GRADUATE STUDENTSThiyagu K
 
Recognition of Slow Learners Using Classification Data Mining Techniques
Recognition of Slow Learners Using Classification Data Mining TechniquesRecognition of Slow Learners Using Classification Data Mining Techniques
Recognition of Slow Learners Using Classification Data Mining TechniquesLovely Professional University
 

Similar to IRJET- Mode Choice Behaviour Analysis of Students in Thrissur City (20)

IRJET- Pedestrian Safety Analysis at School Zones
IRJET-  	  Pedestrian Safety Analysis at School ZonesIRJET-  	  Pedestrian Safety Analysis at School Zones
IRJET- Pedestrian Safety Analysis at School Zones
 
Student Performance Prediction via Data Mining & Machine Learning
Student Performance Prediction via Data Mining & Machine LearningStudent Performance Prediction via Data Mining & Machine Learning
Student Performance Prediction via Data Mining & Machine Learning
 
PPT - Chetan D - Format for PPT for phase one presentation
PPT - Chetan D - Format for PPT for phase one presentationPPT - Chetan D - Format for PPT for phase one presentation
PPT - Chetan D - Format for PPT for phase one presentation
 
Masters Dissertation Posters 2017
Masters Dissertation Posters 2017Masters Dissertation Posters 2017
Masters Dissertation Posters 2017
 
Ijmet 10 01_063
Ijmet 10 01_063Ijmet 10 01_063
Ijmet 10 01_063
 
Bicycle Infrastructure Improvement Study and Implementation Plan
Bicycle Infrastructure Improvement Study and Implementation PlanBicycle Infrastructure Improvement Study and Implementation Plan
Bicycle Infrastructure Improvement Study and Implementation Plan
 
Women’s Perceptions of Metro Rail Service Quality using Structural Equation M...
Women’s Perceptions of Metro Rail Service Quality using Structural Equation M...Women’s Perceptions of Metro Rail Service Quality using Structural Equation M...
Women’s Perceptions of Metro Rail Service Quality using Structural Equation M...
 
IRJET- A Review on Feasibilty Study on Facilities for Pedestraians at Iblur J...
IRJET- A Review on Feasibilty Study on Facilities for Pedestraians at Iblur J...IRJET- A Review on Feasibilty Study on Facilities for Pedestraians at Iblur J...
IRJET- A Review on Feasibilty Study on Facilities for Pedestraians at Iblur J...
 
IRJET - Recommendation of Branch of Engineering using Machine Learning
IRJET - Recommendation of Branch of Engineering using Machine LearningIRJET - Recommendation of Branch of Engineering using Machine Learning
IRJET - Recommendation of Branch of Engineering using Machine Learning
 
Analysis of Learning Behavior Characteristics and Prediction of Learning Effe...
Analysis of Learning Behavior Characteristics and Prediction of Learning Effe...Analysis of Learning Behavior Characteristics and Prediction of Learning Effe...
Analysis of Learning Behavior Characteristics and Prediction of Learning Effe...
 
Factors influencing actual use of
Factors influencing actual use ofFactors influencing actual use of
Factors influencing actual use of
 
IRJET- Review on Assessment of Mode Shift Behavior due to Introduction of New...
IRJET- Review on Assessment of Mode Shift Behavior due to Introduction of New...IRJET- Review on Assessment of Mode Shift Behavior due to Introduction of New...
IRJET- Review on Assessment of Mode Shift Behavior due to Introduction of New...
 
IRJET- Review on Assessment of Mode Shift Behavior due to Introduction of...
IRJET-  	  Review on Assessment of Mode Shift Behavior due to Introduction of...IRJET-  	  Review on Assessment of Mode Shift Behavior due to Introduction of...
IRJET- Review on Assessment of Mode Shift Behavior due to Introduction of...
 
A Study on Data Mining Techniques, Concepts and its Application in Higher Edu...
A Study on Data Mining Techniques, Concepts and its Application in Higher Edu...A Study on Data Mining Techniques, Concepts and its Application in Higher Edu...
A Study on Data Mining Techniques, Concepts and its Application in Higher Edu...
 
PHD PRE COURSE WORK -AIS presentation.ppt
PHD PRE COURSE WORK -AIS presentation.pptPHD PRE COURSE WORK -AIS presentation.ppt
PHD PRE COURSE WORK -AIS presentation.ppt
 
Formulating a trip production prediction model for the residential land use i...
Formulating a trip production prediction model for the residential land use i...Formulating a trip production prediction model for the residential land use i...
Formulating a trip production prediction model for the residential land use i...
 
Formulating a trip production prediction model for
Formulating a trip production prediction model forFormulating a trip production prediction model for
Formulating a trip production prediction model for
 
Sustainability 12-07535 (1)
Sustainability 12-07535 (1)Sustainability 12-07535 (1)
Sustainability 12-07535 (1)
 
PERCEPTION TOWARDS MOBILE LEARNING ACTIVITIES AMONG POST GRADUATE STUDENTS
PERCEPTION TOWARDS MOBILE LEARNING ACTIVITIES AMONG POST GRADUATE STUDENTSPERCEPTION TOWARDS MOBILE LEARNING ACTIVITIES AMONG POST GRADUATE STUDENTS
PERCEPTION TOWARDS MOBILE LEARNING ACTIVITIES AMONG POST GRADUATE STUDENTS
 
Recognition of Slow Learners Using Classification Data Mining Techniques
Recognition of Slow Learners Using Classification Data Mining TechniquesRecognition of Slow Learners Using Classification Data Mining Techniques
Recognition of Slow Learners Using Classification Data Mining Techniques
 

More from IRJET Journal

TUNNELING IN HIMALAYAS WITH NATM METHOD: A SPECIAL REFERENCES TO SUNGAL TUNNE...
TUNNELING IN HIMALAYAS WITH NATM METHOD: A SPECIAL REFERENCES TO SUNGAL TUNNE...TUNNELING IN HIMALAYAS WITH NATM METHOD: A SPECIAL REFERENCES TO SUNGAL TUNNE...
TUNNELING IN HIMALAYAS WITH NATM METHOD: A SPECIAL REFERENCES TO SUNGAL TUNNE...IRJET Journal
 
STUDY THE EFFECT OF RESPONSE REDUCTION FACTOR ON RC FRAMED STRUCTURE
STUDY THE EFFECT OF RESPONSE REDUCTION FACTOR ON RC FRAMED STRUCTURESTUDY THE EFFECT OF RESPONSE REDUCTION FACTOR ON RC FRAMED STRUCTURE
STUDY THE EFFECT OF RESPONSE REDUCTION FACTOR ON RC FRAMED STRUCTUREIRJET Journal
 
A COMPARATIVE ANALYSIS OF RCC ELEMENT OF SLAB WITH STARK STEEL (HYSD STEEL) A...
A COMPARATIVE ANALYSIS OF RCC ELEMENT OF SLAB WITH STARK STEEL (HYSD STEEL) A...A COMPARATIVE ANALYSIS OF RCC ELEMENT OF SLAB WITH STARK STEEL (HYSD STEEL) A...
A COMPARATIVE ANALYSIS OF RCC ELEMENT OF SLAB WITH STARK STEEL (HYSD STEEL) A...IRJET Journal
 
Effect of Camber and Angles of Attack on Airfoil Characteristics
Effect of Camber and Angles of Attack on Airfoil CharacteristicsEffect of Camber and Angles of Attack on Airfoil Characteristics
Effect of Camber and Angles of Attack on Airfoil CharacteristicsIRJET Journal
 
A Review on the Progress and Challenges of Aluminum-Based Metal Matrix Compos...
A Review on the Progress and Challenges of Aluminum-Based Metal Matrix Compos...A Review on the Progress and Challenges of Aluminum-Based Metal Matrix Compos...
A Review on the Progress and Challenges of Aluminum-Based Metal Matrix Compos...IRJET Journal
 
Dynamic Urban Transit Optimization: A Graph Neural Network Approach for Real-...
Dynamic Urban Transit Optimization: A Graph Neural Network Approach for Real-...Dynamic Urban Transit Optimization: A Graph Neural Network Approach for Real-...
Dynamic Urban Transit Optimization: A Graph Neural Network Approach for Real-...IRJET Journal
 
Structural Analysis and Design of Multi-Storey Symmetric and Asymmetric Shape...
Structural Analysis and Design of Multi-Storey Symmetric and Asymmetric Shape...Structural Analysis and Design of Multi-Storey Symmetric and Asymmetric Shape...
Structural Analysis and Design of Multi-Storey Symmetric and Asymmetric Shape...IRJET Journal
 
A Review of “Seismic Response of RC Structures Having Plan and Vertical Irreg...
A Review of “Seismic Response of RC Structures Having Plan and Vertical Irreg...A Review of “Seismic Response of RC Structures Having Plan and Vertical Irreg...
A Review of “Seismic Response of RC Structures Having Plan and Vertical Irreg...IRJET Journal
 
A REVIEW ON MACHINE LEARNING IN ADAS
A REVIEW ON MACHINE LEARNING IN ADASA REVIEW ON MACHINE LEARNING IN ADAS
A REVIEW ON MACHINE LEARNING IN ADASIRJET Journal
 
Long Term Trend Analysis of Precipitation and Temperature for Asosa district,...
Long Term Trend Analysis of Precipitation and Temperature for Asosa district,...Long Term Trend Analysis of Precipitation and Temperature for Asosa district,...
Long Term Trend Analysis of Precipitation and Temperature for Asosa district,...IRJET Journal
 
P.E.B. Framed Structure Design and Analysis Using STAAD Pro
P.E.B. Framed Structure Design and Analysis Using STAAD ProP.E.B. Framed Structure Design and Analysis Using STAAD Pro
P.E.B. Framed Structure Design and Analysis Using STAAD ProIRJET Journal
 
A Review on Innovative Fiber Integration for Enhanced Reinforcement of Concre...
A Review on Innovative Fiber Integration for Enhanced Reinforcement of Concre...A Review on Innovative Fiber Integration for Enhanced Reinforcement of Concre...
A Review on Innovative Fiber Integration for Enhanced Reinforcement of Concre...IRJET Journal
 
Survey Paper on Cloud-Based Secured Healthcare System
Survey Paper on Cloud-Based Secured Healthcare SystemSurvey Paper on Cloud-Based Secured Healthcare System
Survey Paper on Cloud-Based Secured Healthcare SystemIRJET Journal
 
Review on studies and research on widening of existing concrete bridges
Review on studies and research on widening of existing concrete bridgesReview on studies and research on widening of existing concrete bridges
Review on studies and research on widening of existing concrete bridgesIRJET Journal
 
React based fullstack edtech web application
React based fullstack edtech web applicationReact based fullstack edtech web application
React based fullstack edtech web applicationIRJET Journal
 
A Comprehensive Review of Integrating IoT and Blockchain Technologies in the ...
A Comprehensive Review of Integrating IoT and Blockchain Technologies in the ...A Comprehensive Review of Integrating IoT and Blockchain Technologies in the ...
A Comprehensive Review of Integrating IoT and Blockchain Technologies in the ...IRJET Journal
 
A REVIEW ON THE PERFORMANCE OF COCONUT FIBRE REINFORCED CONCRETE.
A REVIEW ON THE PERFORMANCE OF COCONUT FIBRE REINFORCED CONCRETE.A REVIEW ON THE PERFORMANCE OF COCONUT FIBRE REINFORCED CONCRETE.
A REVIEW ON THE PERFORMANCE OF COCONUT FIBRE REINFORCED CONCRETE.IRJET Journal
 
Optimizing Business Management Process Workflows: The Dynamic Influence of Mi...
Optimizing Business Management Process Workflows: The Dynamic Influence of Mi...Optimizing Business Management Process Workflows: The Dynamic Influence of Mi...
Optimizing Business Management Process Workflows: The Dynamic Influence of Mi...IRJET Journal
 
Multistoried and Multi Bay Steel Building Frame by using Seismic Design
Multistoried and Multi Bay Steel Building Frame by using Seismic DesignMultistoried and Multi Bay Steel Building Frame by using Seismic Design
Multistoried and Multi Bay Steel Building Frame by using Seismic DesignIRJET Journal
 
Cost Optimization of Construction Using Plastic Waste as a Sustainable Constr...
Cost Optimization of Construction Using Plastic Waste as a Sustainable Constr...Cost Optimization of Construction Using Plastic Waste as a Sustainable Constr...
Cost Optimization of Construction Using Plastic Waste as a Sustainable Constr...IRJET Journal
 

More from IRJET Journal (20)

TUNNELING IN HIMALAYAS WITH NATM METHOD: A SPECIAL REFERENCES TO SUNGAL TUNNE...
TUNNELING IN HIMALAYAS WITH NATM METHOD: A SPECIAL REFERENCES TO SUNGAL TUNNE...TUNNELING IN HIMALAYAS WITH NATM METHOD: A SPECIAL REFERENCES TO SUNGAL TUNNE...
TUNNELING IN HIMALAYAS WITH NATM METHOD: A SPECIAL REFERENCES TO SUNGAL TUNNE...
 
STUDY THE EFFECT OF RESPONSE REDUCTION FACTOR ON RC FRAMED STRUCTURE
STUDY THE EFFECT OF RESPONSE REDUCTION FACTOR ON RC FRAMED STRUCTURESTUDY THE EFFECT OF RESPONSE REDUCTION FACTOR ON RC FRAMED STRUCTURE
STUDY THE EFFECT OF RESPONSE REDUCTION FACTOR ON RC FRAMED STRUCTURE
 
A COMPARATIVE ANALYSIS OF RCC ELEMENT OF SLAB WITH STARK STEEL (HYSD STEEL) A...
A COMPARATIVE ANALYSIS OF RCC ELEMENT OF SLAB WITH STARK STEEL (HYSD STEEL) A...A COMPARATIVE ANALYSIS OF RCC ELEMENT OF SLAB WITH STARK STEEL (HYSD STEEL) A...
A COMPARATIVE ANALYSIS OF RCC ELEMENT OF SLAB WITH STARK STEEL (HYSD STEEL) A...
 
Effect of Camber and Angles of Attack on Airfoil Characteristics
Effect of Camber and Angles of Attack on Airfoil CharacteristicsEffect of Camber and Angles of Attack on Airfoil Characteristics
Effect of Camber and Angles of Attack on Airfoil Characteristics
 
A Review on the Progress and Challenges of Aluminum-Based Metal Matrix Compos...
A Review on the Progress and Challenges of Aluminum-Based Metal Matrix Compos...A Review on the Progress and Challenges of Aluminum-Based Metal Matrix Compos...
A Review on the Progress and Challenges of Aluminum-Based Metal Matrix Compos...
 
Dynamic Urban Transit Optimization: A Graph Neural Network Approach for Real-...
Dynamic Urban Transit Optimization: A Graph Neural Network Approach for Real-...Dynamic Urban Transit Optimization: A Graph Neural Network Approach for Real-...
Dynamic Urban Transit Optimization: A Graph Neural Network Approach for Real-...
 
Structural Analysis and Design of Multi-Storey Symmetric and Asymmetric Shape...
Structural Analysis and Design of Multi-Storey Symmetric and Asymmetric Shape...Structural Analysis and Design of Multi-Storey Symmetric and Asymmetric Shape...
Structural Analysis and Design of Multi-Storey Symmetric and Asymmetric Shape...
 
A Review of “Seismic Response of RC Structures Having Plan and Vertical Irreg...
A Review of “Seismic Response of RC Structures Having Plan and Vertical Irreg...A Review of “Seismic Response of RC Structures Having Plan and Vertical Irreg...
A Review of “Seismic Response of RC Structures Having Plan and Vertical Irreg...
 
A REVIEW ON MACHINE LEARNING IN ADAS
A REVIEW ON MACHINE LEARNING IN ADASA REVIEW ON MACHINE LEARNING IN ADAS
A REVIEW ON MACHINE LEARNING IN ADAS
 
Long Term Trend Analysis of Precipitation and Temperature for Asosa district,...
Long Term Trend Analysis of Precipitation and Temperature for Asosa district,...Long Term Trend Analysis of Precipitation and Temperature for Asosa district,...
Long Term Trend Analysis of Precipitation and Temperature for Asosa district,...
 
P.E.B. Framed Structure Design and Analysis Using STAAD Pro
P.E.B. Framed Structure Design and Analysis Using STAAD ProP.E.B. Framed Structure Design and Analysis Using STAAD Pro
P.E.B. Framed Structure Design and Analysis Using STAAD Pro
 
A Review on Innovative Fiber Integration for Enhanced Reinforcement of Concre...
A Review on Innovative Fiber Integration for Enhanced Reinforcement of Concre...A Review on Innovative Fiber Integration for Enhanced Reinforcement of Concre...
A Review on Innovative Fiber Integration for Enhanced Reinforcement of Concre...
 
Survey Paper on Cloud-Based Secured Healthcare System
Survey Paper on Cloud-Based Secured Healthcare SystemSurvey Paper on Cloud-Based Secured Healthcare System
Survey Paper on Cloud-Based Secured Healthcare System
 
Review on studies and research on widening of existing concrete bridges
Review on studies and research on widening of existing concrete bridgesReview on studies and research on widening of existing concrete bridges
Review on studies and research on widening of existing concrete bridges
 
React based fullstack edtech web application
React based fullstack edtech web applicationReact based fullstack edtech web application
React based fullstack edtech web application
 
A Comprehensive Review of Integrating IoT and Blockchain Technologies in the ...
A Comprehensive Review of Integrating IoT and Blockchain Technologies in the ...A Comprehensive Review of Integrating IoT and Blockchain Technologies in the ...
A Comprehensive Review of Integrating IoT and Blockchain Technologies in the ...
 
A REVIEW ON THE PERFORMANCE OF COCONUT FIBRE REINFORCED CONCRETE.
A REVIEW ON THE PERFORMANCE OF COCONUT FIBRE REINFORCED CONCRETE.A REVIEW ON THE PERFORMANCE OF COCONUT FIBRE REINFORCED CONCRETE.
A REVIEW ON THE PERFORMANCE OF COCONUT FIBRE REINFORCED CONCRETE.
 
Optimizing Business Management Process Workflows: The Dynamic Influence of Mi...
Optimizing Business Management Process Workflows: The Dynamic Influence of Mi...Optimizing Business Management Process Workflows: The Dynamic Influence of Mi...
Optimizing Business Management Process Workflows: The Dynamic Influence of Mi...
 
Multistoried and Multi Bay Steel Building Frame by using Seismic Design
Multistoried and Multi Bay Steel Building Frame by using Seismic DesignMultistoried and Multi Bay Steel Building Frame by using Seismic Design
Multistoried and Multi Bay Steel Building Frame by using Seismic Design
 
Cost Optimization of Construction Using Plastic Waste as a Sustainable Constr...
Cost Optimization of Construction Using Plastic Waste as a Sustainable Constr...Cost Optimization of Construction Using Plastic Waste as a Sustainable Constr...
Cost Optimization of Construction Using Plastic Waste as a Sustainable Constr...
 

Recently uploaded

Structural Analysis and Design of Foundations: A Comprehensive Handbook for S...
Structural Analysis and Design of Foundations: A Comprehensive Handbook for S...Structural Analysis and Design of Foundations: A Comprehensive Handbook for S...
Structural Analysis and Design of Foundations: A Comprehensive Handbook for S...Dr.Costas Sachpazis
 
(ANJALI) Dange Chowk Call Girls Just Call 7001035870 [ Cash on Delivery ] Pun...
(ANJALI) Dange Chowk Call Girls Just Call 7001035870 [ Cash on Delivery ] Pun...(ANJALI) Dange Chowk Call Girls Just Call 7001035870 [ Cash on Delivery ] Pun...
(ANJALI) Dange Chowk Call Girls Just Call 7001035870 [ Cash on Delivery ] Pun...ranjana rawat
 
IMPLICATIONS OF THE ABOVE HOLISTIC UNDERSTANDING OF HARMONY ON PROFESSIONAL E...
IMPLICATIONS OF THE ABOVE HOLISTIC UNDERSTANDING OF HARMONY ON PROFESSIONAL E...IMPLICATIONS OF THE ABOVE HOLISTIC UNDERSTANDING OF HARMONY ON PROFESSIONAL E...
IMPLICATIONS OF THE ABOVE HOLISTIC UNDERSTANDING OF HARMONY ON PROFESSIONAL E...RajaP95
 
(RIA) Call Girls Bhosari ( 7001035870 ) HI-Fi Pune Escorts Service
(RIA) Call Girls Bhosari ( 7001035870 ) HI-Fi Pune Escorts Service(RIA) Call Girls Bhosari ( 7001035870 ) HI-Fi Pune Escorts Service
(RIA) Call Girls Bhosari ( 7001035870 ) HI-Fi Pune Escorts Serviceranjana rawat
 
(SHREYA) Chakan Call Girls Just Call 7001035870 [ Cash on Delivery ] Pune Esc...
(SHREYA) Chakan Call Girls Just Call 7001035870 [ Cash on Delivery ] Pune Esc...(SHREYA) Chakan Call Girls Just Call 7001035870 [ Cash on Delivery ] Pune Esc...
(SHREYA) Chakan Call Girls Just Call 7001035870 [ Cash on Delivery ] Pune Esc...ranjana rawat
 
Model Call Girl in Narela Delhi reach out to us at 🔝8264348440🔝
Model Call Girl in Narela Delhi reach out to us at 🔝8264348440🔝Model Call Girl in Narela Delhi reach out to us at 🔝8264348440🔝
Model Call Girl in Narela Delhi reach out to us at 🔝8264348440🔝soniya singh
 
Coefficient of Thermal Expansion and their Importance.pptx
Coefficient of Thermal Expansion and their Importance.pptxCoefficient of Thermal Expansion and their Importance.pptx
Coefficient of Thermal Expansion and their Importance.pptxAsutosh Ranjan
 
Introduction to IEEE STANDARDS and its different types.pptx
Introduction to IEEE STANDARDS and its different types.pptxIntroduction to IEEE STANDARDS and its different types.pptx
Introduction to IEEE STANDARDS and its different types.pptxupamatechverse
 
Call for Papers - African Journal of Biological Sciences, E-ISSN: 2663-2187, ...
Call for Papers - African Journal of Biological Sciences, E-ISSN: 2663-2187, ...Call for Papers - African Journal of Biological Sciences, E-ISSN: 2663-2187, ...
Call for Papers - African Journal of Biological Sciences, E-ISSN: 2663-2187, ...Christo Ananth
 
Sheet Pile Wall Design and Construction: A Practical Guide for Civil Engineer...
Sheet Pile Wall Design and Construction: A Practical Guide for Civil Engineer...Sheet Pile Wall Design and Construction: A Practical Guide for Civil Engineer...
Sheet Pile Wall Design and Construction: A Practical Guide for Civil Engineer...Dr.Costas Sachpazis
 
HARMONY IN THE NATURE AND EXISTENCE - Unit-IV
HARMONY IN THE NATURE AND EXISTENCE - Unit-IVHARMONY IN THE NATURE AND EXISTENCE - Unit-IV
HARMONY IN THE NATURE AND EXISTENCE - Unit-IVRajaP95
 
UNIT-III FMM. DIMENSIONAL ANALYSIS
UNIT-III FMM.        DIMENSIONAL ANALYSISUNIT-III FMM.        DIMENSIONAL ANALYSIS
UNIT-III FMM. DIMENSIONAL ANALYSISrknatarajan
 
Call Girls Service Nashik Vaishnavi 7001305949 Independent Escort Service Nashik
Call Girls Service Nashik Vaishnavi 7001305949 Independent Escort Service NashikCall Girls Service Nashik Vaishnavi 7001305949 Independent Escort Service Nashik
Call Girls Service Nashik Vaishnavi 7001305949 Independent Escort Service NashikCall Girls in Nagpur High Profile
 
(TARA) Talegaon Dabhade Call Girls Just Call 7001035870 [ Cash on Delivery ] ...
(TARA) Talegaon Dabhade Call Girls Just Call 7001035870 [ Cash on Delivery ] ...(TARA) Talegaon Dabhade Call Girls Just Call 7001035870 [ Cash on Delivery ] ...
(TARA) Talegaon Dabhade Call Girls Just Call 7001035870 [ Cash on Delivery ] ...ranjana rawat
 
OSVC_Meta-Data based Simulation Automation to overcome Verification Challenge...
OSVC_Meta-Data based Simulation Automation to overcome Verification Challenge...OSVC_Meta-Data based Simulation Automation to overcome Verification Challenge...
OSVC_Meta-Data based Simulation Automation to overcome Verification Challenge...Soham Mondal
 
Extrusion Processes and Their Limitations
Extrusion Processes and Their LimitationsExtrusion Processes and Their Limitations
Extrusion Processes and Their Limitations120cr0395
 
Software Development Life Cycle By Team Orange (Dept. of Pharmacy)
Software Development Life Cycle By  Team Orange (Dept. of Pharmacy)Software Development Life Cycle By  Team Orange (Dept. of Pharmacy)
Software Development Life Cycle By Team Orange (Dept. of Pharmacy)Suman Mia
 
VIP Call Girls Service Hitech City Hyderabad Call +91-8250192130
VIP Call Girls Service Hitech City Hyderabad Call +91-8250192130VIP Call Girls Service Hitech City Hyderabad Call +91-8250192130
VIP Call Girls Service Hitech City Hyderabad Call +91-8250192130Suhani Kapoor
 
(MEERA) Dapodi Call Girls Just Call 7001035870 [ Cash on Delivery ] Pune Escorts
(MEERA) Dapodi Call Girls Just Call 7001035870 [ Cash on Delivery ] Pune Escorts(MEERA) Dapodi Call Girls Just Call 7001035870 [ Cash on Delivery ] Pune Escorts
(MEERA) Dapodi Call Girls Just Call 7001035870 [ Cash on Delivery ] Pune Escortsranjana rawat
 

Recently uploaded (20)

Structural Analysis and Design of Foundations: A Comprehensive Handbook for S...
Structural Analysis and Design of Foundations: A Comprehensive Handbook for S...Structural Analysis and Design of Foundations: A Comprehensive Handbook for S...
Structural Analysis and Design of Foundations: A Comprehensive Handbook for S...
 
(ANJALI) Dange Chowk Call Girls Just Call 7001035870 [ Cash on Delivery ] Pun...
(ANJALI) Dange Chowk Call Girls Just Call 7001035870 [ Cash on Delivery ] Pun...(ANJALI) Dange Chowk Call Girls Just Call 7001035870 [ Cash on Delivery ] Pun...
(ANJALI) Dange Chowk Call Girls Just Call 7001035870 [ Cash on Delivery ] Pun...
 
IMPLICATIONS OF THE ABOVE HOLISTIC UNDERSTANDING OF HARMONY ON PROFESSIONAL E...
IMPLICATIONS OF THE ABOVE HOLISTIC UNDERSTANDING OF HARMONY ON PROFESSIONAL E...IMPLICATIONS OF THE ABOVE HOLISTIC UNDERSTANDING OF HARMONY ON PROFESSIONAL E...
IMPLICATIONS OF THE ABOVE HOLISTIC UNDERSTANDING OF HARMONY ON PROFESSIONAL E...
 
(RIA) Call Girls Bhosari ( 7001035870 ) HI-Fi Pune Escorts Service
(RIA) Call Girls Bhosari ( 7001035870 ) HI-Fi Pune Escorts Service(RIA) Call Girls Bhosari ( 7001035870 ) HI-Fi Pune Escorts Service
(RIA) Call Girls Bhosari ( 7001035870 ) HI-Fi Pune Escorts Service
 
(SHREYA) Chakan Call Girls Just Call 7001035870 [ Cash on Delivery ] Pune Esc...
(SHREYA) Chakan Call Girls Just Call 7001035870 [ Cash on Delivery ] Pune Esc...(SHREYA) Chakan Call Girls Just Call 7001035870 [ Cash on Delivery ] Pune Esc...
(SHREYA) Chakan Call Girls Just Call 7001035870 [ Cash on Delivery ] Pune Esc...
 
Model Call Girl in Narela Delhi reach out to us at 🔝8264348440🔝
Model Call Girl in Narela Delhi reach out to us at 🔝8264348440🔝Model Call Girl in Narela Delhi reach out to us at 🔝8264348440🔝
Model Call Girl in Narela Delhi reach out to us at 🔝8264348440🔝
 
Coefficient of Thermal Expansion and their Importance.pptx
Coefficient of Thermal Expansion and their Importance.pptxCoefficient of Thermal Expansion and their Importance.pptx
Coefficient of Thermal Expansion and their Importance.pptx
 
Introduction to IEEE STANDARDS and its different types.pptx
Introduction to IEEE STANDARDS and its different types.pptxIntroduction to IEEE STANDARDS and its different types.pptx
Introduction to IEEE STANDARDS and its different types.pptx
 
Call for Papers - African Journal of Biological Sciences, E-ISSN: 2663-2187, ...
Call for Papers - African Journal of Biological Sciences, E-ISSN: 2663-2187, ...Call for Papers - African Journal of Biological Sciences, E-ISSN: 2663-2187, ...
Call for Papers - African Journal of Biological Sciences, E-ISSN: 2663-2187, ...
 
Sheet Pile Wall Design and Construction: A Practical Guide for Civil Engineer...
Sheet Pile Wall Design and Construction: A Practical Guide for Civil Engineer...Sheet Pile Wall Design and Construction: A Practical Guide for Civil Engineer...
Sheet Pile Wall Design and Construction: A Practical Guide for Civil Engineer...
 
HARMONY IN THE NATURE AND EXISTENCE - Unit-IV
HARMONY IN THE NATURE AND EXISTENCE - Unit-IVHARMONY IN THE NATURE AND EXISTENCE - Unit-IV
HARMONY IN THE NATURE AND EXISTENCE - Unit-IV
 
UNIT-III FMM. DIMENSIONAL ANALYSIS
UNIT-III FMM.        DIMENSIONAL ANALYSISUNIT-III FMM.        DIMENSIONAL ANALYSIS
UNIT-III FMM. DIMENSIONAL ANALYSIS
 
Call Girls Service Nashik Vaishnavi 7001305949 Independent Escort Service Nashik
Call Girls Service Nashik Vaishnavi 7001305949 Independent Escort Service NashikCall Girls Service Nashik Vaishnavi 7001305949 Independent Escort Service Nashik
Call Girls Service Nashik Vaishnavi 7001305949 Independent Escort Service Nashik
 
(TARA) Talegaon Dabhade Call Girls Just Call 7001035870 [ Cash on Delivery ] ...
(TARA) Talegaon Dabhade Call Girls Just Call 7001035870 [ Cash on Delivery ] ...(TARA) Talegaon Dabhade Call Girls Just Call 7001035870 [ Cash on Delivery ] ...
(TARA) Talegaon Dabhade Call Girls Just Call 7001035870 [ Cash on Delivery ] ...
 
OSVC_Meta-Data based Simulation Automation to overcome Verification Challenge...
OSVC_Meta-Data based Simulation Automation to overcome Verification Challenge...OSVC_Meta-Data based Simulation Automation to overcome Verification Challenge...
OSVC_Meta-Data based Simulation Automation to overcome Verification Challenge...
 
Extrusion Processes and Their Limitations
Extrusion Processes and Their LimitationsExtrusion Processes and Their Limitations
Extrusion Processes and Their Limitations
 
Software Development Life Cycle By Team Orange (Dept. of Pharmacy)
Software Development Life Cycle By  Team Orange (Dept. of Pharmacy)Software Development Life Cycle By  Team Orange (Dept. of Pharmacy)
Software Development Life Cycle By Team Orange (Dept. of Pharmacy)
 
9953056974 Call Girls In South Ex, Escorts (Delhi) NCR.pdf
9953056974 Call Girls In South Ex, Escorts (Delhi) NCR.pdf9953056974 Call Girls In South Ex, Escorts (Delhi) NCR.pdf
9953056974 Call Girls In South Ex, Escorts (Delhi) NCR.pdf
 
VIP Call Girls Service Hitech City Hyderabad Call +91-8250192130
VIP Call Girls Service Hitech City Hyderabad Call +91-8250192130VIP Call Girls Service Hitech City Hyderabad Call +91-8250192130
VIP Call Girls Service Hitech City Hyderabad Call +91-8250192130
 
(MEERA) Dapodi Call Girls Just Call 7001035870 [ Cash on Delivery ] Pune Escorts
(MEERA) Dapodi Call Girls Just Call 7001035870 [ Cash on Delivery ] Pune Escorts(MEERA) Dapodi Call Girls Just Call 7001035870 [ Cash on Delivery ] Pune Escorts
(MEERA) Dapodi Call Girls Just Call 7001035870 [ Cash on Delivery ] Pune Escorts
 

IRJET- Mode Choice Behaviour Analysis of Students in Thrissur City

  • 1. International Research Journal of Engineering and Technology (IRJET) e-ISSN: 2395-0056 Volume: 06 Issue: 06 | June 2019 www.irjet.net p-ISSN: 2395-0072 © 2019, IRJET | Impact Factor value: 7.211 | ISO 9001:2008 Certified Journal | Page 1226 Mode choice Behaviour Analysis of Students in Thrissur city Jerry Soman1, Vincy Verghese2 1PG scholar, Dept of Civil Engineering, JECC Cheruthuruthy, Kerala, India 2Assistant Professor, Dept of Civil Engineering, JECC Cheruthuruthy, Kerala, India ---------------------------------------------------------------------***------------------------------------------------------------------ Abstract – Travel behaviour plays an important role in transportation planning. Modechoiceanalysisistheprocessof arriving at a decision about which mode to use under a set of circumstances. Choice of a particular mode by a student affects the general efficiency of travel within the city. Main objective of the study is to find out the travel pattern, identify the factors to choose the mode and predict the model. Various techniques are available for mode choice modelling. Multinomial logit models are found to be efficient in estimating the different mode sharesinascenariowheremore than two choices of modes of travel are availableforastudent. Multinomial logistic regression is to analyse the mode choice behaviour of students in Thrissur city. SPSS is used to develop the model for different modes. Keywords: Travel behaviour, SPSS, Multinomial logit model 1.INTRODUCTION Transportation modellings plays an vital role in planning. Major roles of transportation modelling are forecasting travel demand based on variations in the transportation planning system. Different types of models are there that have been developed to create actual travel patterns of people and existing conditions. Models are used to predict changes in travel pattern and utility of the transportation system. Thrissur city is the third largest urban agglomeration in Kerala about 1,854,783 population and the 20th largest in India. There are several number of schools within the city and outside the city. Mode choice behaviour of students in urban and rural area is different. The sex ratio of male and femaleis1092:1000.Development of models in rural and urban region helps the transportation planners to add in transport policies. And after work trips the second most occurrence of congestion are school tripsat the peak time. Forecasting will help to design the transport planning systems and considering the travel behaviour of the study area. It also helps to develop a system that can accommodate the travel demand forthefuture.Theproblem faced is incomplete information that makes the uncertain conditions. If we need to reach on predictability; it can be achieved through the probability of individual decision and its leading characteristics. However, private automobiles remain the predominant school travel mode (45.3%mode share) followed by school buses (39.4 %), while walking or bicycling together account for only 12.7% of the total school transportation mode share in the USA as in 2000.Inaddition to personal and social factors such as parents’ education, income and attitudes, children’s age, race, gender and attitudes, and peer influence studies have found many built environmental factors associated with school travel behaviours. Environmental approaches to promote walking to or from school have become increasinglypopularwiththe recognition that a safe environment is a prerequisite to any promotional efforts. Further, environmental improvements are relatively permanent and can lead to population-level changes over time if successful. Among the environmental correlates, home-to-school distance has shown to be the most consistent and often the strongest predictor of school travel mode choice, followed by safety and weather .However, shortening the distance to school is not simple. It requires long-term, multilevel policy and environmental changes, such as school sitting, zoning, and land development policies. 1.1 Objectives The main objectives of the study are: ‱ Study the mode choice behaviour of students ‱ Identifying the various factorsthatcontributetothe selection of a particular mode in the city for educational trips. ‱ To develop a model to predict the mode choice behaviour of students Thrissur city for both rural and urban region Before you begin to format your paper, first write and save the content asa separate text file. Keep your textand graphic files separate until after the text has been formatted and styled. Do not use hard tabs, and limit use of hard returns to only one return at the end of a paragraph. Do not add any kind of pagination anywhereinthepaper.Donotnumbertext heads-the template will do that for you. Finally, complete content and organizational editing before formatting. Please take note of the following items when proofreading spelling and grammar: 2. LITERATURE SURVEY The access travel characteristics are discussed with respect to mode use pattern, availability of access modes, satisfaction with the access environmentandcharacteristics of the access leg of a trip in comparison to primary and egress legs. Acceptable trip lengths by walk and bicycle
  • 2. International Research Journal of Engineering and Technology (IRJET) e-ISSN: 2395-0056 Volume: 06 Issue: 06 | June 2019 www.irjet.net p-ISSN: 2395-0072 © 2019, IRJET | Impact Factor value: 7.211 | ISO 9001:2008 Certified Journal | Page 1227 modes in accessing transit stations are computed from their cumulative frequency distribution of trip lengths. The commuters are segmented into different socio economic subgroups using characteristics like occupation, type of house, vehicle availability and household income. The mean and acceptable walking and bicycling distances found for different subgroups.(Rajat Rastogi and K V Krishna Rao ,2003) Matched home locations and different school travel modes were examined using conditional logistic regressions. Despite the same/similar objectivelymeasureddistanceand home location, perceptions of distance, sidewalk and traffic conditions, park presence, and convenience of walking differed between walkers and automobile users Parental attitudes and children’s preferences were associated with the odds of walking. Safety concerns(traffic danger,stranger danger, and getting lost) were higher among drivers, but only significant in bivariate analyses. To promotewalking to school, route/street improvements appear promising, but parallel educational and promotional efforts may be needed to address perceptual and attitudinal barriers.(Chanam lee and jeongjae yoon ,2013) 3. METHODOLOGY The work intends to find a proper model forstudentstrips to predict the future travel demand and finding important characteristics. It is aimed at identifying various factors that contribute to the selection of a particular mode in the city.. MNL modelling was adopted in the study because of its capability in estimating the mode shares where more than two choices of modes of travel.The first phase is researching for topic and study literature, and then data was collected data of Thrissur city. Preliminary analysis is done to study the data. Student trips are distributed on different modes- Two wheeler, bus, car, three-wheeler, cycle and walk. Validation is the process of checking the model for its accuracy in prediction. The last phase is concluding the study. Numbers of studies were done under transportation planning and selectively on mode choice behaviour, integration of multi-modes, Intra-city level characteristics and attitudinal behaviour. To develop better model needs good data collection. As the data increases the model gives better output. The method used for data collection to development model formodechoiceisquestionnairesurvey. Total number of student tripsgettingfromtheschool is1200 .The available questionnaire survey data contains data of travel characteristics as well as traveller characteristics. From the data, the important variables were needed to identify. The consideredtravel characteristicsaretotal travel time, travel cost, distance, vehicle ownership, gender, age and income. Model development is the most important step in this study and it is done by the help of Statistical package system software . The models used to study the modechoice behaviour are multinomial logit model. The common modelling method for mode choice are Multinomial Logit model(MNL) due to it leads to simpler, providing more economic model and increasing the power to detect the relationships with other variables. The most preferred softwares used for multinomial logit models are SPSS (Statistical Package for the social sciences). The developed model should be validated. 4. DATA COLLECTION Assuming the population to be normally distributed, empirical formulas given by Levy and Lemeshow (2008) [shown in Eqs. (2) and (3) were used to determine the sample size. (2) where n0 = sample size for infinite population; Z = statistical parameter corresponding to confidence level (Z is 1.96 for 95% confidence interval); e = desired margin of error (adopted as 5%); p = hypothesized true proportion for population (adopted as 0.5 to account for the worst case) and q = 1- p n (3) where n = sample size for finite population; N = population size. For a very good model, study needs large quantity of data.In this a questionnaire form is prepared forstudentstofindout their travel behaviour, factors which influence to select the mode.From the google map, names of the schools are got. From the number of schools, schools of mixed students are taken for the survey. Eliminate girls and boys only school from the list. Then select the schools which are in corporation ward. From that, schools are divided into urban schools and rural schools. After that from urban area, 4 schools are selected and from rural area, 4 schools are selected. From the selected schools 50 samples from each section (upper primary, high school and higher secondary) are collected. Total number of samples are 150 from each school. Urban area and rural area is determined by whether there is residential buildings, commercial buildings and highway. Four schools from urban area and four schools from rural area are randomly selected to collect the data. The questionnaire format is shown below. As the data increases model gives better output. Questionnaire format include travel characteristics, travellers characteristics. From the data important variables were needed to identify. Questionnaire surveys involve collecting the information regardinghouseholdcharacteristics,personal characteristics and the travel decisions made in the recent past.
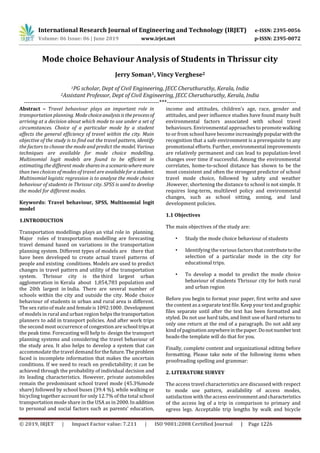
  • 3. International Research Journal of Engineering and Technology (IRJET) e-ISSN: 2395-0056 Volume: 06 Issue: 06 | June 2019 www.irjet.net p-ISSN: 2395-0072 © 2019, IRJET | Impact Factor value: 7.211 | ISO 9001:2008 Certified Journal | Page 1228 5. DATA ANALYSIS Stratification of the collected samples is discussed in the following sections. The collected data is entered in the Microsoft excel and the preliminary analysis is done. Data analyses are the process of identifying the right data for achieving the objective of the study. It is the process of obtaining raw data and converting into useful information and used for mode choice modellingwhichhelpsfordecision making process. Data was collected through questionnaire survey and the objective is to find the most influencing variables on the mode choice behaviour of students and to develop a model of student mode choice in Thrissur City. The collected data is organised into a format given in the following tables to fit for analysis within a spread sheet for easy data processing. The data are divided into categories and coding is done for easy analysis. Table shows different categories of mode, gender, age, income,distanceandvehicle ownership.The analysis was done by Microsoft excel using filtration tool. Preliminary analysis is done on the data. The data is presented graphicallyforgenderwisemodeselection, age wise mode selection, income wise mode selection , distance wise mode selection. Table -1: Categories and coding pattern for the study Categories Coding pattern Mode Two wheeler 1 Car 2 Bus 3 Cycle 4 Auto 5 Van 6 Walk 7 Gender (G) Male 1 Female 2 Age (A) 10-12 1 13-15 2 Preliminary analysis is done on the data. The data is presented graphically for urban and rural region based on mode split Fig -1: Mode split Mode split data is the primary step of mode choice modelling. Most students prefers bus (67.83%) as their mode of choice. 4.85% of students are preferring cycle as their mode , three wheeler and van have 16.24% and 0.333%.walking and bike have 4.35% and 0.16%. from this graph we can clearly identified that more percentage of urban students are using bus as their mode and least percentage of mode choosing is for two wheeler. Preliminary analysis of Rural region: Fig -2: Mode split Mode split data is the primary step of mode choice modelling. Most students prefers bus (44.83%) as their mode of choice. 5% of students are preferring cycle as their mode , three wheeler and van have 6.16% and 0.167%.walking and bike have 41.5% and 0.5%. from this graph we can clearly identifiedthatmorepercentageof rural region students are using bus as their mode . 6. MODEL DEVELOPMENT Mode choice modeling is the third important steps of the transportation planning after trip generation and trip distribution. Mode choice modelling helps to find the traveller‘s choice of mode. For modeling the mode choice, there is need of proper analysis of the data. Modelling predicts how road users will split themselves between transits and other vehicles. Mode choice modeling is to be done by identifying different modes, identifying the
  • 4. International Research Journal of Engineering and Technology (IRJET) e-ISSN: 2395-0056 Volume: 06 Issue: 06 | June 2019 www.irjet.net p-ISSN: 2395-0072 © 2019, IRJET | Impact Factor value: 7.211 | ISO 9001:2008 Certified Journal | Page 1229 attributes and characteristics and constructing an experimental design that is appropriate for those attributes and characteristics. Before doing the model coorelation of variables have to be found out.When using MNL regression, one category of the dependent variable is chosen as the reference category. All parameters in the model are interpreted with reference to it. It is the standard/reference category to which others (response category) would naturally be compared. The coefficients are estimated through an iterative maximum likelihood method. Odds ratios are determined for all independent variables for each category of the dependent variable except the reference category. Odds ratio represents the change in the odds of being in the dependent variable category versus the reference category associated with a one unit change in the independent variable. In analysis, the mode of conveyance is chosen as dependent variable,astheproblemisconcerned with choice of mode. In order to get the preference of bus relative to other modes, bus is chosen as the reference category. Bus was compared Table -2: The likelihood ratio test for Urban region with car and two-wheeler separately to understand the factors The independent variables chosen are age group, gender, income, vehicle ownership, distance, travel time, travel cost, level of education,reason, It can be found that only travel time have significance less than 0.05. So we can conclude that the travel time used in the model have significant contribution toward predicting the mode choice behaviour of students in urban region. From table variables of urban model MNL regression model of car in relation with bus,the factor travel time has a positive coefficient of 0.780, which means increase in travel time, students are choosing car over bus as their mode of travel. The odds ratio obtained in the output of travel time is 2.182, indicating that for each unit of increase in travel time, the mode choice of students increase by 2.182 times.InMNL regression model of auto in relation with bus, the factor travel time has a positive coefficient of 0.663, which means increase in travel time, students are choosing auto over bus as their mode of travel. The odds ratio obtainedintheoutput of travel time is 1.940, indicating that for each unit of increase in travel time, the mode choice of students increase by 1.940 times. The factor reason=1 has a negative coefficient of 1.931, which meansstudentsarechoosingauto over bus as their mode of travel because the reason comfort. The odds ratio obtained in the output of reason is 0.145, indicating that students are lesser comfort with the mode auto by 0.145 times over bus. In MNL regression model of walk in relation with bus the factor travel time has a negative coefficient of 0.723, which meansdecreaseintravel time, students are choosing walk over bus as their mode of travel. The odds ratio obtained in the output of travel time is 2.062, indicating that for each unit of decreaseintravel time, the mode choice of students decrease by 2.062 times. Table 3 shows a statistical comparison of intercept-only model and final model. Intercept only describesa model that does not include any predictor variables and simply fits an intercept to predict the output variable. Final describes a model that includes the specifiedpredictorvariablesand has been arrived at through an iterative process that maximizes the log likelihood of the outcomes seen in the output variable. By including the predictor variables and maximizing the log likelihood of the outcomes seen in the data, the final model is an improvement on the intercept- only model. The likelihood ratio test shows the contribution of each variable to the model. This fact is revealed by the statistical tests on the two models as given in Table.Thechi- square statistic is the difference between the –2 log- likelihoods of the null/intercept-only and final models. Because the significance level of the test is less than 0.05, it can be concluded that the final model is outperforming the null model.The pseudo R2 value of the final model according to Nagelkerke for urban model are 0.500 and pseudo R2 value for rural model are 0.400. Pseudo R2 value indicates the proportion of variance of the response variable explained by the predictors and its maximum value is 1. Larger pseudo R2 statisticsindicatethatlargerpercentageof variation can be explained by the model. Model Fitting Criteria Likelihood Ratio Tests Effect -2 Log Likelihood of Reduced Model Chi- square df Sig Intercept 374.224a 0.000 0 Income 380.207b 5.982 5 0.308 Distance 378.265 4.041 5 0.544 Travel Time 396.847 22.622 5 0.000 Vehicle ownership 375.159b 0.934 5 0.968 Traffic 377.164 2.939 5 0.709 Comfort 378.376b 4.151 5 0.528 Level Of Education 380.134 5.910 5 0.315 Reason 397.175 22.951 20 0.291
  • 5. International Research Journal of Engineering and Technology (IRJET) e-ISSN: 2395-0056 Volume: 06 Issue: 06 | June 2019 www.irjet.net p-ISSN: 2395-0072 © 2019, IRJET | Impact Factor value: 7.211 | ISO 9001:2008 Certified Journal | Page 1230 Comfort level and traffic. The independent variables are classified into various categories.The likelihood ratio tests that show the contribution of each variable to the model of urban area are shown below. Table -3: Values of likelihood ratio tests for Urban area: Model fitting criteria Likelihood ratio tests Model -2 log likelihood Chi square df Sig Intercept only 475.860 Final 374.224 101.636 55 0.000 Utility equation for Urban model U(Car) = 0.78*TT U(Auto) = 0.663*TT-1.931*R1 U(Walk) = -0.723*TT Table -4: Variables for urban region 6.1 validation From the 1200 data collected analysisisperformed bytaking 800 samples and remaining 400 aretakenforvalidation.The procedure followed by validation is given below: i. Score of the utility model is found out ii. Found out the mode choice of students using this equation. P(Y=1) = iii. Maximum value of each mode is taken as predicted output iv. Compared the value of observed and predicted v. Determine the prediction percentage vi. prediction percentage for rural model is 72.5% and for urban model it is 42.85% 7. CONCLUSIONS The study Mode Choice behaviour of students in Thrissur City‖ aims at developing a model for school in Thrissur city using SPSS software. The study considered some selected modes only which are dominant. The main conclusions drawn from the study are:  Factors influencing the mode choice of students in rural region are age, gender, level of education, distance ,travel time, comfort and travel cost  Factors influencing the mode choice of students in urban region are income, distance, travel time, vehicle ownership,traffic,reasonforchoosingmode and comfort level.  Common variables coming under urban and rural model are distance and travel time.  Both rural and urban region most of the students are using bus as their mode of travel. REFERENCES [1] Guerraa, E.,(2018).”Urban form, transit supply, and travel behaviorinLatinAmerica:EvidencefromMexico's 100 largest urban areas”Transport Policy 69 ,98–105 [2] V Sohonia,A., Thomasa,M.,(2017)”Modeshiftbehaviorof commuters due to the introduction of new railtransit mode”Transportation Research Procedia , 2603–2618 [3] K.M. Keyes,A., Crawford-Brown,D.,(2018)“Thechanging influences on commuting mode choice inurbanEngland under Peak Car: A discrete choice modelling approach”Transportation Research Part F ,167–176 [4] Roider,O.,Rudloff,C.,(2012),“an individualized travel information systemfor optimizing mode and route choice behaviour of commuters” Procedia - Social and Behavioral Sciences ,1948 – 1957 [5] Xianyua,J.,(2013).”An exploration of the interdependencies between trip chaining behavior and travel mode choice”Procedia - Social and Behavioral Sciences,1967 – 1975 [6] Ding,L., Zhang,N.,“A Travel Mode Choice Model Using Individual Grouping Based on Cluster Analysis”Procedia Engineering ,786 – 795
  • 6. International Research Journal of Engineering and Technology (IRJET) e-ISSN: 2395-0056 Volume: 06 Issue: 06 | June 2019 www.irjet.net p-ISSN: 2395-0072 © 2019, IRJET | Impact Factor value: 7.211 | ISO 9001:2008 Certified Journal | Page 1231 [7] Kaewkluengkloma,R.,Satiennamb,W.,(2017),”Influence of psychological factors on mode choice behaviour:Case study of BRT in Khon Kaen City, Thailand”TransportationResearchProcedia ,5072–5082 [8] Sreerag ,S., Sachdeva,S.,”Mode Choice Modelling for Work Trips in Thiruvanthpuram City”journalof Basic and Applied Engineering Research ,Vol 3, Issue 4 [9] Verma,M., Manoj,M.,(2016),“Analysisoftheinfluencesof attitudinal factors on car ownership decisions among urban young adults in a developing country like India” Transportation Research Part F , 90–103