Download to read offline
![International Research Journal of Engineering and Technology (IRJET) e-ISSN: 2395-0056
Volume: 05 Issue: 12 | Dec 2018 www.irjet.net p-ISSN: 2395-0072
© 2018, IRJET | Impact Factor value: 7.211 | ISO 9001:2008 Certified Journal | Page 27
A New Strategy to Detect Lung Cancer on CT Images
Fatema Tuj Johora1, Mehdi Hassan Jony2, Parvin Khatun3
1Lecturer, Department of Computer Science & Engineering, Green University of Bangladesh.
2Research Assistant, School of Computer Science & Technology, Hefei University of Technology, China.
3Junior Officer, Department of Computer Science & Engineering, Green University of Bangladesh
---------------------------------------------------------------------***----------------------------------------------------------------------
Abstract - Lung cancer has a very low level of healing, with
effective detection, the survival of lung cancer can be highly
appreciated. In the early stages, lungcancerdetectionplaysan
important role in human health. Computed tomography (CT)
images, which provide an electronic density of tissues, are
widely applied in radiotherapy planning. Based on CT
technology, the proposed system consists of a few steps like
photo acquisition, preprocessing, feature extraction and
categorization. At the preprocessing stage, RGB images are
converted to grayscale images, used for reducing the Gabor
filter, the Adaptive thresholding method transforms CT scan
images into binary images, and the REGIONPROPS function is
used for the right body, from the binary image to the region.
Feature extraction platforms, such as contrast, correlation,
energy, home genetics, are characterized by a static method
called Gray Level Co-occurrence Matrix (GLCM). In the final
stage, features integrated with Support vector machines
(SVM) and Back Propagation Neural Network (BPNN) are
used to detect lung cancer from CT images. The performance
of the proposed approach shows the accuracy of 96.32%
accuracy in SVM and 83.07% accuracy in BPNN.
Key Words: lung cancer detection; image processing;
adaptive threshold; GLCM; BPNN; SVM
1. INTRODUCTION
WHO has reported (WHO 2018), cancer, accounting for 8.8
million deaths, a leading cause of global death. Compared
with other cancers, such as breast cancer, brain cancer and
prostate cancer, lung cancer, which is responsible for 1.76
million deaths, the highest mortality rates.
The main reason for non-accidental death is cancer. Lung
cancer is one of the most serious human problems in the
world. The death rate of lung disease is the death of all other
types of cancer worldwide in men and women. Studying
cancer at early stages is very difficult. Many PC-aided
systems are designed to detect lung cancer at its premature
stage. Image enhancement and classification can be a great
work, especially when performing the medical field. During
this paper, various strategies for detecting lung cancer
disorders have been discussed and whether it is modest or
deadly. Computer tomography (CT) may be more effective
than X-rays for lung cancer detection and detection.
2. LITERATURE REVIEW
There are many existing strategies for diagnosing lung
cancer, such as computed tomography (CT), chest
radiography (X-rays), magnetic resonance imaging (MRI
scan) and sputum Cyrillic [1] [2]. B. Sahiner et.al., [3] There
are two stages in the paper-printing process. In the first
phase, the sound and film artificial can be removed using the
median filter. In the second stage, the decay structure
material is applied thrice; But each time the structure
decreases the size of one of the components. The unexpected
ribcage part has been removed from the results obtained.
This preprocessing also maintains a tumour, reducing
segmentation problems on. [4] The lung area classifies
extinction methods in two categories, rule-based and pixel-
classified sections. [5] City creates an image processing
algorithm for the detection of lung cancer in images, and
initially, the rate of lung cancer survival rates increased by
14% to 49%. [6] Used in the sense that the algorithm for
image segmentation, in this study,featureswereextractedby
GLCM, and classified by BPNN. [7] To reduce false positive
rates, Computed Tomography (CT) images represent an
automated computer-aided detection(CAD)systemtodetect
a large lung sample from surrounding Chest radiographs.
Artificial intelligent algorithms are considered as powerful
tools for background and categorization [8], such as BPNN
and SVM, these models are generally applied to analysis due
to fast learning advantages, self-adaptations, and strong
tolerance of errors. These features make it possible that
models based on artificial intelligent algorithmscanmeetthe
image processing technology, perform better in cancer
detection [9].
On this paper, we have proposed two models based on SVM
and BPNN, respectively, using it with the features used to
identify lung cancer from city images. In addition, the
strength of these two models has been compared to lung
cancer detection.
3. METHODOLOGY
Focus on the method to obtain a more accurate result. In the
proposed method, it is increasing in contrast to the input
image via the pre-processing method. The first one is done
by converting the input image to a grayscale image. The
images have been corrected with the Gabor filter to enhance
image contrast. Frequency and adaptation presentations of
Gabor filters are similar to human visual systems, and they
have been considered strongly for constructive
representation and discrimination [1].](https://image.slidesharecdn.com/irjet-v5i1206-181227065633/75/IRJET-A-New-Strategy-to-Detect-Lung-Cancer-on-CT-Images-1-2048.jpg)
![International Research Journal of Engineering and Technology (IRJET) e-ISSN: 2395-0056
Volume: 05 Issue: 12 | Dec 2018 www.irjet.net p-ISSN: 2395-0072
© 2018, IRJET | Impact Factor value: 7.211 | ISO 9001:2008 Certified Journal | Page 28
In image processing, the division is a more important part,
ideally enhanced images in this section are divided into two
or more sub-segments, which will be easy to represent
images for more elements of the element. Partitioning
objects can be used for recognition, speed, or binding
boundaries between binarysystems.Imagesplittingtargetis
related to clusters of pixels, individual surfaces, objects, or
natural elements of the object in relevant image areas. We
mainly follow a method like a threshold. Feature extraction,
the process of comparing a pixel is to offer this paper. The
first phase of the collection of City images (normal and
unusual) from database found at IMBA Home (Via-LCAP
public access) begins. [1]
Figure 1: Methodology
3.1 Image Acquisition
An image is artificial which limits visual perception, which
usually has an object with a real object or a person's
appearance. The first step of pre-processing consists of the
human lung image to create a visible representationofsome
organs and tissues. There are many medical images
capturing methods such as tactile imaging, magnetic
resonance imaging (MRI), computed tomography (CT),
positron emission tomography (PET), etc. Single-photon
emission math tomography (Spect), etc. theimagescollected
from ELCAP public lung image database which is released
December 20, 2003. The whole-lung dataset consists of 50
CT scans obtained in a single breath hold with a 1.25 mm
slice thickness. DICOM (Digital Imaging and Communication
in Medicine) has become a standard for medical imaging.
The acquired image is in raw form. A lot of noise in the
acquired image is observed. To improve contrast,
transparency, background sound separation, it needs to be
pre-processed. Therefore, different techniques like
enhancement, the required form is developed from images.
3.2 Image Enhancement
The image begins with image enhancement in the pre-
processing phase. The goal of image enhancement is to
provide better input for information about the information
contained in the image ortothemodernizationofknowledge
or other automated image processing techniques for the
human audience. Image enhancement strategies can be
divided into two broad categories: Spatial Domain Method
and Frequency Domain Process [10].
1) Spatial domain techniques- which operate directly on
pixels.
2) Frequency domain techniques- which operate on the
Fourier transform of an image.
Different image enhancement strategies can be identified
as the Spatial Domain Method and Frequency Domain
Process. This includes polishing and light removal, laziness
etc. There are many ways to improve the image, but the
Gabor filter is considered suitable for both CT and MRI
images. In the image enhancement stage, we have used the
following Gabor filter strategies.
Gabor filter: Gabor filter is a linear filter which is defined
by a coherent function multiply by a Gaussian function
replicating the reflection. Due to the quality of the
convoluted property, the transit of the Fourier transit of
Gabor filters is impulse transcript to the Pharmacological
function and Fourier transformation of the Fourier
transformation of Gaussian Function [11]. It basically
analyzes whether there is a concrete frequency content in
the concrete directions of the local region of the area of
analysis or analysis. A set of Gabor filters with different
frequencies and adaptations maybehelpful foranelementof
effective features from an image. Isolated domain, given by
2D Gabor filter,
Gc[i,j]=Be^((i^2+j^2)/(2µ^2))cos(2πf(icosβ+jsinβ))...(1)
Gc[i,j]=Ce^((i^2+j^2)/(2µ^2))sin(2πf(icosβ+jsinβ))…(2)
Where B and C determine the normalization reason. 2-D
Gabor filters are rich in image processing, especially texture
analysis and category features. F definesthefittedfrequency
for the texture. By varying β, we can look for a specific
texture based texture. By varying µ, we support the basis of
the region or size of the image being analyzed.](https://image.slidesharecdn.com/irjet-v5i1206-181227065633/75/IRJET-A-New-Strategy-to-Detect-Lung-Cancer-on-CT-Images-2-2048.jpg)
![International Research Journal of Engineering and Technology (IRJET) e-ISSN: 2395-0056
Volume: 05 Issue: 12 | Dec 2018 www.irjet.net p-ISSN: 2395-0072
© 2018, IRJET | Impact Factor value: 7.211 | ISO 9001:2008 Certified Journal | Page 29
Figure 2: Original Image to Gabor Image
3.4 Image Segmentation:
Image segmentation helps make the presentation of such an
image more meaningful and easier to analyze. Image
segmentation objects and borders are allocated. This is the
process of determining the label of pixels per image, such as
labelled pixels sharing specific visual properties [12]. Image
splitting result is a set of segments that covers a set of
contours that are fully taken from the entire image or image.
Each pixel in a region's image is significantly different from
some of the featured or notable properties, such as color,
intensity, or texture, related to similar features. [13] In this
study, we have used the adaptive threshold image
segmentation method:
Adaptive threshold: Adaptive Thresholding usuallytakesa
grayscale or color image as input and, in a simple
implementation, represents a binary image segmentation
output. For each pixel of the image, a threshold has been
calculated. If the pixel value is below thethreshold,itissetto
the background value, otherwise, it estimates the forum
value. In adaptive thresholding, different threshold values
for different local areas are used.
There are two main ways to find threshold: (i) Chow and
Kaneko [14] methods and (ii) Local thresholding. The idea
behind both methods is that the smaller image can have
almost identical illuminations in the region, thus making it
more suitable for thresholding. Chow and Kaneko segment
an image into a row overlapping subcontinent and find out
the best threshold for each sub-continentbyinvestigatingits
histogram. The results of threshold submissions are
separated for every single pixel. The error of this method is
computational and is therefore not suitable for real-time
applications.
Figure 3: Gabor to threshold
3.5 Body Region extraction
In this study, the body area of a lung city image was found
using MATLAB's Image ProcessingToolbox'sREGIONPROPS
function. The binary image of the adaptive threshold was
considered as input on REGIONPROPS, and a decreasing set
of features was selected to describe the binary image. The
selected features were 'Area', 'Boundingbox' and 'Field
Image'. The 'area' was a scalar, indicatingthetotal numberof
pixels in each part of the image. The lower edge of the
'Boundingbox' volume has the coordinate and the minimum
area rectangle in the area with length and width. The
'FilledImage' binary image filling the logical matrix which
was the same size in the same region. After counting three
properties, the indicator related to the area related to the
greater area was obtained, then the minimum encoding
rectangles can be taken to crop the noise-free image and the
area of the body used as a template to extract the fill image.
Figure 4: Threshold to Region Glow
4. Feature Extraction
For extracting feature using the Gray-level co-occurrence
Matrix (GLCM) to represent a set of features to reduces the
misclassification of the glaucoma image. GLCM describes
how many coordinates of pixel brightnessvaluesinanimage
illustration. GLCM represents the combined frequency of all
pairs of gray levels i and j divided by a distance in the
direction of nodules. GLCM Characteristicsofbasiccharacter
areas, perimeter, and Eccentricity this scale is measured in
[15]. The GLCM, proposed by Haralick [20], was utilized as
the main tool for image texture analysis in this study. A
binary representation of the shape object expanded. Size
features refer to the geometric properties of an object, and
the external boundary is used to calculate these
characteristics. The area, perimeter, and circularity are big
features that we count in our method. Extra shape features
can provide powerful informationforthecategoryofimages.
The properties of shape vary for different types of a tumour.
Size is calculated by using the image region attached to the
image. Boundary pixel circumference and area are counted.
The measurement is calculated using the area and the
circumference. The formulas used to calculate size features
are given in table 1.](https://image.slidesharecdn.com/irjet-v5i1206-181227065633/75/IRJET-A-New-Strategy-to-Detect-Lung-Cancer-on-CT-Images-3-2048.jpg)
![International Research Journal of Engineering and Technology (IRJET) e-ISSN: 2395-0056
Volume: 05 Issue: 12 | Dec 2018 www.irjet.net p-ISSN: 2395-0072
© 2018, IRJET | Impact Factor value: 7.211 | ISO 9001:2008 Certified Journal | Page 31
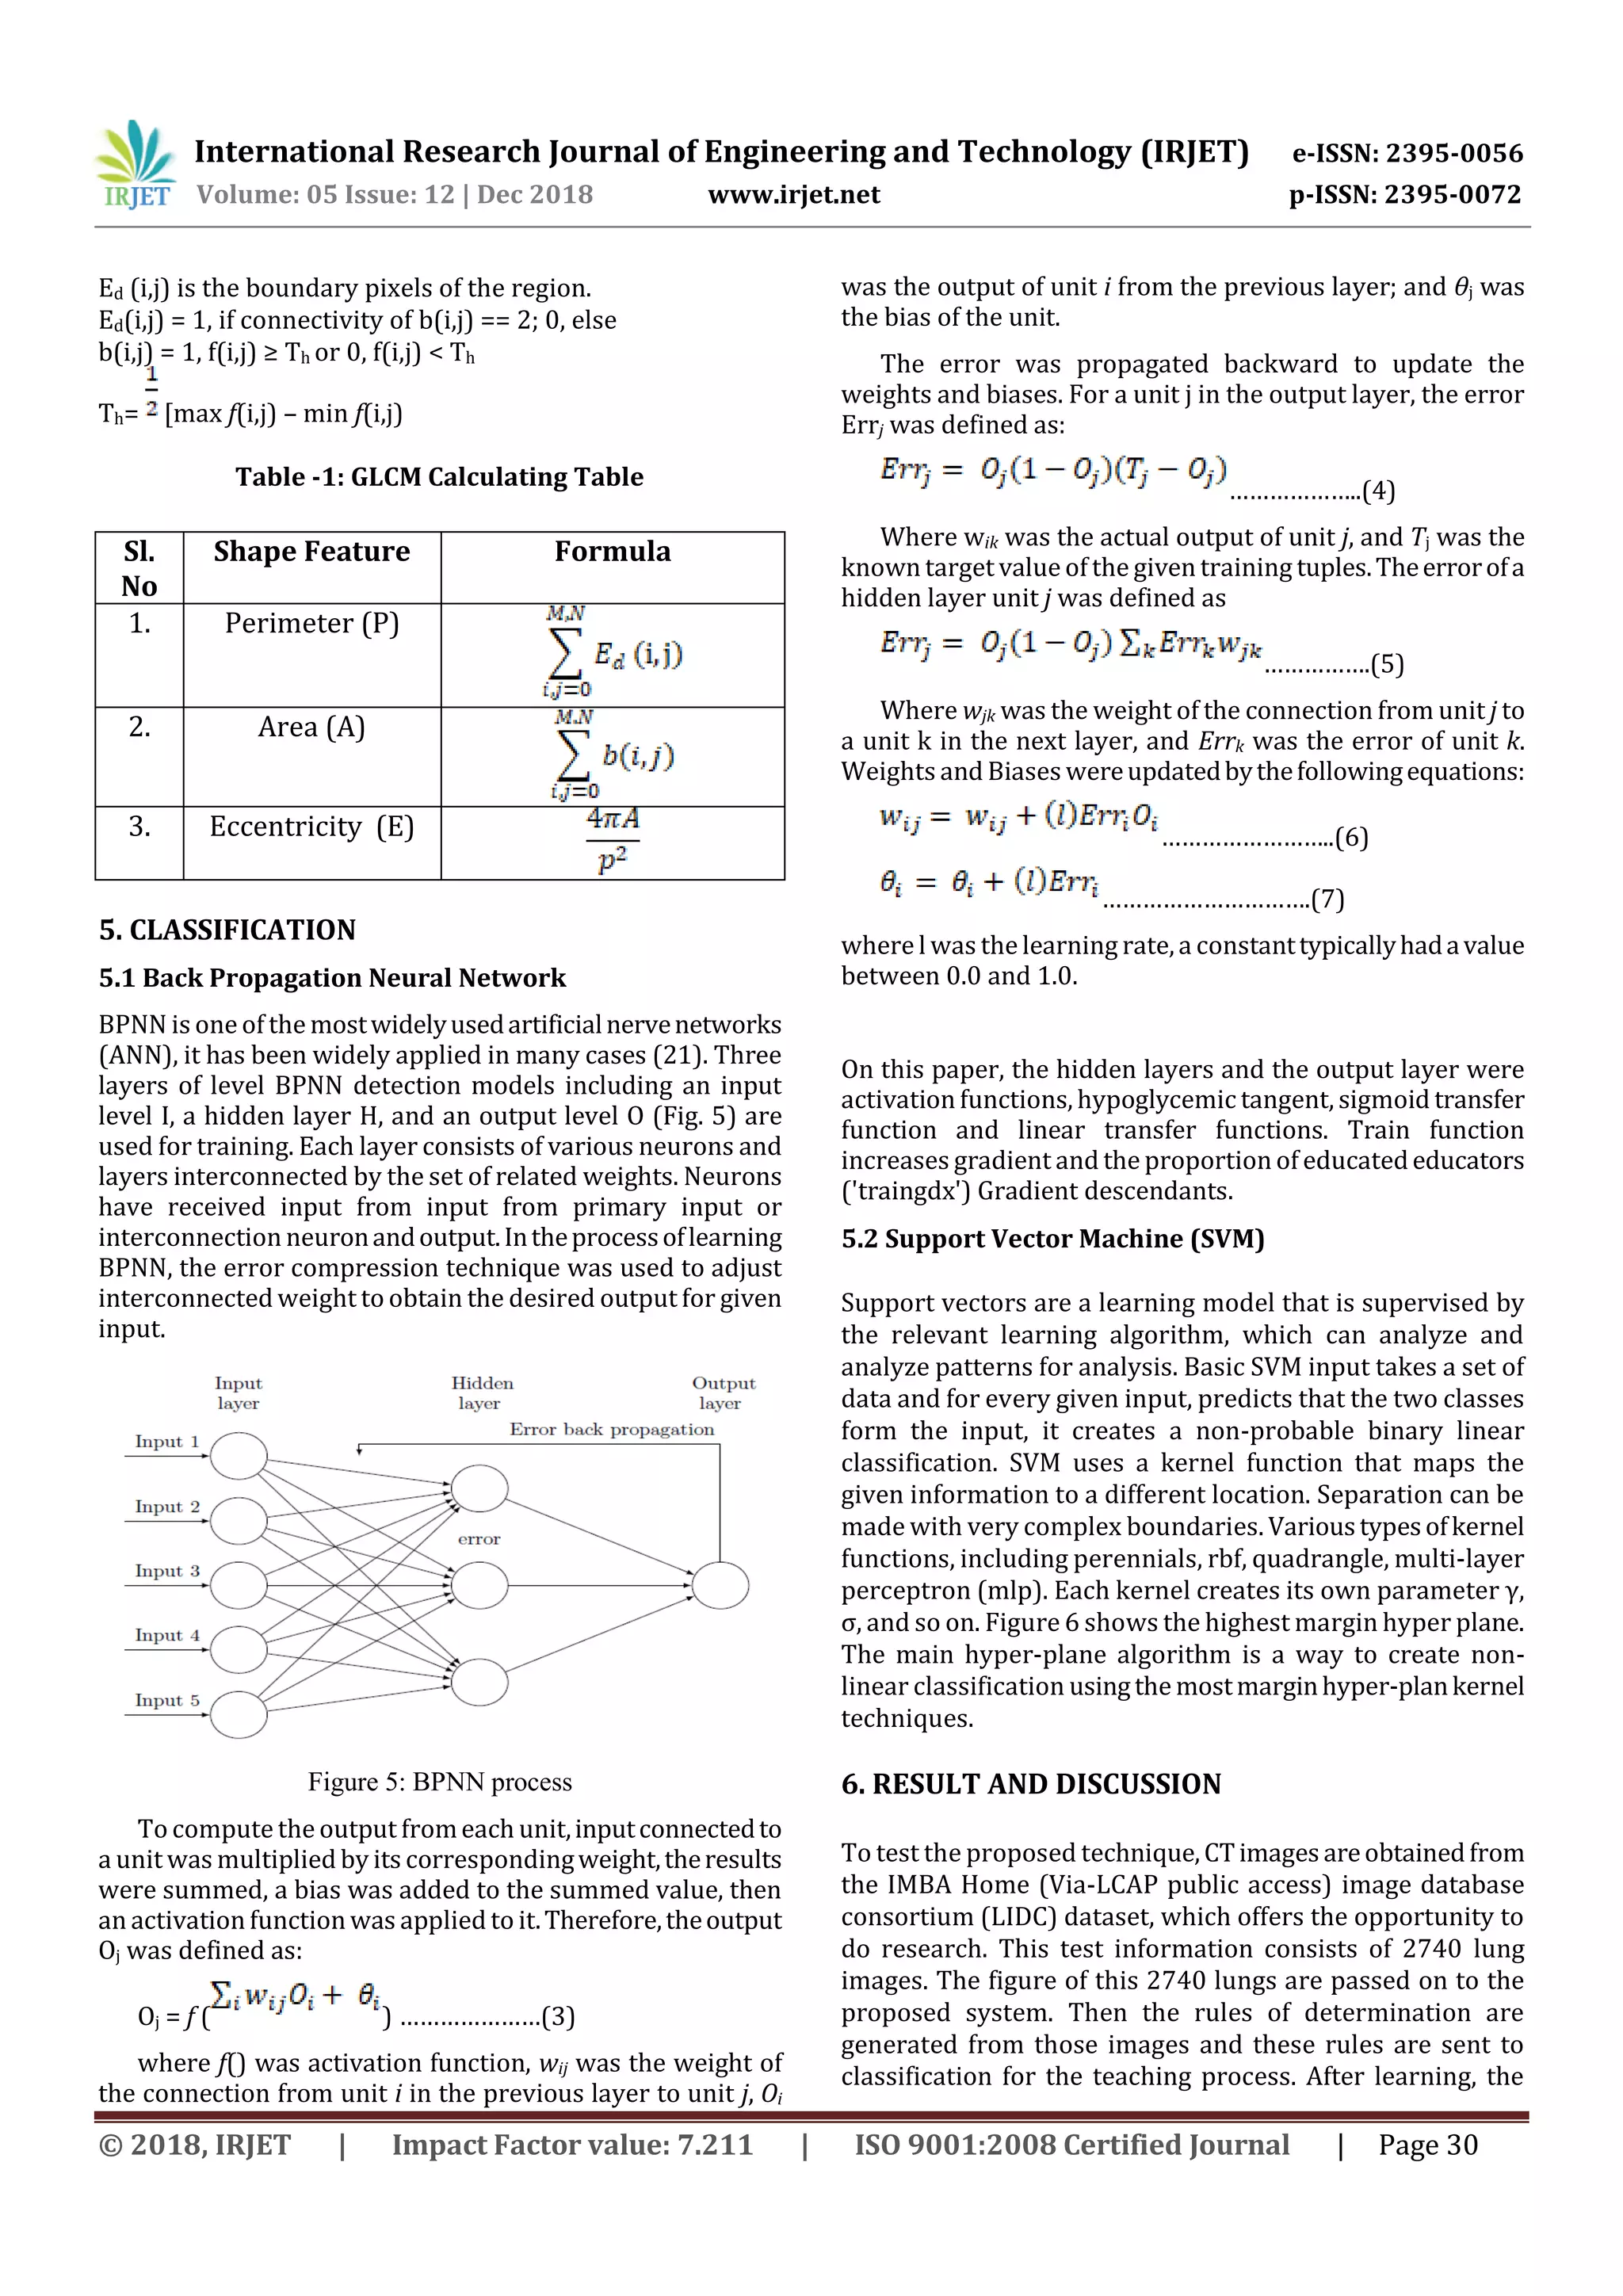
lungs picture is passed on to the proposed system. Then the
proposed procedure will be processed through its
processing steps and finally it will detect whether lung
cancer is cancerous or not. Table 2 listed the performance of
BPNN and SVM models on the prediction set.Itcouldbeseen
that BPNN model has a better performance than SVM model
on identification lung cancer from CT images. BPNN model,
the Accuracy was 96.32%, the Error rate was just 3.68%,the
Sensitivity was 96.71%, and the Specificity was 96.09%.
While for SVM model, the Accuracy was 83.07%, the Error
rate was 16.93%, the Sensitivity was 65.64%, the Specificity
was 92.36%, it suggested that BPNN was more suitable and
effective for lung cancer detection from CT images.
Figure 6: Detected image
Table:2 Performance of BPNN and SVM
Classifier Accuracy Error
rate
Sensitivity Specificity
BPNN 96.32% 3.68% 96.71% 96.71%
SVM 83.07 % 16.93 % 65.64 % 92.36 %
In this study, it was shown that lung cancer can be detected
in early stage of city images using image processing
technology and artificial intelligent algorithms. In our
proposed system, first, the City images were extended to
remove sounds using the Gobo Filter.Second,thepredefined
images are converted into binary images by following the
thresholding method. Thirdly, physical areas are expelled
from binary images (in contrast, correlation, energy and
unity) using GLCM in body areas. Finally, BPNN and SVM,
together with features, are used to establish lung cancer
detection models. The results showed that the BPL model
and SVM model estimates were respectively 96.32% and
83.07% for lung cancer detection at Forecast Set (2740
Figures), it has been decided that the SVM-based model is a
promising tool for recognition of lung cancer at the initial
stage, above The theory proves validation. In the future, we
will apply deeper nerve network tactics to lung cancer
detection problems and look for new systemsfor pulmonary
needle detection.
REFERENCES
[1] M . S. Al-Tarawneh, “Lung cancer detection using image
processing techniques,” Leonardo Electronic Journal of
Practices and Technologies, vol. 11, Jan. 2012, pp. 147-
158.
[2] A. Chaudhary, & S. S. Singh, “Lung Cancer Detection on
CT Images by Using Image Processing,” Proc.
International Conference on Computing Sciences (ICCS
12), IEEE Computer Society, Sep. 2012, pp. 142-146,
doi:10.1109/ICCS.2012.43.
[3] B. Sahiner, H. P. Chan, L. M. Hadjiiski, P. N Cascade, A. R.
Chughtai, C. Poopat, T. Song, L. Frank, J. Stojanovska, A.
Attili, Effect of CAD on radiologists' detection of lung
nodules on thoracic CT scans analysis of an observer
performance study by nodule size: Acad Radiol, vol.16,
no.12, pp.1518-1530, Dec 2009.
[4] V. B. Ginneken, T. B. Romeny, and M. A. Viergever,
“Computeraided diagnosis in chest radiography: a
survey,” IEEE Transactions on Medical Imaging, vol. 20,
Dec. 2001, pp. 1228-1241, doi:10.1109/42.974918.
[5] K. Dimililer, Y. Kirsal-Ever, and B. Ugur, “Tumor
Detection on CT Lung Images using Image
Enhancement,” The Online Journal of Science and
Technology, vol. 7, Jan. 2017, pp. 133-138.
[6] P. B. Sangamithraa, and S. Govindaraju, “Lung tumour
detection and classification using EK-Mean clustering,”
Proc. International Conference on Wireless
Communications, Signal Processing and NETWORKING
(WiSPNET 16), IEEE, Mar. 2016, pp. 2201-2206,
doi:10.1109/WiSPNET.2016.7566533.
[7] M. Mai, A. Karrar, and A. Sharawy, “Computer aided
detection of large lung nodules using chest computer
tomography images,” International Journal of Applied
Information Systems, vol. 3, Aug. 2012, pp. 12-18,
doi:10.5120/ijais12-450560.
[8] C. Lau, Neural networks: theoretical foundations and
analysis, IEEE press, 1991.
[9] C. H. Chen, L. F. Pau, and P. S. P. Wang, “Handbook of
pattern recognition and computer vision,” World
Scientific, vol. 50, 2005, pp. 996, doi:10.1142/1802.
[10] H. Rutika r, “Automated detection and diagnosis from
lungs CT scan images”, International Journal of
Emerging Technologies and Innovative Research
(www.jetir.org — UGC and issn Approved), ISSN:2349-
5162, vol. 2, no. 3, pp. pp785-787, 2015.
[11] S. Avinash, K. Manjunath and S. Kumar, “An improved
image processing analysis for the detection of lung
cancer using Gabor filters and watershed segmentation
technique”, 2016 International ConferenceonInventive
Computation Technologies (ICICT), 2016.
[12] M. Firmino, G. Angelo, H. Morais, M. Dantas and R.
Valentim, “Computer-aided detection (CADe) and
diagnosis (CADx) system for lung cancer withlikelihood
of malignancy”, BioMedical Engineering OnLine, vol.15,
no. 1, 2016.
[13] H. Ren, Y. Zhou and M. Zhu, “Tree Image Segmentation
Based on an Improved Two-Dimensional Otsu
Algorithm”, International Journal of HybridInformation
Technology, vol. 9, no. 9, pp. 199-210, 2016.
[14] C.K.CHow and T.Kaneko. Automatic boundary detection
of the left-ventricle from cineangiograms. Comput.
Biomed., 5:388–410, 1972.
[15] M. H. Jony, “Early Detection of LungCancerfromCTScan
Images Using GLCM and SVM”ProceedingsoftheIEEyet
to published.
[16] R. M. Haralick, “Statistical and structural approaches to
texture,” Proceedings of the IEEE, vol. 67, May. 1979, pp.
786-804, doi:10.1109/PROC.1979.11328.
7. CONCLUSION](https://image.slidesharecdn.com/irjet-v5i1206-181227065633/75/IRJET-A-New-Strategy-to-Detect-Lung-Cancer-on-CT-Images-5-2048.jpg)
![International Research Journal of Engineering and Technology (IRJET) e-ISSN: 2395-0056
Volume: 05 Issue: 12 | Dec 2018 www.irjet.net p-ISSN: 2395-0072
© 2018, IRJET | Impact Factor value: 7.211 | ISO 9001:2008 Certified Journal | Page 32
[17] Penedo. M. G, Carreira. M. J, Mosquera. A and Cabello. D,
“Computeraided diagnosis: a neuralnetwork- based
approach to lung nodule detection”, IEEE Transactions
on Medical Imaging, vol: 17, pp: 872 – 880, 1998.
BIOGRAPHIES
Fatema Tuj Johora, received her
B.Sc. degree from Green University
of Bangladesh, in 2017. She is
currently a contractual Lecturer of
Computer Science & Engineering
Department in Green University of
Bangladesh. Her researchinterests
include privacy and security in
cloud database.
Mehdi Hassan Jony received his
B.S. degree from Green University
of Bangladesh, in 2017. He is
currently pursuing the M.S. degree
in information security from Hefei
University of Technology, China.
His research interests include
privacy and security in database.
Parvin Khatun, received her B.Sc.
degree from Green University of
Bangladesh, in 2017. She is
currently a junior lecturer of
Computer Science & Engineering
Department in Green University of
Bangladesh. Her researchinterests
include privacy and security in
cloud database.](https://image.slidesharecdn.com/irjet-v5i1206-181227065633/75/IRJET-A-New-Strategy-to-Detect-Lung-Cancer-on-CT-Images-6-2048.jpg)

This document presents a new strategy for detecting lung cancer on CT images using image processing techniques. It involves acquiring CT scan images, preprocessing the images through techniques like grayscale conversion and Gabor filtering, segmenting the images using adaptive thresholding, extracting regions of interest through feature extraction methods like GLCM, and classifying images as cancerous or normal using support vector machines (SVM) and backpropagation neural networks (BPNN). The methodology achieves 96.32% accuracy for SVM and 83.07% accuracy for BPNN in detecting lung cancer from CT images.