Download as PDF, PPTX

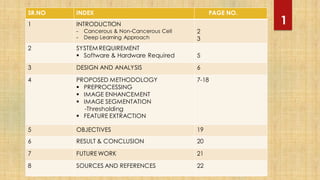


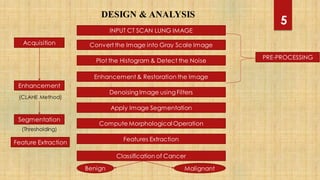
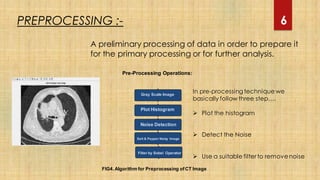
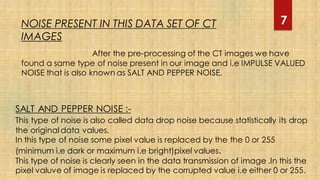


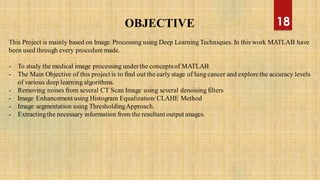


The document outlines a project focused on using deep learning techniques for lung cancer detection from CT images, detailing the methodologies involved in image acquisition, preprocessing, segmentation, and feature extraction. It emphasizes the importance of accurate diagnosis and early detection of lung cancer to improve survival rates, and includes future work aimed at enhancing system efficiency and accuracy. The project was conducted as part of a Bachelor of Technology program under the supervision of an assistant professor and includes technical specifications for hardware and software requirements.


![Attack surfaces and attack tress[inform]](https://cdn.slidesharecdn.com/ss_thumbnails/lecture03-260108015941-a4dee53b-thumbnail.jpg?width=640&height=640&fit=bounds)


