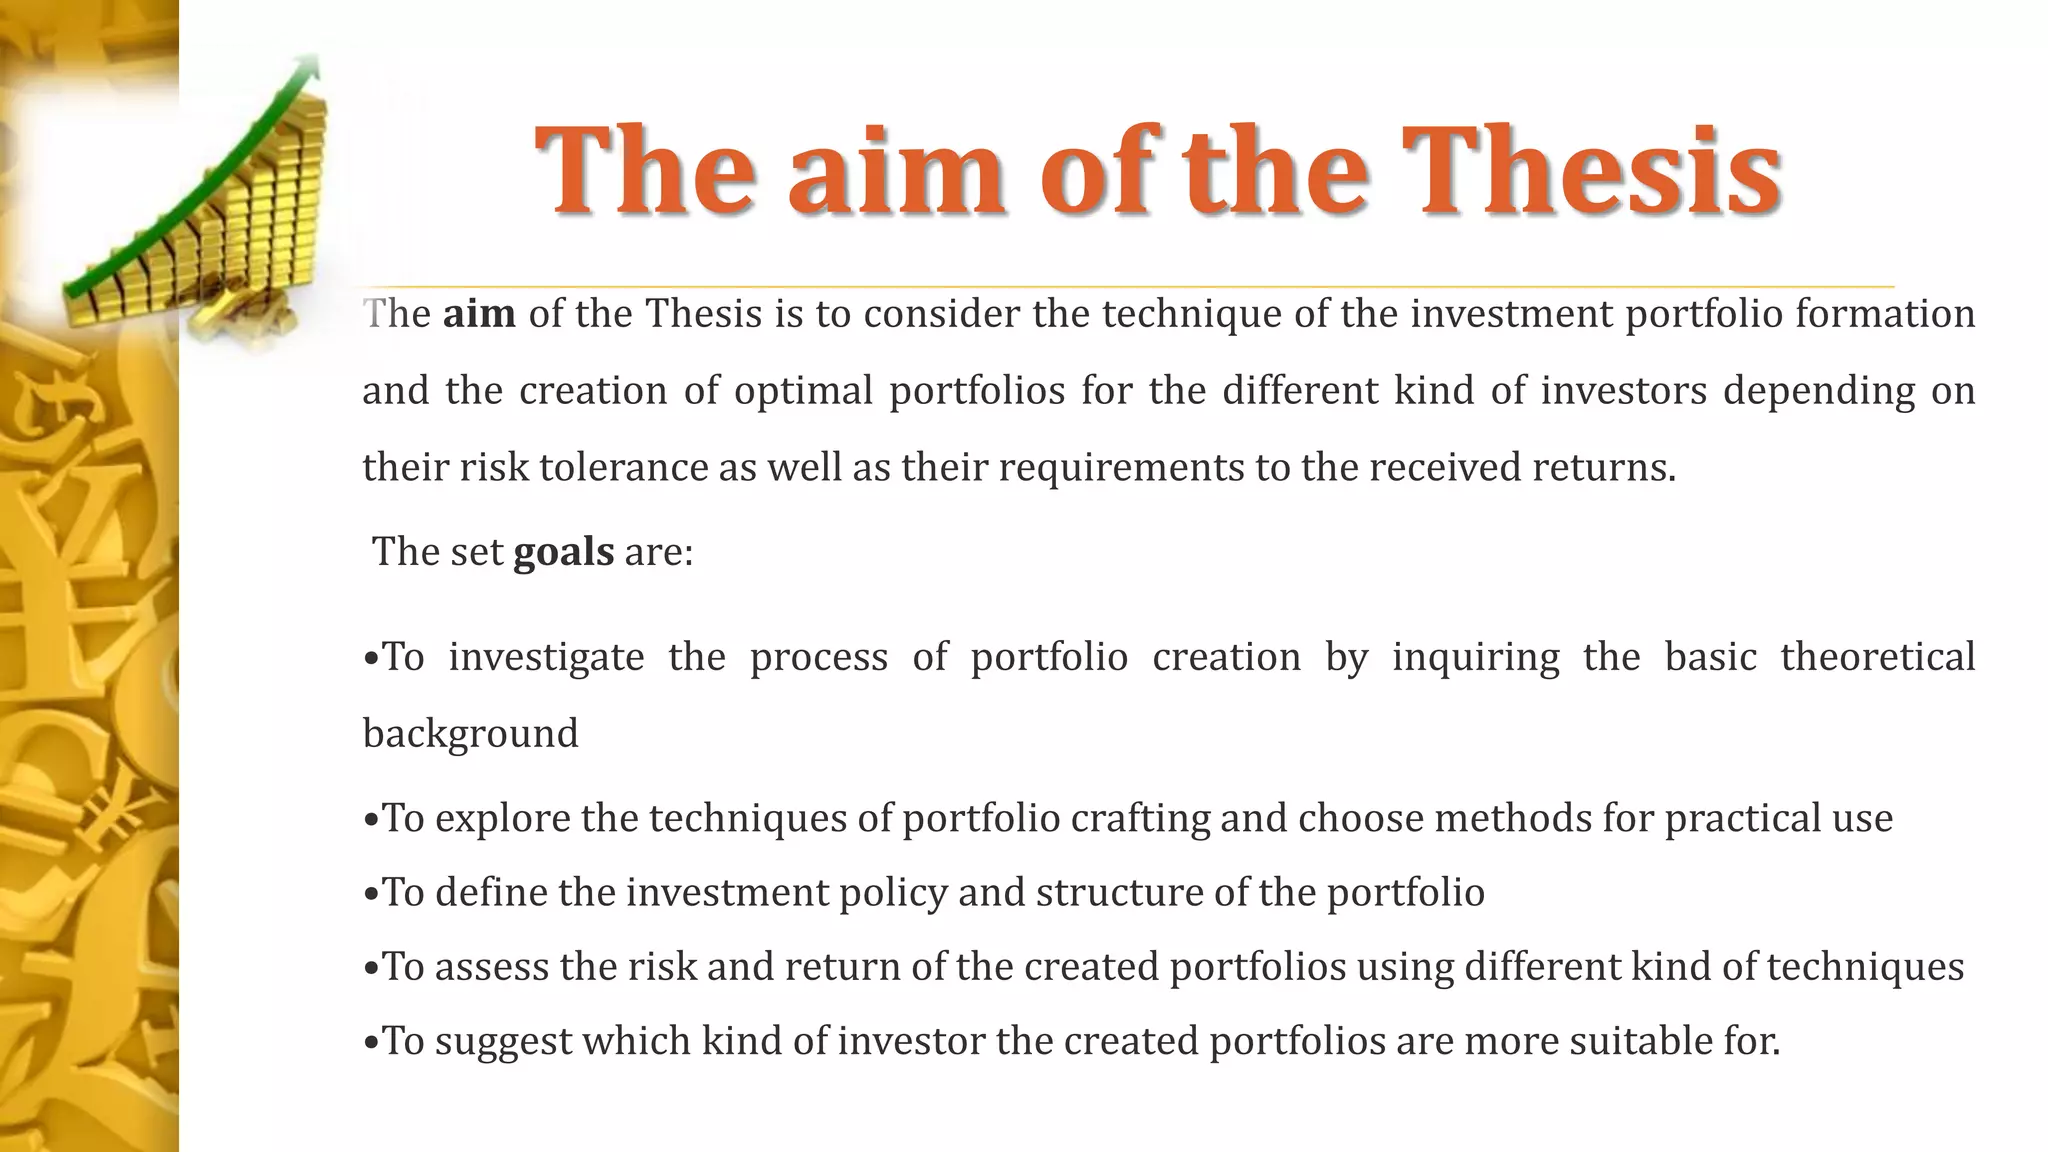
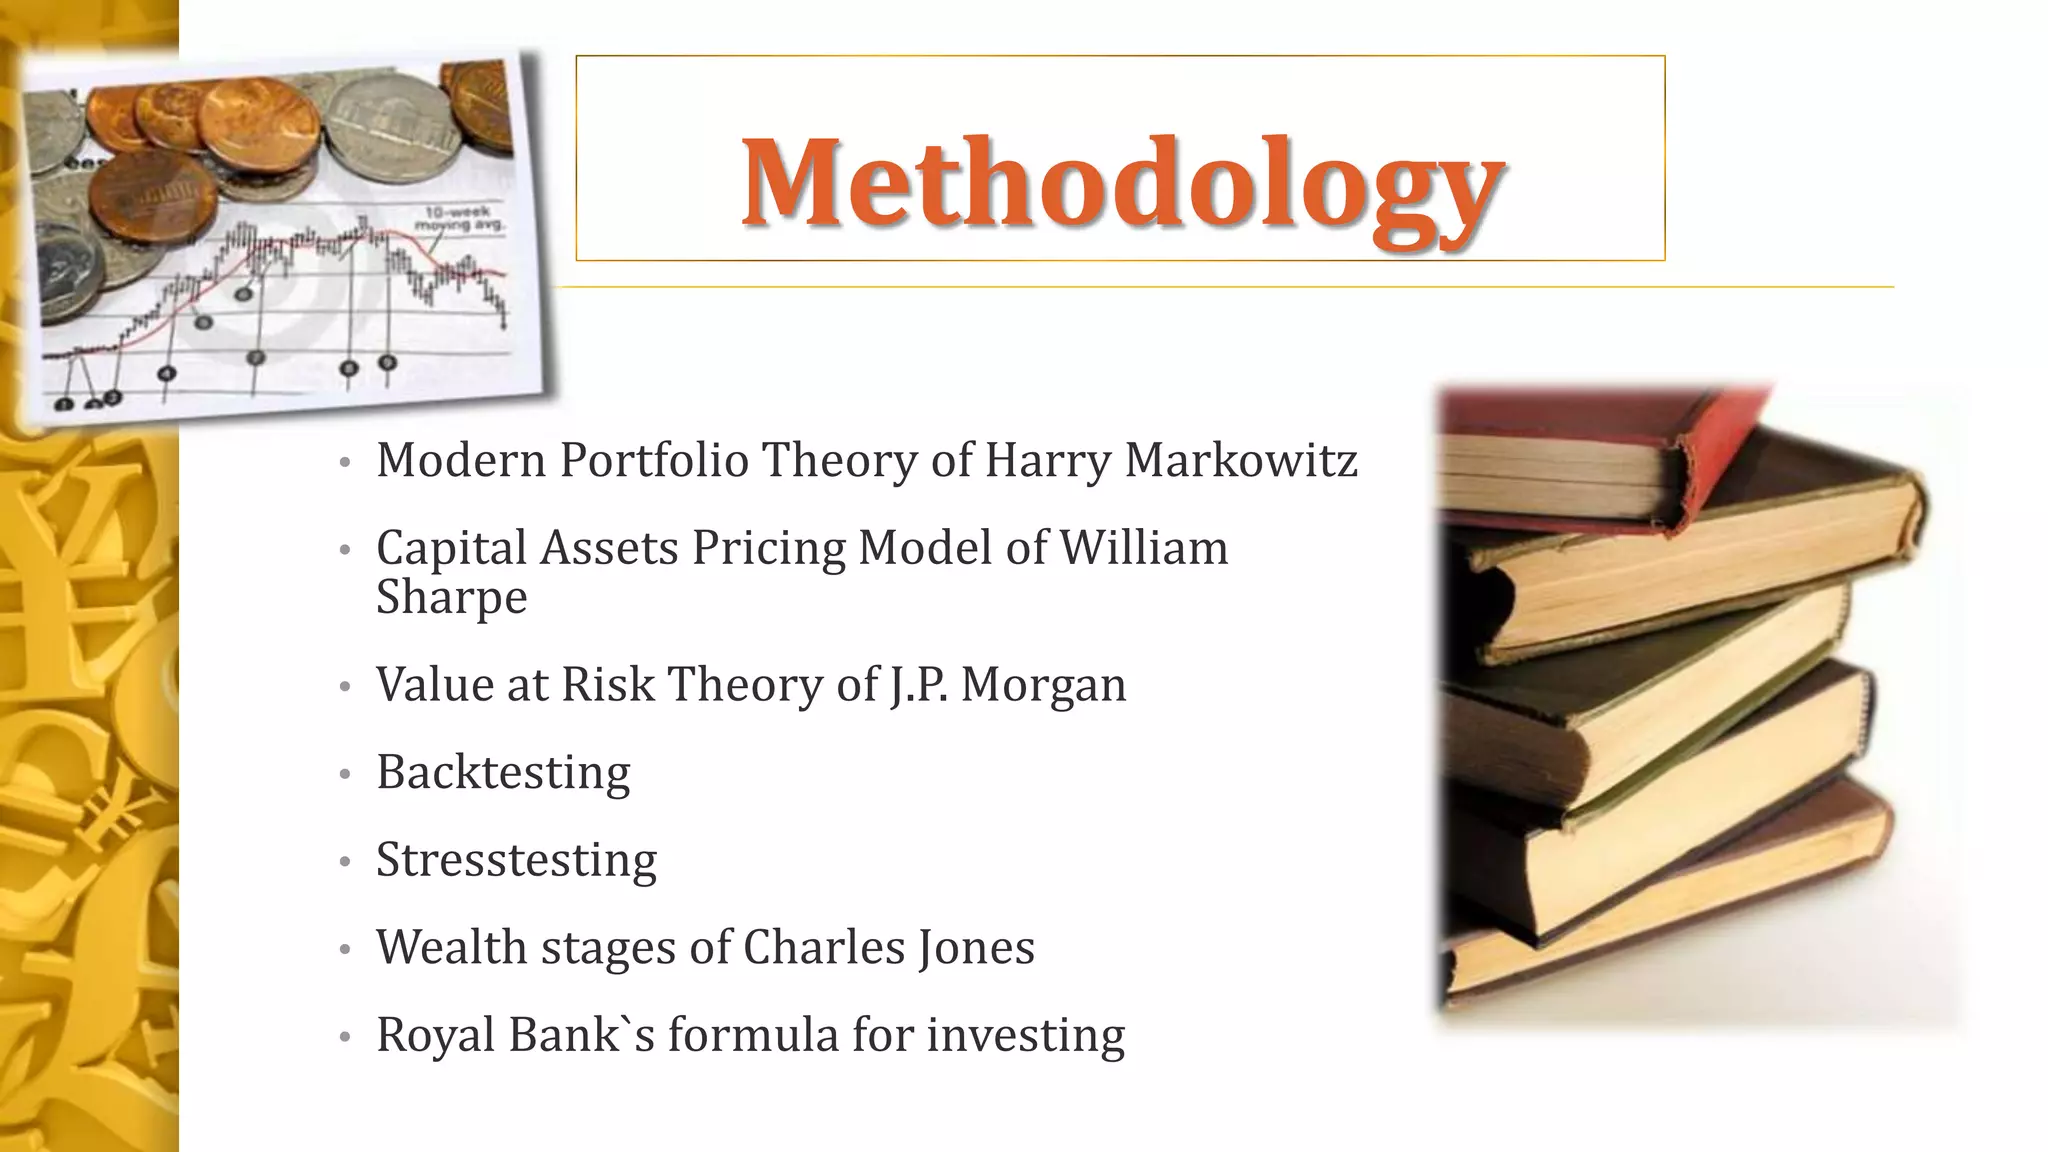
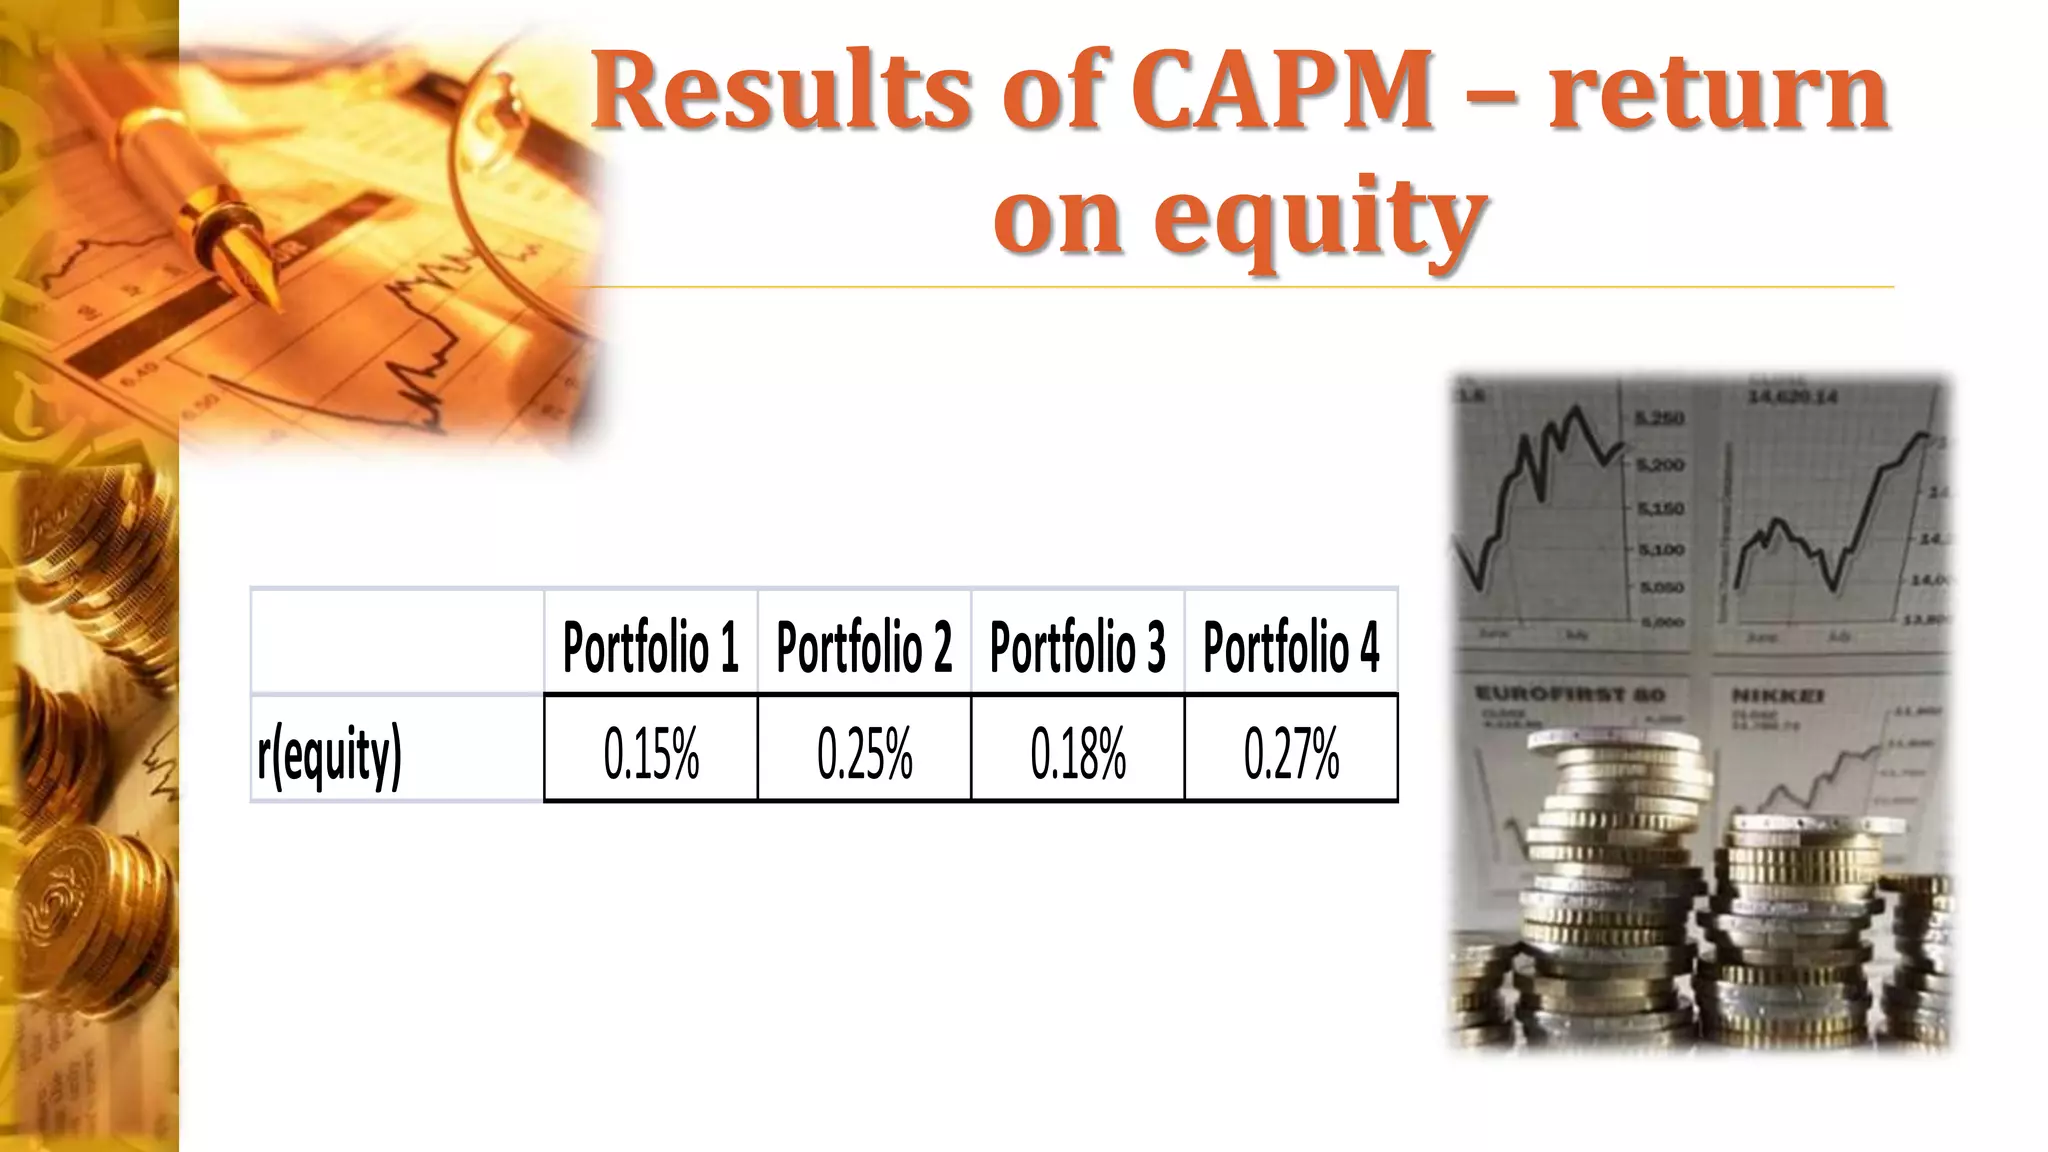
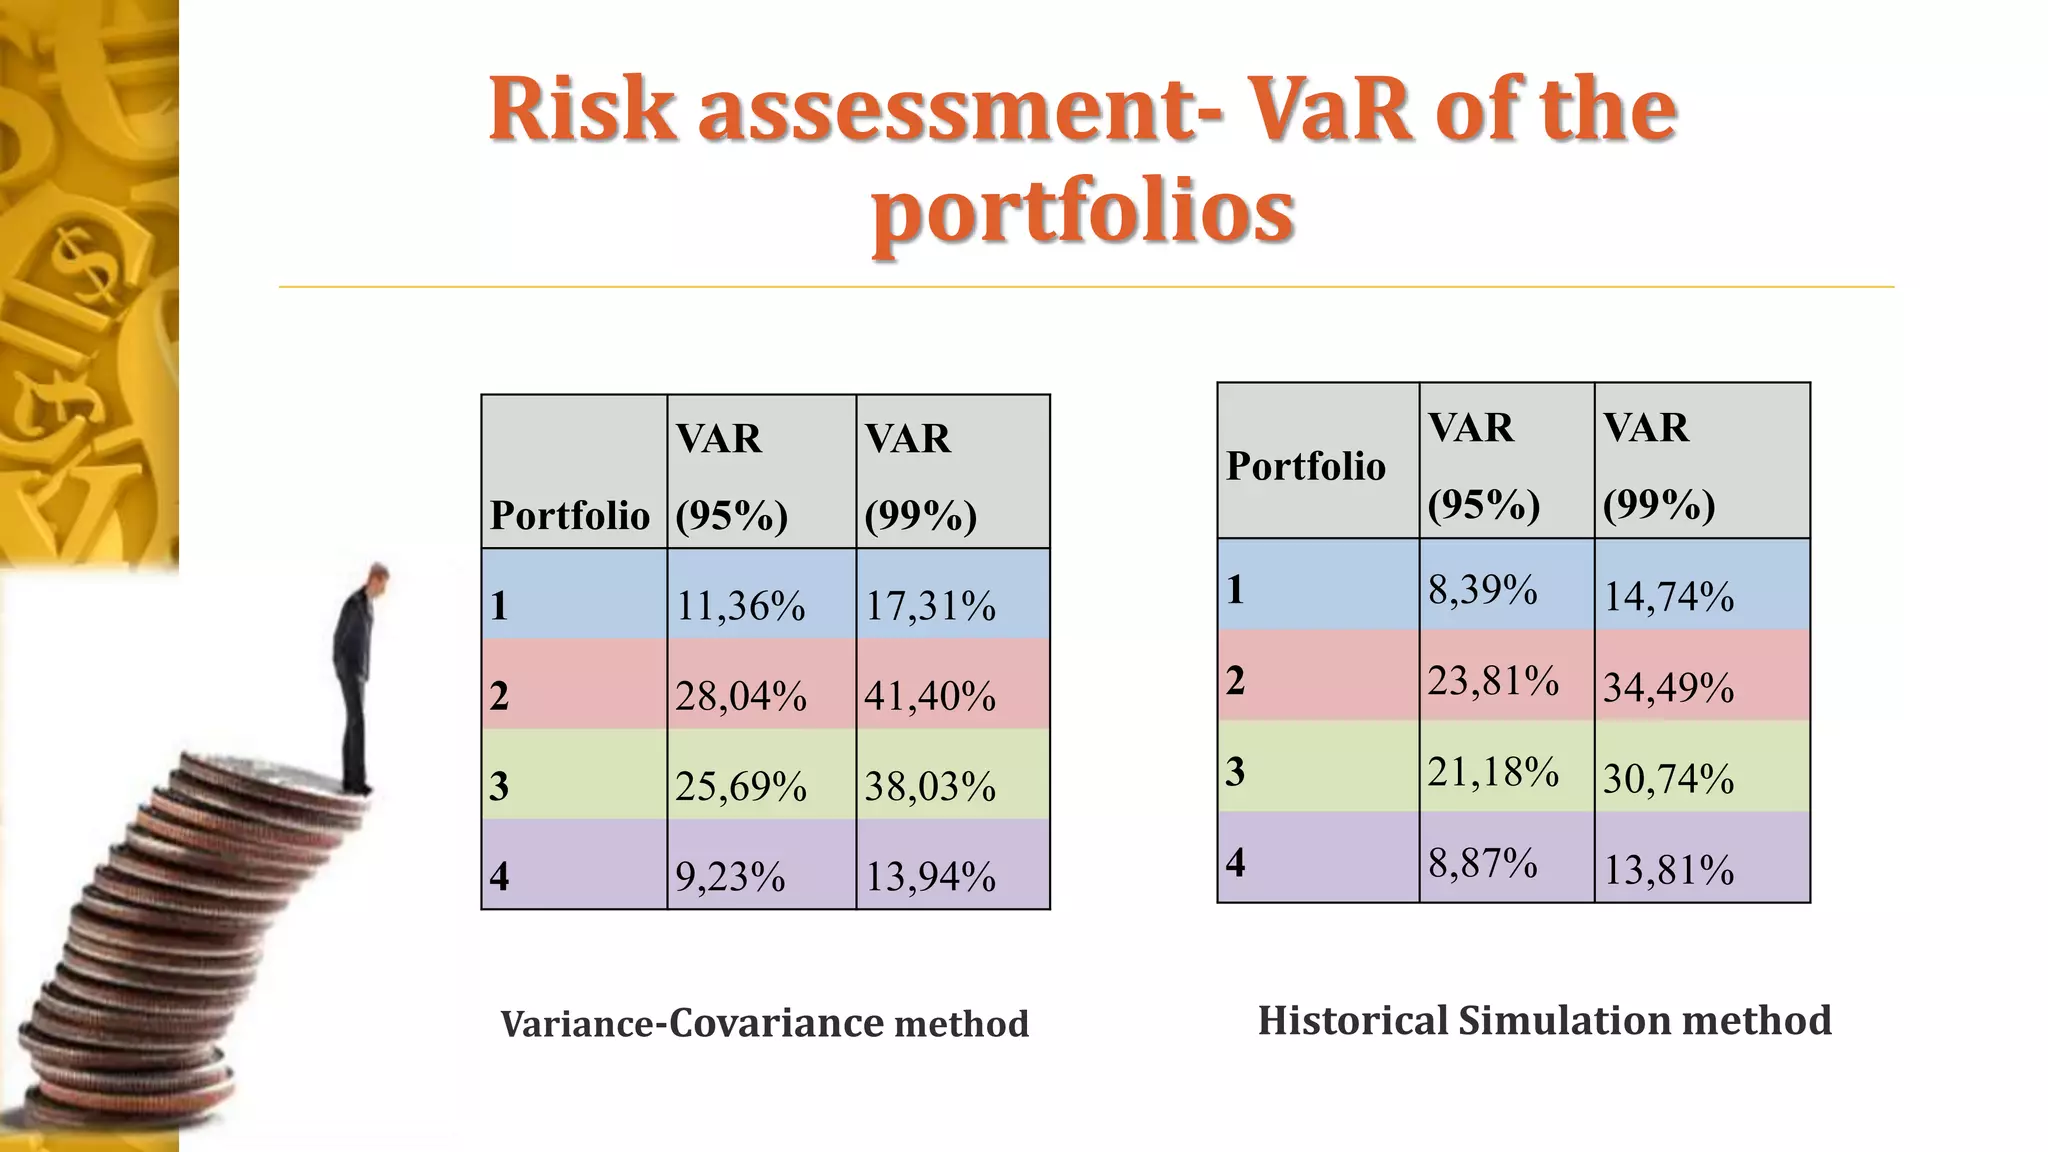
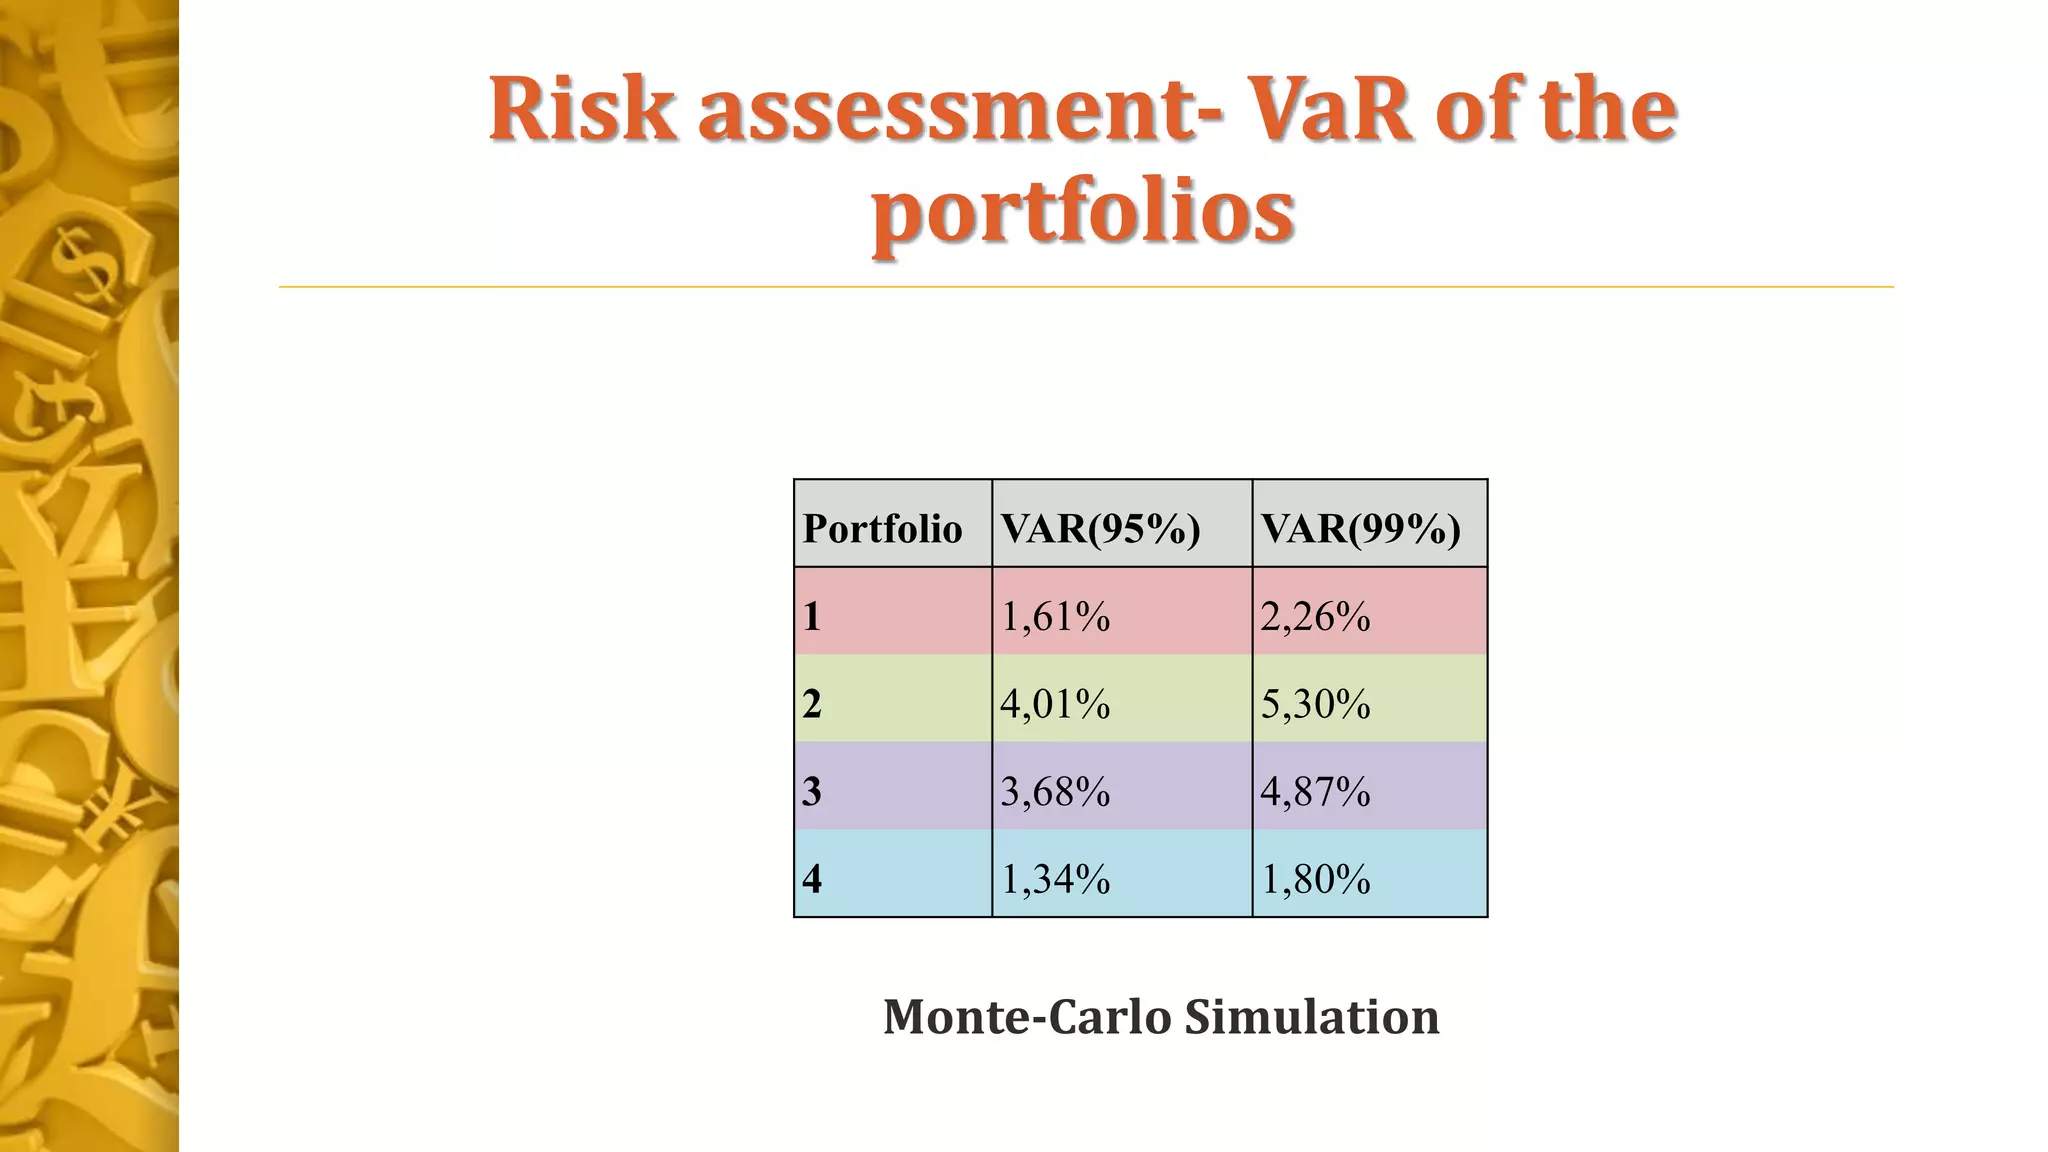
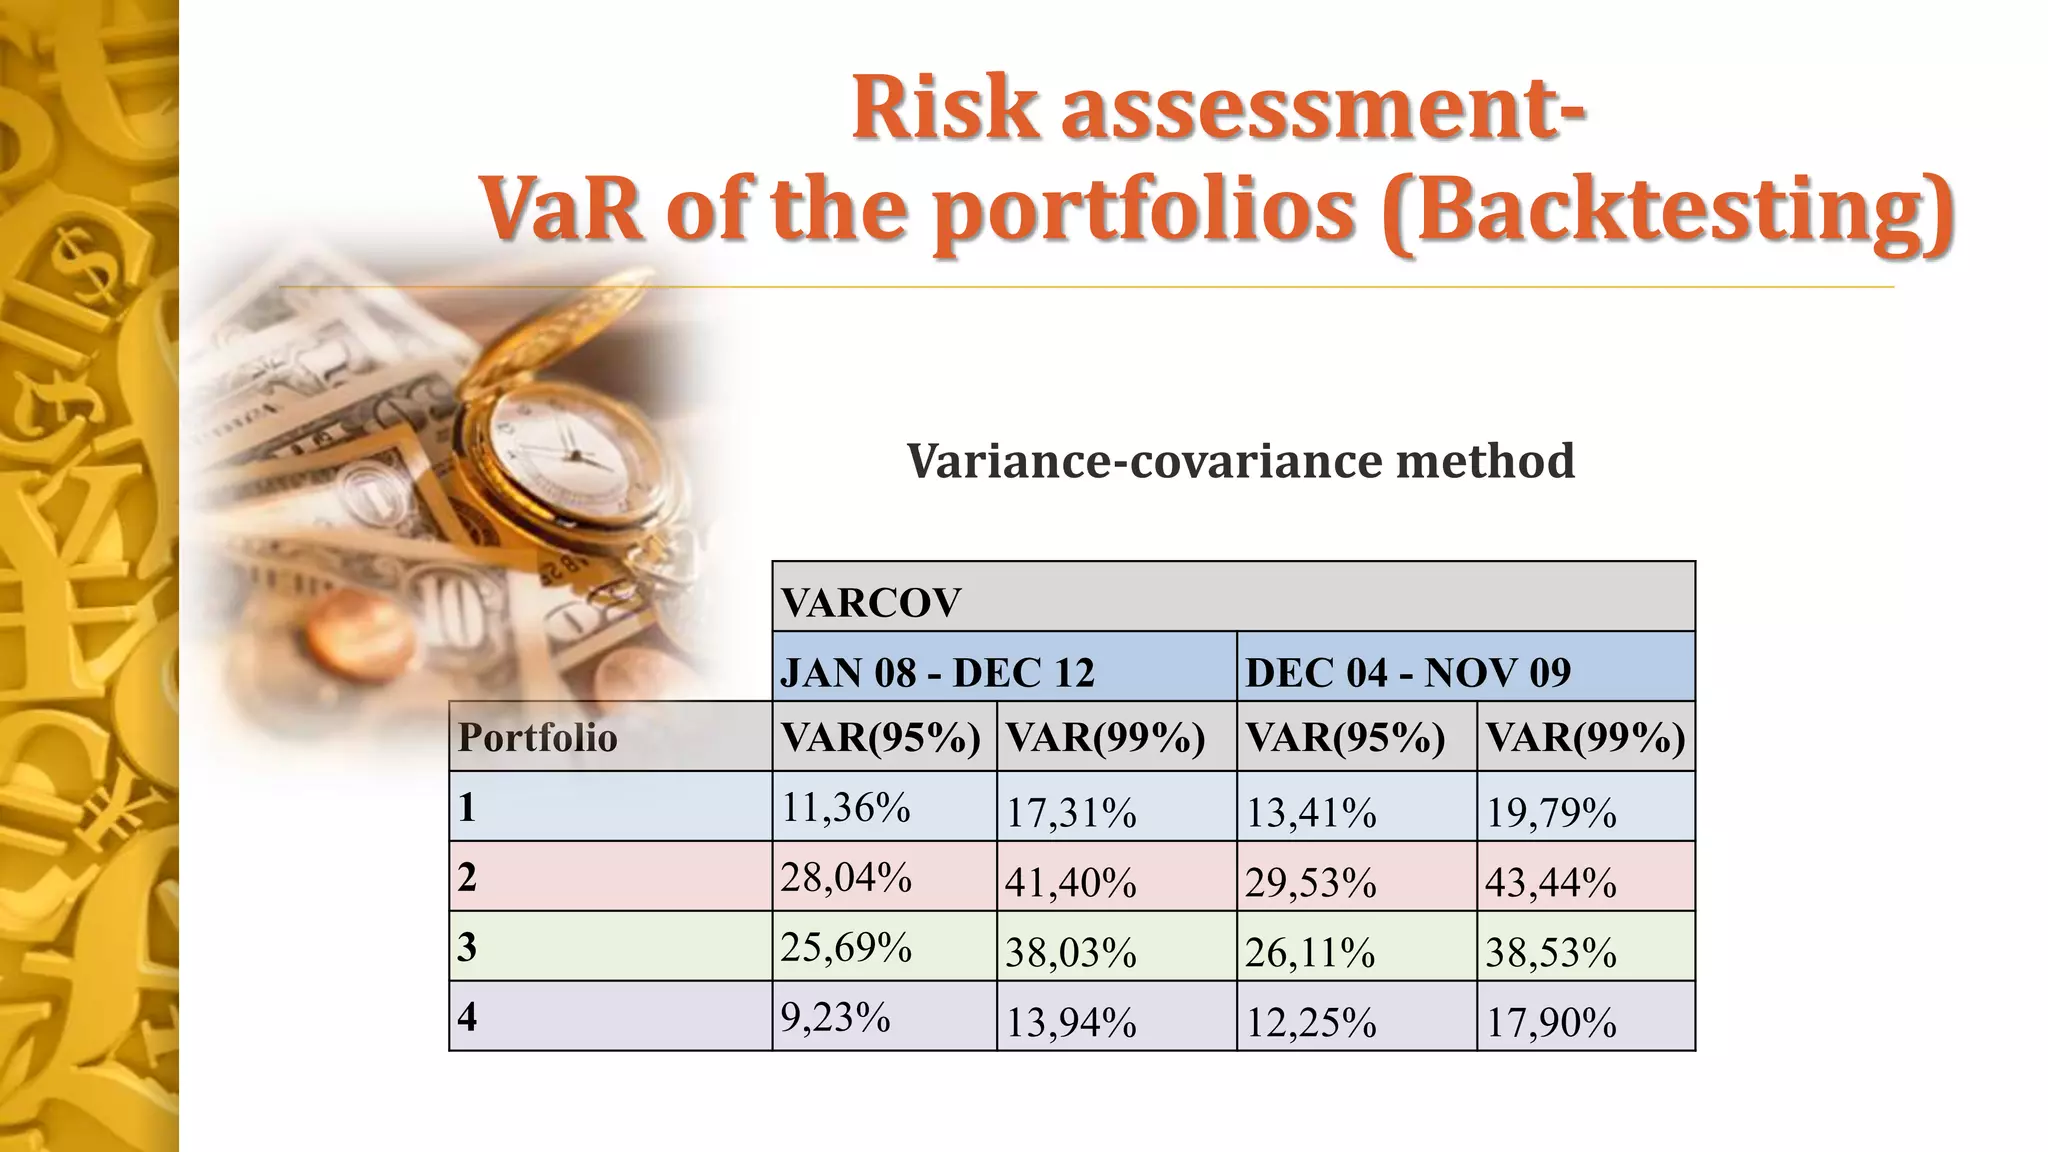
Risk/return ratio
of an investment
portfolio
Made by Maria Lavrova
13 June 2013
The aim of the Thesis
The aim of the Thesis is to consider the technique of the investment portfolio formation
and the creation of optimal portfolios for the different kind of investors depending on
their risk tolerance as well as their requirements to the received returns.
The set goals are:
•To investigate the process of portfolio creation by inquiring the basic theoretical
background
•To explore the techniques of portfolio crafting and choose methods for practical use
•To define the investment policy and structure of the portfolio
•To assess the risk and return of the created portfolios using different kind of techniques
•To suggest which kind of investor the created portfolios are more suitable for.
Methodology
• Modern Portfolio Theory of Harry Markowitz
• Capital Assets Pricing Model of William
Sharpe
• Value at Risk Theory of J.P. Morgan
• Backtesting
• Stresstesting
• Wealth stages of Charles Jones
• Royal Bank`s formula for investing
Place for potential investments- India
• Over the longer-term India is likely to be one of the fastest
growing large economies with at least 7% annual GDP growth
• India’s working-age population will increase by 240 million over
the next 20 years, which will significantly increase consumption
and lead to India’s consumer markets boom.
• Government investment in the country’s infrastructure is
soaring.
• India has heavy investments in education, health and agriculture
to give a new deal to rural India.
• Corporate earnings in India are growing at 35% annual rate,
especially among the manufacturing biggies and
telecommunication companies.
• The Indian stock-market has generated investment returns of
over 15% per annum for the last 10 years and experts predict
this rate to increase in the next decade.
Results- Expected returns and risks of the
stocks
E(R)
ExpReturn
𝜎
StandDev
E(R)/𝜎
Return/Risk
OIL 0,42% 15,51% 2,7%
INDIAN EXT 2,87% 27,42% 10,4%
G&C 3,01% 18,58% 16,2%
CEMENTS 1,99% 28,91% 6,9%
ABBOTT 2,17% 8,28% 26,2%
BINANI 0,95% 22,36% 4,3%
INFOSYS 0,78% 9,19% 8,5%
SATYAM -1,41% 16,63% -8,5%
MPHASIS 1,29% 13,66% 9,5%
TATA 0,67% 11,10% 6,1%
MEAN 1,27% 17,2%
Optimal
Portfolios
Objective MaxE(R) Min σ MaxE(R) Min σ
Constraining
variable at σ≤ E(R)≥ at σ≤ E(R)≥
Value of
constrain 8,28% 3,01% 17,16% 1,27%
Weights
OIL 0,00% 0,00% 0,00% 0,00%
INDIAN
EXT 12,88% 0,00% 11,01% 5,75%
G&C 26,90% 100,00% 88,99% 4,67%
CEMENTS 0,00% 0,00% 0,00% 2,67%
ABBOTT 60,22% 0,00% 0,00% 50,07%
BINANI 0,00% 0,00% 0,00% 0,00%
INFOSYS 0,00% 0,00% 0,00% 28,70%
SATYAM 0,00% 0,00% 0,00% 0,74%
MPHASIS 0,00% 0,00% 0,00% 0,00%
TATA 0,00% 0,00% 0,00% 7,39%
ΣW= 100% 100% 100% 100%
μ(p)= 2,49% 3,01% 2,99% 1,71%
σ(p)= 8,28% 18,58% 17,16% 6,55%
μ/σ(p)= 0,3 0,16 0,17 0,26
Donotputalleggsintoone
basket
Results of CAPM – return
on equity
Portfolio1 Portfolio2 Portfolio3 Portfolio4
r(equity) 0.15% 0.25% 0.18% 0.27%
Risk assessment- VaR of the
portfolios
Portfolio
VAR
(95%)
VAR
(99%)
1 11,36% 17,31%
2 28,04% 41,40%
3 25,69% 38,03%
4 9,23% 13,94%
Portfolio
VAR
(95%)
VAR
(99%)
1 8,39% 14,74%
2 23,81% 34,49%
3 21,18% 30,74%
4 8,87% 13,81%
Variance-Covariance method Historical Simulation method
Risk assessment- VaR of the
portfolios
Portfolio VAR(95%) VAR(99%)
1 1,61% 2,26%
2 4,01% 5,30%
3 3,68% 4,87%
4 1,34% 1,80%
Monte-Carlo Simulation
Risk assessment-
VaR of the portfolios (Backtesting)
VARCOV
JAN 08 - DEC 12 DEC 04 - NOV 09
Portfolio VAR(95%) VAR(99%) VAR(95%) VAR(99%)
1 11,36% 17,31% 13,41% 19,79%
2 28,04% 41,40% 29,53% 43,44%
3 25,69% 38,03% 26,11% 38,53%
4 9,23% 13,94% 12,25% 17,90%
Variance-covariance method
Results- the least risky portfolio
• Relying on the results, the best risk/return
opportunities are presented by the first and the
fourth portfolios. First portfolio offers higher
standard deviation, at the same time it offers higher
average return. Fourth portfolio is least risky with
lower return. Markowitz risk/return tradeoff is
confirmed there.
• Those portfolios suit more to risk-averse investors or
for those individuals who, according to Charles Jones
(2010), view their wealth in spending phase.
• According to Royal Bank`s formula of investing, such
portfolios are more preferable for those who are not
far from the retirement and do not like to take much
risk.
Results- the most risky portfolio
• The most risky is the second portfolio. For
investors it is not recommended to construct
such portfolios like the second portfolio,
because the investor`s risk tolerance level
should be very high there.
• The third portfolio may be suitable for the
young investors who are in the accumulation
stage and can afford to take large risks.
• Investors should remember: the higher the
return, the higher the risk.
• An investment may result in accumulation of
investor`s wealth or dissipation of his
resources.
Thank you for your attention!

Risk:return ratio of an investment portfolio

  • 1.
    Risk/return ratio of aninvestment portfolio Made by Maria Lavrova 13 June 2013
  • 2.
    The aim ofthe Thesis The aim of the Thesis is to consider the technique of the investment portfolio formation and the creation of optimal portfolios for the different kind of investors depending on their risk tolerance as well as their requirements to the received returns. The set goals are: •To investigate the process of portfolio creation by inquiring the basic theoretical background •To explore the techniques of portfolio crafting and choose methods for practical use •To define the investment policy and structure of the portfolio •To assess the risk and return of the created portfolios using different kind of techniques •To suggest which kind of investor the created portfolios are more suitable for.
  • 3.
    Methodology • Modern PortfolioTheory of Harry Markowitz • Capital Assets Pricing Model of William Sharpe • Value at Risk Theory of J.P. Morgan • Backtesting • Stresstesting • Wealth stages of Charles Jones • Royal Bank`s formula for investing
  • 4.
    Place for potentialinvestments- India • Over the longer-term India is likely to be one of the fastest growing large economies with at least 7% annual GDP growth • India’s working-age population will increase by 240 million over the next 20 years, which will significantly increase consumption and lead to India’s consumer markets boom. • Government investment in the country’s infrastructure is soaring. • India has heavy investments in education, health and agriculture to give a new deal to rural India. • Corporate earnings in India are growing at 35% annual rate, especially among the manufacturing biggies and telecommunication companies. • The Indian stock-market has generated investment returns of over 15% per annum for the last 10 years and experts predict this rate to increase in the next decade.
  • 5.
    Results- Expected returnsand risks of the stocks E(R) ExpReturn 𝜎 StandDev E(R)/𝜎 Return/Risk OIL 0,42% 15,51% 2,7% INDIAN EXT 2,87% 27,42% 10,4% G&C 3,01% 18,58% 16,2% CEMENTS 1,99% 28,91% 6,9% ABBOTT 2,17% 8,28% 26,2% BINANI 0,95% 22,36% 4,3% INFOSYS 0,78% 9,19% 8,5% SATYAM -1,41% 16,63% -8,5% MPHASIS 1,29% 13,66% 9,5% TATA 0,67% 11,10% 6,1% MEAN 1,27% 17,2%
  • 6.
    Optimal Portfolios Objective MaxE(R) Minσ MaxE(R) Min σ Constraining variable at σ≤ E(R)≥ at σ≤ E(R)≥ Value of constrain 8,28% 3,01% 17,16% 1,27% Weights OIL 0,00% 0,00% 0,00% 0,00% INDIAN EXT 12,88% 0,00% 11,01% 5,75% G&C 26,90% 100,00% 88,99% 4,67% CEMENTS 0,00% 0,00% 0,00% 2,67% ABBOTT 60,22% 0,00% 0,00% 50,07% BINANI 0,00% 0,00% 0,00% 0,00% INFOSYS 0,00% 0,00% 0,00% 28,70% SATYAM 0,00% 0,00% 0,00% 0,74% MPHASIS 0,00% 0,00% 0,00% 0,00% TATA 0,00% 0,00% 0,00% 7,39% ΣW= 100% 100% 100% 100% μ(p)= 2,49% 3,01% 2,99% 1,71% σ(p)= 8,28% 18,58% 17,16% 6,55% μ/σ(p)= 0,3 0,16 0,17 0,26 Donotputalleggsintoone basket
  • 7.
    Results of CAPM– return on equity Portfolio1 Portfolio2 Portfolio3 Portfolio4 r(equity) 0.15% 0.25% 0.18% 0.27%
  • 8.
    Risk assessment- VaRof the portfolios Portfolio VAR (95%) VAR (99%) 1 11,36% 17,31% 2 28,04% 41,40% 3 25,69% 38,03% 4 9,23% 13,94% Portfolio VAR (95%) VAR (99%) 1 8,39% 14,74% 2 23,81% 34,49% 3 21,18% 30,74% 4 8,87% 13,81% Variance-Covariance method Historical Simulation method
  • 9.
    Risk assessment- VaRof the portfolios Portfolio VAR(95%) VAR(99%) 1 1,61% 2,26% 2 4,01% 5,30% 3 3,68% 4,87% 4 1,34% 1,80% Monte-Carlo Simulation
  • 10.
    Risk assessment- VaR ofthe portfolios (Backtesting) VARCOV JAN 08 - DEC 12 DEC 04 - NOV 09 Portfolio VAR(95%) VAR(99%) VAR(95%) VAR(99%) 1 11,36% 17,31% 13,41% 19,79% 2 28,04% 41,40% 29,53% 43,44% 3 25,69% 38,03% 26,11% 38,53% 4 9,23% 13,94% 12,25% 17,90% Variance-covariance method
  • 11.
    Results- the leastrisky portfolio • Relying on the results, the best risk/return opportunities are presented by the first and the fourth portfolios. First portfolio offers higher standard deviation, at the same time it offers higher average return. Fourth portfolio is least risky with lower return. Markowitz risk/return tradeoff is confirmed there. • Those portfolios suit more to risk-averse investors or for those individuals who, according to Charles Jones (2010), view their wealth in spending phase. • According to Royal Bank`s formula of investing, such portfolios are more preferable for those who are not far from the retirement and do not like to take much risk.
  • 12.
    Results- the mostrisky portfolio • The most risky is the second portfolio. For investors it is not recommended to construct such portfolios like the second portfolio, because the investor`s risk tolerance level should be very high there. • The third portfolio may be suitable for the young investors who are in the accumulation stage and can afford to take large risks. • Investors should remember: the higher the return, the higher the risk. • An investment may result in accumulation of investor`s wealth or dissipation of his resources.
  • 13.
    Thank you foryour attention!