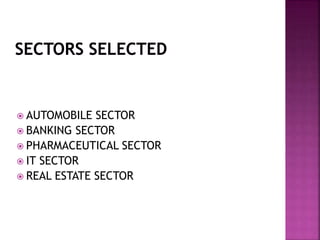
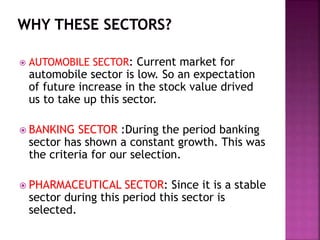
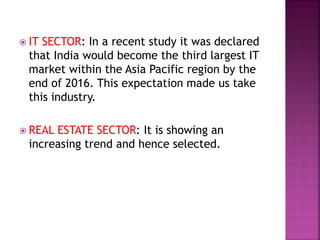
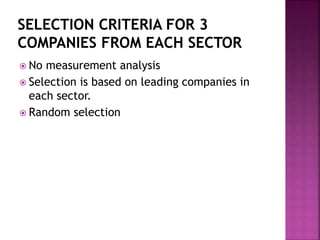
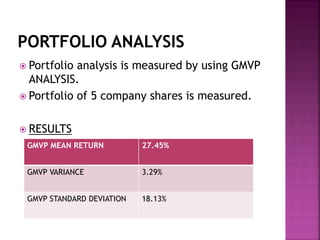
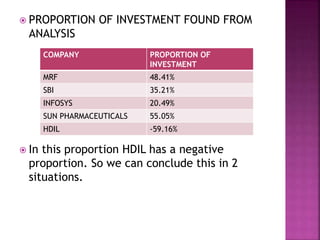
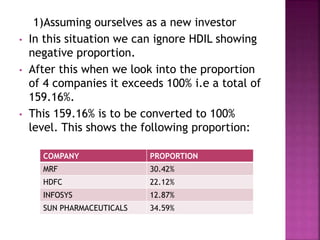
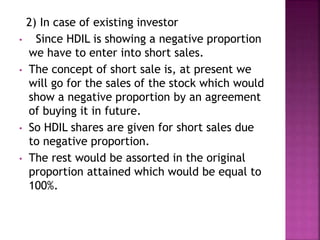
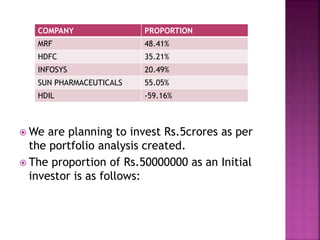
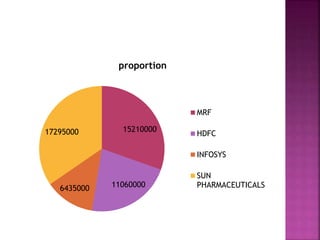
2. Initial step for our portfolio analysis is
selection of best companies from the
different sectors.
For this we selected 3 companies each from
5 sectors forming 15 companies
From these 15 companies 5 companies from
each sector were selected using CAPM with
ASWATH DAMODARAN TEMPLATE. This analysis
is undertaken for individual company
selection.
3. A portfolio of 5 company is created after
analysis of 15 companies from 5 sectors.
Portfolio analysis is measured by GLOBAL
MINIMUM VARIANCE PORTFOLIO (GMVP)
ANALYSIS found by Markowitz.
4. AUTOMOBILE SECTOR
BANKING SECTOR
PHARMACEUTICAL SECTOR
IT SECTOR
REAL ESTATE SECTOR
5. AUTOMOBILE SECTOR: Current market for
automobile sector is low. So an expectation
of future increase in the stock value drived
us to take up this sector.
BANKING SECTOR :During the period banking
sector has shown a constant growth. This was
the criteria for our selection.
PHARMACEUTICAL SECTOR: Since it is a stable
sector during this period this sector is
selected.
6. IT SECTOR: In a recent study it was declared
that India would become the third largest IT
market within the Asia Pacific region by the
end of 2016. This expectation made us take
this industry.
REAL ESTATE SECTOR: It is showing an
increasing trend and hence selected.
7. No measurement analysis
Selection is based on leading companies in
each sector.
Random selection
8. To create a profitable portfolio with
minimum risk.
To make a diversified portfolio.
To ascertain the proportion of investments
among different companies.
9. AUTOMOBILE SECTOR.
COMPANY ALPHA BETA R SQUARE EXPECTED
RETURN
MRF 1.54% 0.746 5.05% 14.5%
TATA
MOTORS
0.32% 0.997 7.16% 16.82%
BAJAJ AUTO
LTD
1.04% -0.2822 0.65% 4.99%
10. Interpretation
MRF shows the best performance.
a) Beta value of 0.746 % meaning 1% change in
market brings in 0.746% change in stock prices
which is better than other companies.
b) R square value Market condition explains 5.05%
change in stock price.
c) Expected return estimated from the analysis is
14.5% which is not the highest return earning
company but yet selected taking into
consideration the market risk
d) Alpha reveals the company risk of 1.54% which
is much greater than the other two.
11. Here though TATA MOTORS has better
expected return we have taken MRF since
the market risk is less compared to TATA
motors while on the other hand the
company risk is greater however it is
manageable.
Beta value of Bajaj auto ltd of -0.2882
indicates that it is highly risky. Hence not
taken into consideration.
13. Interpretation
HDFC reveals the best performance.
a) Beta value of meaning 0.43% change
in market brings in 0.43% change in stock
prices which is better than other
companies.
b) R square value Market conditions
explain 1.78% change in stock price.
c) Expected return estimated from the
analysis is 11.62% which is neither the
lowest nor the highest value.
d) Alpha reveals the company risk of
1.33% which is much lesser than the other
two.
14. Here we have taken HDFC instead of SBI
having a higher margin of expected return
since the market risk and company risk is
very low in case of HDFC compared to SBI.
Icici indicating a negative beta value
makes it highly risky hence rejected
15. PHARMACEUTICAL SECTOR
COMPANY ALPHA BETA R SQUARE EXPECTED
RETURN
CIPLA 1.20% 0.820 4.85% 15.19%
DR. REDDY’S
LABORATORIES
1.47% 0.692 4.32% 14%
SUN
PHARMACEUTICAL
S
1.23% 0.973 5.84% 16.61%
16. Interpretation
Sun pharmaceuticals reveals the best
performance.
a) Beta value of 0.973% meaning 1%
change in market brings in 0.973%
change in stock prices which is better
than other companies.
b) R square value Market conditions
explain 5.84% change in stock prices.
c) Expected return estimated from the
analysis is 16.61% which shows the best
return from among the 3 companies.
d) Alpha reveals the company risk of
1.23%.
17. Even though the analysis values of
three companies have a small
difference among each other, Sun
pharmaceuticals have a better
advantage of inclusion in Portfolio.
We concluded this as the stock after
analysing each company using GMVP
Analysis.
18. IT SECTOR
COMPANY ALPHA BETA R SQUARE EXPECTED
RETURN
INFOSYS 3.44% 1.79 2.75% 24.25%
TCS 1.01% 0.476 1.84% 12.01%
WIPRO 1.06% 0.57 2.10% 12.87%
19. Interpretation
Infosys reveals the best performance.
a) Beta value of 1.79% meaning 1%
change in market brings in 1.79%
change in stock prices which is better
than other companies.
b) R square value Market conditions
explain 2.75% change in stock prices.
c) Expected return estimated from the
analysis is 24.25% which shows the best
return from among the 3 companies.
d) Alpha reveals the company risk of
3.44% which is much greater than the
other two.
20. Here though the market risk and company
risk is high for Infosys compared to other
two we have chosen Infosys since it gives
double the rate of return compared to the
other companies.
Corresponding difference in market and
company risk is low compared to return
difference of Infosys in connection with
the other two.
21. REAL ESTATE SECTOR
COMPANY ALPHA BETA R SQUARE EXPECTED
RETURN
DLF 0.70% 0.9868 3.74% 16.73%
HDIL 0.60% 1.807 9.64% 24.32%
SOBHA 0.28% 1.175 7.37% 18.48%
22. Interpretation
HDIL reveals the best performance.
a) Beta value of 1.807% meaning 1%
change in market brings in 1.807%
change in stock prices which is better
than other companies.
b) R square value Market conditions
explain 9.64% change in stock price.
c) Expected return estimated from the
analysis is 24.32% which shows the best
return from among the 3 companies.
d) Alpha reveals the company risk of
0.60%.
23. Portfolio analysis is measured by using GMVP
ANALYSIS.
Portfolio of 5 company shares is measured.
RESULTS
GMVP MEAN RETURN 27.45%
GMVP VARIANCE 3.29%
GMVP STANDARD DEVIATION 18.13%
24. PROPORTION OF INVESTMENT FOUND FROM
ANALYSIS
In this proportion HDIL has a negative
proportion. So we can conclude this in 2
situations.
COMPANY PROPORTION OF
INVESTMENT
MRF 48.41%
SBI 35.21%
INFOSYS 20.49%
SUN PHARMACEUTICALS 55.05%
HDIL -59.16%
25. 1)Assuming ourselves as a new investor
• In this situation we can ignore HDIL showing
negative proportion.
• After this when we look into the proportion
of 4 companies it exceeds 100% i.e a total of
159.16%.
• This 159.16% is to be converted to 100%
level. This shows the following proportion:
COMPANY PROPORTION
MRF 30.42%
HDFC 22.12%
INFOSYS 12.87%
SUN PHARMACEUTICALS 34.59%
26. 2) In case of existing investor
• Since HDIL is showing a negative proportion
we have to enter into short sales.
• The concept of short sale is, at present we
will go for the sales of the stock which would
show a negative proportion by an agreement
of buying it in future.
• So HDIL shares are given for short sales due
to negative proportion.
• The rest would be assorted in the original
proportion attained which would be equal to
100%.
27. We are planning to invest Rs.5crores as per
the portfolio analysis created.
The proportion of Rs.50000000 as an Initial
investor is as follows:
COMPANY PROPORTION
MRF 48.41%
HDFC 35.21%
INFOSYS 20.49%
SUN PHARMACEUTICALS 55.05%
HDIL -59.16%
29. Our objective was to set a portfolio with
minimum risk and maximum return.
For this we considered 15 individual
companies from 5 sectors using CAPM MODEL
with Aswath Damodaran template.
Analysis helped in selecting 5 companies.
One from each sector.
Portfolio analysis was undertaken using GMVP
ANALYSIS.
This analysis helped in achieving our
objectives.