Download as PDF, PPTX


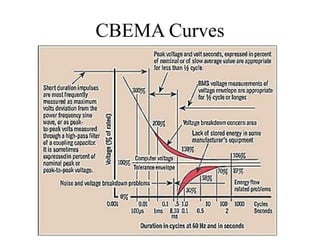


The document provides an in-depth overview of power quality, defining it as the quality of voltage and current in electrical systems, with emphasis on various power quality problems like transients, short and long duration variations, and waveform distortion. It details their causes, effects on equipment, and classifications, as well as guidelines from CBEMA and ITIC curves for acceptable power conditions. The information aims to educate on how to ensure reliable operation of sensitive electronic equipment in diverse environments.


