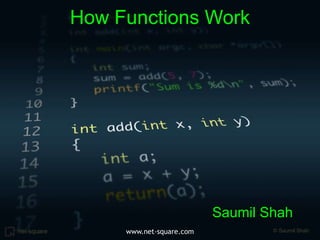
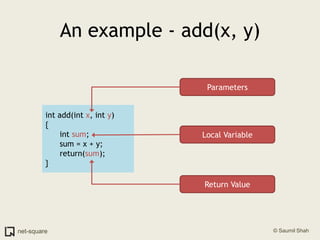
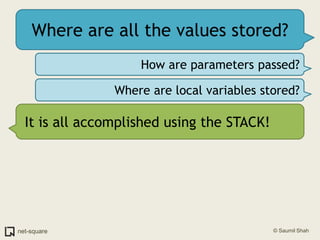
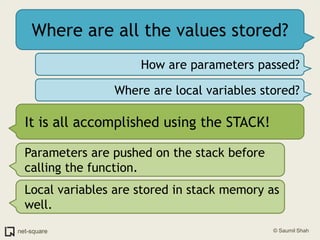
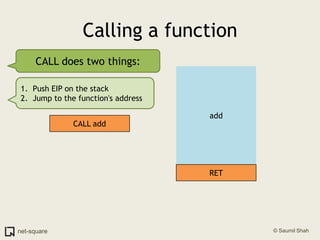
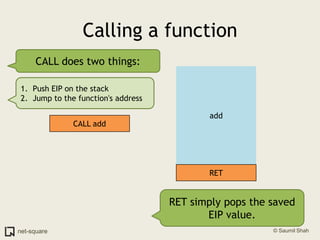
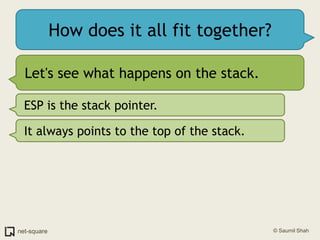
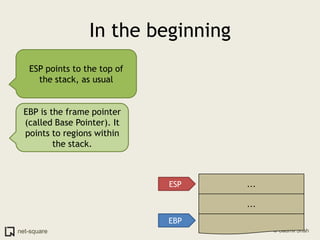
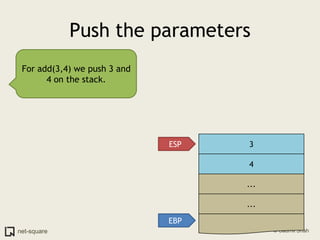
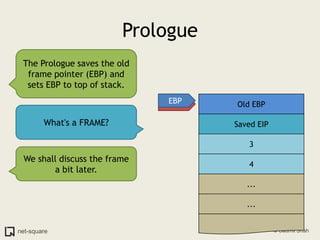
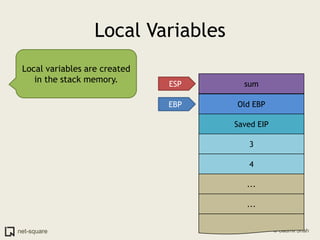
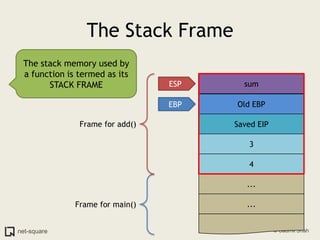
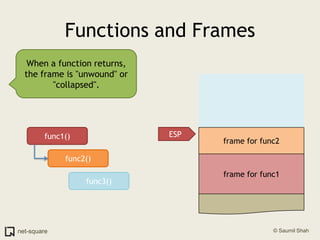
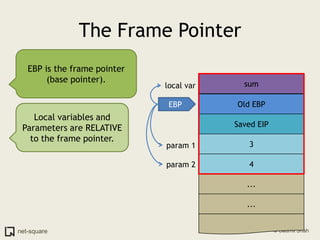
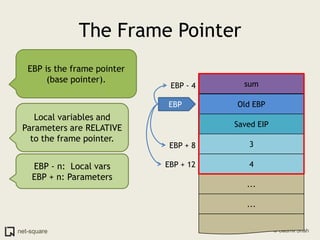
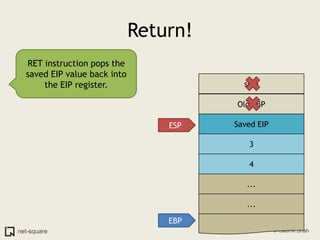
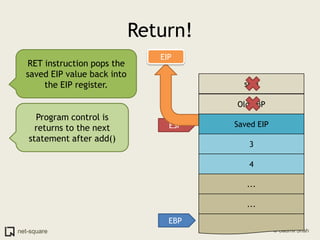
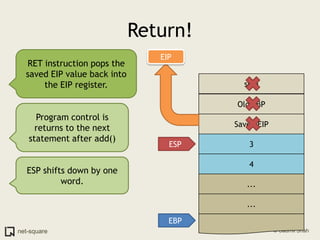
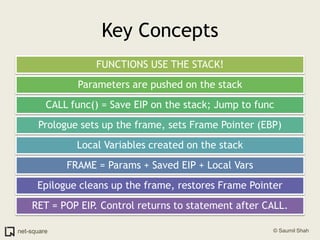
A function is a reusable block of code that can be called from different parts of a program. Functions accept parameters as input and may return a value. When a function is called, its parameters and local variables are stored on the stack. Each function call creates a stack frame that contains its parameters, local variables, and return address. This allows functions to maintain separate variable scopes while sharing the call stack.
A quick tutorial on what debuggers are and how to use them. We present a debugging example using GDB. At the end of this tutorial, you will be able to work your way through a crash and analyze the cause of the error responsible for the crash.
Dive into ROP - a quick introduction to Return Oriented ProgrammingSaumil Shah
A tutorial created to introduce you to the core concepts of Return Oriented Programming (ROP). ROP is an essential technique in defeating exploit mitigation protection such as DEP, found in modern operating systems.
Talk for SCaLE13x. Video: https://www.youtube.com/watch?v=_Ik8oiQvWgo . Profiling can show what your Linux kernel and appliacations are doing in detail, across all software stack layers. This talk shows how we are using Linux perf_events (aka "perf") and flame graphs at Netflix to understand CPU usage in detail, to optimize our cloud usage, solve performance issues, and identify regressions. This will be more than just an intro: profiling difficult targets, including Java and Node.js, will be covered, which includes ways to resolve JITed symbols and broken stacks. Included are the easy examples, the hard, and the cutting edge.
Delivered as plenary at USENIX LISA 2013. video here: https://www.youtube.com/watch?v=nZfNehCzGdw and https://www.usenix.org/conference/lisa13/technical-sessions/plenary/gregg . "How did we ever analyze performance before Flame Graphs?" This new visualization invented by Brendan can help you quickly understand application and kernel performance, especially CPU usage, where stacks (call graphs) can be sampled and then visualized as an interactive flame graph. Flame Graphs are now used for a growing variety of targets: for applications and kernels on Linux, SmartOS, Mac OS X, and Windows; for languages including C, C++, node.js, ruby, and Lua; and in WebKit Web Inspector. This talk will explain them and provide use cases and new visualizations for other event types, including I/O, memory usage, and latency.
Broken benchmarks, misleading metrics, and terrible tools. This talk will help you navigate the treacherous waters of Linux performance tools, touring common problems with system tools, metrics, statistics, visualizations, measurement overhead, and benchmarks. You might discover that tools you have been using for years, are in fact, misleading, dangerous, or broken.
The speaker, Brendan Gregg, has given many talks on tools that work, including giving the Linux PerformanceTools talk originally at SCALE. This is an anti-version of that talk, to focus on broken tools and metrics instead of the working ones. Metrics can be misleading, and counters can be counter-intuitive! This talk will include advice for verifying new performance tools, understanding how they work, and using them successfully.
Linux Performance Analysis: New Tools and Old SecretsBrendan Gregg
Talk for USENIX/LISA2014 by Brendan Gregg, Netflix. At Netflix performance is crucial, and we use many high to low level tools to analyze our stack in different ways. In this talk, I will introduce new system observability tools we are using at Netflix, which I've ported from my DTraceToolkit, and are intended for our Linux 3.2 cloud instances. These show that Linux can do more than you may think, by using creative hacks and workarounds with existing kernel features (ftrace, perf_events). While these are solving issues on current versions of Linux, I'll also briefly summarize the future in this space: eBPF, ktap, SystemTap, sysdig, etc.
Talk by Brendan Gregg for USENIX LISA 2019: Linux Systems Performance. Abstract: "
Systems performance is an effective discipline for performance analysis and tuning, and can help you find performance wins for your applications and the kernel. However, most of us are not performance or kernel engineers, and have limited time to study this topic. This talk summarizes the topic for everyone, touring six important areas of Linux systems performance: observability tools, methodologies, benchmarking, profiling, tracing, and tuning. Included are recipes for Linux performance analysis and tuning (using vmstat, mpstat, iostat, etc), overviews of complex areas including profiling (perf_events) and tracing (Ftrace, bcc/BPF, and bpftrace/BPF), and much advice about what is and isn't important to learn. This talk is aimed at everyone: developers, operations, sysadmins, etc, and in any environment running Linux, bare metal or the cloud."
Kernel Recipes 2017 - Understanding the Linux kernel via ftrace - Steven RostedtAnne Nicolas
Ftrace is the official tracer of the Linux kernel. It has been apart of Linux since 2.6.31, and has grown tremendously ever since. Ftrace’s name comes from its most powerful feature: function tracing. But the ftrace infrastructure is much more than that. It also encompasses the trace events that are used by perf, as well as kprobes that can dynamically add trace events that the user defines.
This talk will focus on learning how the kernel works by using the ftrace infrastructure. It will show how to see what happens within the kernel during a system call; learn how interrupts work; see how ones processes are being scheduled, and more. A quick introduction to some tools like trace-cmd and KernelShark will also be demonstrated.
Steven Rostedt, VMware
eBPF is an exciting new technology that is poised to transform Linux performance engineering. eBPF enables users to dynamically and programatically trace any kernel or user space code path, safely and efficiently. However, understanding eBPF is not so simple. The goal of this talk is to give audiences a fundamental understanding of eBPF, how it interconnects existing Linux tracing technologies, and provides a powerful aplatform to solve any Linux performance problem.
Dataplane programming with eBPF: architecture and toolsStefano Salsano
eBPF is definitely a complex technology. Developing complex systems based on eBPF is challenging due to the intrinsic limitations of the model and the known shortcomings of the tool chain.
The learning curve of this technology is very steep and needs continuous coaching from experts. This tutorial will investigate:
What is eBPF and why it has gained a prominent position among the solutions to improve the packet processing performance in Linux/x86 nodes. We will shortly present some important use case scenarios for eBPF, like Kubernetes’ Cilium
The architecture of eBPF and its programming toolchain (e.g. bcc
What are the frameworks for eBPF programming, such as Polycube and InKeV.
How to make eBPF programming easier, more flexible and modular with HIKe/eCLAT
How to implement a custom application logic in eBPF with eCLAT using a python-like script
How to extend the framework and develop new modules
Recently our team researched various ntos subsystem attack vectors, and one of the outputs we will present in our talk. DeathNote as our internal code name to this component, which resides in Microsoft Windows kernel, hiding behind different interfaces and exposed to user differently.
What can goes bad with it?
Basically two kinds of problems, one is syscall handling via direct user interaction. We will describe how to obtain basic understanding of what's going on, how it interacts with other components and what is its purpose. With those knowledge we will dig deeper how to make more complex fuzzing logic to cause enough chaos that will end up in unexpected behaviors in Windows kernel, and demonstrate some of them.
And as for second, as it hints from title, this module does bit of data parsing, so we will dive deep into internals, pointing out some available materials, and move on to reverse engineered structures and internal mechanism. We will show how some tricks can outcome with various results, and how structured approach can expose more problems than is expected.
Talk for Facebook Systems@Scale 2021 by Brendan Gregg: "BPF (eBPF) tracing is the superpower that can analyze everything, helping you find performance wins, troubleshoot software, and more. But with many different front-ends and languages, and years of evolution, finding the right starting point can be hard. This talk will make it easy, showing how to install and run selected BPF tools in the bcc and bpftrace open source projects for some quick wins. Think like a sysadmin, not like a programmer."
The Linux Block Layer - Built for Fast StorageKernel TLV
The arrival of flash storage introduced a radical change in performance profiles of direct attached devices. At the time, it was obvious that Linux I/O stack needed to be redesigned in order to support devices capable of millions of IOPs, and with extremely low latency.
In this talk we revisit the changes the Linux block layer in the
last decade or so, that made it what it is today - a performant, scalable, robust and NUMA-aware subsystem. In addition, we cover the new NVMe over Fabrics support in Linux.
Sagi Grimberg
Sagi is Principal Architect and co-founder at LightBits Labs.
This presentation goes over basic exploitation techniques. Topics include:
- Introduction to x86 paradigms used exploited by these techniques
- Stack overflows including the classic stack smashing attack
- Ret2libc
- Format string exploits
- Heap overflows and metadata corruption attacks
Slides for a college course at City College San Francisco. Based on "The Shellcoder's Handbook: Discovering and Exploiting Security Holes ", by Chris Anley, John Heasman, Felix Lindner, Gerardo Richarte; ASIN: B004P5O38Q.
Instructor: Sam Bowne
Class website: https://samsclass.info/127/127_F19.shtml
Intro to Programming with JavaScript Seminar, Fall 2017 semester
Week 2: Function
Led by Jeongbae Oh, in conjunction with YCC (Yonsei Computer Club) @ Yonsei University
This seminar intends to introduce newcomers to programming using JavaScript, one of the most versatile languages of the modern world.
A humble introduction to ROP chaining basics. The ppt deals with what is ROP. It builds the basics by introducing basics of buffer overflow and then talks about ROPs and why they are needed. It also has animated videos to help understand the layout of the stack clearly.
This presentation deals with different scenarios in attacking applications vulnerable to Buffer overflow by exploiting the default SEH chain, by the SEH overwrite
For over two decades, working as an cybersecurity entrepreneur, researcher and instructor, I have heard over and over again that attacks and defense are two sides of the same coin. But what does it really mean in application? What happens when sophisticated attacks collide with sophisticated defenses? Who wins?
This is talk is aimed at a wide audience in cybersecurity – from the strategists to the practitioners. We will discuss Evolution, Attacks, Defense and PEBKAC. What factors shall affect the posture of trustworthiness and safety in the digital world in the next two years to come depend largely on the road we have followed over the past two decades. This talk looks above and beyond, albeit optimistically, about realigning some of the conventional approaches, slowly but strategically shifting mindsets of stakeholders and consumers alike, to bring about a more proactive approach to security.
Debugging with EMUX - RIngzer0 BACK2WORKSHOPSSaumil Shah
The EMUX IoT Firmware Emulation Framework currently provides near native userland emulation for ARM and MIPS IoT devices. EMUX is actively used Saumil's popular ARM IoT Exploit Laboratory training for over 5 years.
The Debugging with EMUX workshop shall be in two parts:
Part 1 (30 minutes) - Setting up EMUX in 7 minutes - A tour of EMUX internals - EMUX utilities - Tracing userland processes within EMUX
Part 2 (90 minutes) - Debugging an ARM IoT target in EMUX - Debugging a MIPS IoT Target in EMUX - Crash dump analysis
Unveiling EMUX - ARM and MIPS IoT Emulation FrameworkSaumil Shah
After 4 years, ARMX is changing its call sign. EMUX now features both ARM and MIPS device emulation, in a unified framework! Join us as we unveil EMUX and take you into the inner workings of emulating both ARM and MIPS IoT devices. We will be releasing a new Docker image featuring a MIPS CTF challenge to test your MIPS exploit development skills.
Slides from my workshop at Ringzer0's December 2021 Workshop Advent Calendar.
Effective Webinars: Presentation Skills for a Virtual AudienceSaumil Shah
A webinar on what it takes to conduct an effective webinar! Understand how to prepare your story for an invisible audience, keep them engaged and anticipate "in-flight turbulence". Enjoy!
The closest you will get to a VM for testing IoT devices. The ARM-X IoT Firmware Emulation Framework is a tried-and-tested framework which has led to four 0-days discovered on SoHo routers, IP cameras and VoIP exchanges. In this talk, I shall cover the evolution of ARM-X, demonstrate a few use cases and discuss future directions of IoT firmware emulation.
The Road To Defendable Systems - Emirates NBDSaumil Shah
"Attack is a technical problem, defense is a political problem". For several years, cyber security has been misjudged as risk reduction. On one hand, business applications and architectures are growing rapidly. On the other hand, the cyber security organisation is struggling to be able to defend them in today's rapidly evolving threat landscape.
This talk explores the gap in thought between the owner and the defender of today's business applications and what needs to be done to bridge it. We shall present proactive steps and measures to overcome the last hurdle in building defendable systems.
Defending an enterprise is a balancing act. I have worked as an offensive testing vendor to several global organisations over 18 years. This talk explores the challenges that today’s CISOs face - the threat landscape, overall shortage of infosec expertise, the ever evaporating shelf life of infosec products and an increased burden of compliance requirements. I will share my experiences from working with highly effective CISOs and internal infosec teams and what it takes to function on the razor’s edge
My talk on creating ARM/Thumb Polyglot shellcode for obfuscation, signature evasion and downright novelty of approach! Presented at Hack in the Box Amsterdam 2019
Slides from my lectures on Photography As An Art Form. Follow me on facebook at https://www.facebook.com/my.spectral.lines and on Instagram at @therealsaumil.
Make ARM Shellcode Great Again - HITB2018PEKSaumil Shah
Compared to x86, ARM shellcode has made little progress. The x86 hardware is largely homogenous. ARM, however, has several versions and variants across devices today. There are several constraints and subtleties involved in writing production quality ARM shellcode which works on modern ARM hardware, not just on QEMU emulators.
In this talk, we shall explore issues such as overcoming cache coherency, reliable polymorphic shellcode, ARM egghunting and last but not the least, polyglot ARM shellcode. A bonus side effect of this talk will be creating headaches for those who like to defend agaisnt attacks using age old signature based techniques
PHP Frameworks: I want to break free (IPC Berlin 2024)Ralf Eggert
In this presentation, we examine the challenges and limitations of relying too heavily on PHP frameworks in web development. We discuss the history of PHP and its frameworks to understand how this dependence has evolved. The focus will be on providing concrete tips and strategies to reduce reliance on these frameworks, based on real-world examples and practical considerations. The goal is to equip developers with the skills and knowledge to create more flexible and future-proof web applications. We'll explore the importance of maintaining autonomy in a rapidly changing tech landscape and how to make informed decisions in PHP development.
This talk is aimed at encouraging a more independent approach to using PHP frameworks, moving towards a more flexible and future-proof approach to PHP development.
Dev Dives: Train smarter, not harder – active learning and UiPath LLMs for do...UiPathCommunity
💥 Speed, accuracy, and scaling – discover the superpowers of GenAI in action with UiPath Document Understanding and Communications Mining™:
See how to accelerate model training and optimize model performance with active learning
Learn about the latest enhancements to out-of-the-box document processing – with little to no training required
Get an exclusive demo of the new family of UiPath LLMs – GenAI models specialized for processing different types of documents and messages
This is a hands-on session specifically designed for automation developers and AI enthusiasts seeking to enhance their knowledge in leveraging the latest intelligent document processing capabilities offered by UiPath.
Speakers:
👨🏫 Andras Palfi, Senior Product Manager, UiPath
👩🏫 Lenka Dulovicova, Product Program Manager, UiPath
GDG Cloud Southlake #33: Boule & Rebala: Effective AppSec in SDLC using Deplo...James Anderson
Effective Application Security in Software Delivery lifecycle using Deployment Firewall and DBOM
The modern software delivery process (or the CI/CD process) includes many tools, distributed teams, open-source code, and cloud platforms. Constant focus on speed to release software to market, along with the traditional slow and manual security checks has caused gaps in continuous security as an important piece in the software supply chain. Today organizations feel more susceptible to external and internal cyber threats due to the vast attack surface in their applications supply chain and the lack of end-to-end governance and risk management.
The software team must secure its software delivery process to avoid vulnerability and security breaches. This needs to be achieved with existing tool chains and without extensive rework of the delivery processes. This talk will present strategies and techniques for providing visibility into the true risk of the existing vulnerabilities, preventing the introduction of security issues in the software, resolving vulnerabilities in production environments quickly, and capturing the deployment bill of materials (DBOM).
Speakers:
Bob Boule
Robert Boule is a technology enthusiast with PASSION for technology and making things work along with a knack for helping others understand how things work. He comes with around 20 years of solution engineering experience in application security, software continuous delivery, and SaaS platforms. He is known for his dynamic presentations in CI/CD and application security integrated in software delivery lifecycle.
Gopinath Rebala
Gopinath Rebala is the CTO of OpsMx, where he has overall responsibility for the machine learning and data processing architectures for Secure Software Delivery. Gopi also has a strong connection with our customers, leading design and architecture for strategic implementations. Gopi is a frequent speaker and well-known leader in continuous delivery and integrating security into software delivery.
UiPath Test Automation using UiPath Test Suite series, part 3DianaGray10
Welcome to UiPath Test Automation using UiPath Test Suite series part 3. In this session, we will cover desktop automation along with UI automation.
Topics covered:
UI automation Introduction,
UI automation Sample
Desktop automation flow
Pradeep Chinnala, Senior Consultant Automation Developer @WonderBotz and UiPath MVP
Deepak Rai, Automation Practice Lead, Boundaryless Group and UiPath MVP
Kubernetes & AI - Beauty and the Beast !?! @KCD Istanbul 2024Tobias Schneck
As AI technology is pushing into IT I was wondering myself, as an “infrastructure container kubernetes guy”, how get this fancy AI technology get managed from an infrastructure operational view? Is it possible to apply our lovely cloud native principals as well? What benefit’s both technologies could bring to each other?
Let me take this questions and provide you a short journey through existing deployment models and use cases for AI software. On practical examples, we discuss what cloud/on-premise strategy we may need for applying it to our own infrastructure to get it to work from an enterprise perspective. I want to give an overview about infrastructure requirements and technologies, what could be beneficial or limiting your AI use cases in an enterprise environment. An interactive Demo will give you some insides, what approaches I got already working for real.
Epistemic Interaction - tuning interfaces to provide information for AI supportAlan Dix
Paper presented at SYNERGY workshop at AVI 2024, Genoa, Italy. 3rd June 2024
https://alandix.com/academic/papers/synergy2024-epistemic/
As machine learning integrates deeper into human-computer interactions, the concept of epistemic interaction emerges, aiming to refine these interactions to enhance system adaptability. This approach encourages minor, intentional adjustments in user behaviour to enrich the data available for system learning. This paper introduces epistemic interaction within the context of human-system communication, illustrating how deliberate interaction design can improve system understanding and adaptation. Through concrete examples, we demonstrate the potential of epistemic interaction to significantly advance human-computer interaction by leveraging intuitive human communication strategies to inform system design and functionality, offering a novel pathway for enriching user-system engagements.
JMeter webinar - integration with InfluxDB and GrafanaRTTS
Watch this recorded webinar about real-time monitoring of application performance. See how to integrate Apache JMeter, the open-source leader in performance testing, with InfluxDB, the open-source time-series database, and Grafana, the open-source analytics and visualization application.
In this webinar, we will review the benefits of leveraging InfluxDB and Grafana when executing load tests and demonstrate how these tools are used to visualize performance metrics.
Length: 30 minutes
Session Overview
-------------------------------------------
During this webinar, we will cover the following topics while demonstrating the integrations of JMeter, InfluxDB and Grafana:
- What out-of-the-box solutions are available for real-time monitoring JMeter tests?
- What are the benefits of integrating InfluxDB and Grafana into the load testing stack?
- Which features are provided by Grafana?
- Demonstration of InfluxDB and Grafana using a practice web application
To view the webinar recording, go to:
https://www.rttsweb.com/jmeter-integration-webinar
Key Trends Shaping the Future of Infrastructure.pdfCheryl Hung
Keynote at DIGIT West Expo, Glasgow on 29 May 2024.
Cheryl Hung, ochery.com
Sr Director, Infrastructure Ecosystem, Arm.
The key trends across hardware, cloud and open-source; exploring how these areas are likely to mature and develop over the short and long-term, and then considering how organisations can position themselves to adapt and thrive.
Neuro-symbolic is not enough, we need neuro-*semantic*Frank van Harmelen
Neuro-symbolic (NeSy) AI is on the rise. However, simply machine learning on just any symbolic structure is not sufficient to really harvest the gains of NeSy. These will only be gained when the symbolic structures have an actual semantics. I give an operational definition of semantics as “predictable inference”.
All of this illustrated with link prediction over knowledge graphs, but the argument is general.
Smart TV Buyer Insights Survey 2024 by 91mobiles.pdf91mobiles
91mobiles recently conducted a Smart TV Buyer Insights Survey in which we asked over 3,000 respondents about the TV they own, aspects they look at on a new TV, and their TV buying preferences.
3. # who am i Saumil Shah CEO Net-square. Hacker, Speaker, Trainer, Author. M.S. Computer Science Purdue University. Google: "saumil" LinkedIn: saumilshah
6. What is a function? A function is a special SUBROUTINE
7. What is a function? A function is a special SUBROUTINE Re-usable block of code Can be called from anywhere in the program
8. What is a function? A function is a special SUBROUTINE Re-usable block of code Can be called from anywhere in the program Program control jumps to the subroutine... ...and returns to the next statement after completing the subroutine
10. Anything else? A function accepts parameters A function returns a value
11. Anything else? A function accepts parameters A function returns a value It may also have LOCAL variables...
12. Anything else? A function accepts parameters A function returns a value It may also have LOCAL variables... ...created when function is invoked, and destroyed when the function returns. Scope limited to that function only.
13. An example - add(x, y) int add(int x, int y) { int sum; sum = x + y; return(sum); }
14. An example - add(x, y) Parameters int add(int x, int y) { int sum; sum = x + y; return(sum); } Local Variable Return Value
15. Where are all the values stored? How are parameters passed? Where are local variables stored?
16. Where are all the values stored? How are parameters passed? Where are local variables stored? It is all accomplished using the STACK!
17. Where are all the values stored? How are parameters passed? Where are local variables stored? It is all accomplished using the STACK! Parameters are pushed on the stack before calling the function. Local variables are stored in stack memory as well.
19. add(x, y) 1 PROLOGUE 2 Local Variables BODY 3 s = add(3, 4) EPILOGUE Return Calling a function 4
20. add(x, y) PROLOGUE Push 4 Local Variables Push 3 BODY CALL add EPILOGUE RET Calling a function
21. CALL does two things: add CALL add RET Calling a function
22. CALL does two things: add Push EIP on the stack Jump to the function's address CALL add RET Calling a function
23. add CALL add RET Calling a function CALL does two things: Push EIP on the stack Jump to the function's address RET simply pops the saved EIP value.
25. How does it all fit together? Let's see what happens on the stack.
26. How does it all fit together? Let's see what happens on the stack. ESP is the stack pointer. It always points to the top of the stack.
27. In the beginning ESP points to the top of the stack, as usual ... ESP ... EBP
28. In the beginning ESP points to the top of the stack, as usual EBP is the frame pointer (called Base Pointer). It points to regions within the stack. ... ESP ... EBP
29. Push the parameters For add(3,4) we push 3 and 4 on the stack. 3 ESP 4 ... ... EBP
30. CALL add CALL pushes the current EIP on the stack... ...and jumps to add() Saved EIP ESP 3 4 ... ... EBP
31. Prologue The Prologue saves the old frame pointer (EBP) and sets EBP to top of stack. Old EBP EBP ESP Saved EIP 3 4 ... ...
32. Prologue The Prologue saves the old frame pointer (EBP) and sets EBP to top of stack. Old EBP EBP ESP What's a FRAME? Saved EIP 3 4 ... ...
33. Prologue The Prologue saves the old frame pointer (EBP) and sets EBP to top of stack. Old EBP EBP ESP What's a FRAME? Saved EIP 3 We shall discuss the frame a bit later. 4 ... ...
34. Local Variables Local variables are created in the stack memory. sum ESP Old EBP EBP Saved EIP 3 4 ... ...
35. Frame for add() The Stack Frame The stack memory used by a function is termed as its STACK FRAME sum ESP Old EBP EBP Saved EIP 3 4 ... ... Frame for main()
36. Functions and Frames Each function call results in a new frame being created on the stack. func1() frame for func1 ESP
37. Functions and Frames Each function call results in a new frame being created on the stack. func1() frame for func2 ESP func2() frame for func1
38. Functions and Frames Each function call results in a new frame being created on the stack. frame for func3 ESP func1() frame for func2 func2() frame for func1 func3()
39. frame for func2 frame for func1 Functions and Frames When a function returns, the frame is "unwound" or "collapsed". func1() ESP func2() func3()
40. Functions and Frames And as new functions get invoked, new frames get created. frame for func4 ESP func1() frame for func2 func2() frame for func1 func3() func4()
41. The Frame Pointer EBP is the frame pointer (base pointer). sum Old EBP EBP Saved EIP 3 4 ... ...
42. The Frame Pointer EBP is the frame pointer (base pointer). sum local var Old EBP EBP Local variables and Parameters are RELATIVE to the frame pointer. Saved EIP 3 param 1 4 param 2 ... ...
43. The Frame Pointer EBP is the frame pointer (base pointer). sum EBP - 4 Old EBP EBP Local variables and Parameters are RELATIVE to the frame pointer. Saved EIP 3 EBP + 8 4 EBP - n: Local vars EBP + n: Parameters EBP + 12 ... ...
44. Epilogue The Epilogue cleans up the stack frame. Local variables are effectively destroyed. sum Old EBP ESP EBP Saved EIP 3 4 ... ...
45. Epilogue The Epilogue cleans up the stack frame. Local variables are effectively destroyed. sum Old EBP POP EBP. Restores EBP back to the old frame. Saved EIP ESP 3 4 ... ... EBP
46. Epilogue The Epilogue cleans up the stack frame. Local variables are effectively destroyed. sum Old EBP POP EBP. Restores EBP back to the old frame. Saved EIP ESP 3 4 Stack pointer now points to where EIP was saved before CALL add(). ... ... EBP
47. Return! RET instruction pops the saved EIP value back into the EIP register. sum Old EBP Saved EIP ESP 3 4 ... ... EBP
48. Return! RET instruction pops the saved EIP value back into the EIP register. EIP sum Old EBP Program control is returns to the next statement after add() Saved EIP ESP 3 4 ... ... EBP
49. Return! RET instruction pops the saved EIP value back into the EIP register. EIP sum Old EBP Program control is returns to the next statement after add() Saved EIP 3 ESP 4 ESP shifts down by one word. ... ... EBP