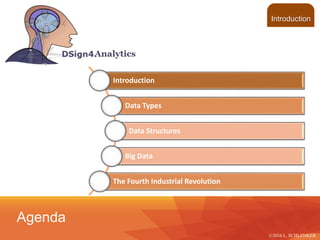
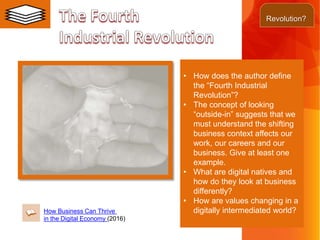
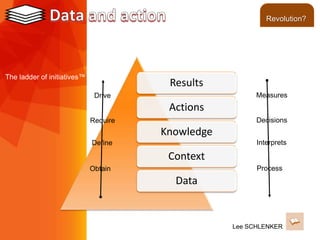
Introduction to Analytics
Data
October 2017
The Digital Photography School (2016)
©2016 L. SCHLENKER
• A picture is worth a thousand words
• Elucidate your customer’s challenge in six
pictures
• Take two pictures each of the context,
the challenge, and the “happy end”
• Tell your story in front of the class or
with tools like Replay or Stellar
Digital Photography School
Introduction
3
The objective of this course is to
introduce the students to Analytics
©2016 LHST sarl
• Analyze the context of each case to document the
key processes of the organization or the market
• Qualify the data at hand to understand the nature of
the business challenges
• Apply the appropriate methodologies in your
predictive and prescriptive analyses, and
• Integrate elements of visual communications in
transforming the data into a call for collective
action
In this module , you will
Introduction
www.dsign4change.com
This a place where managers and
students of management can discuss
and debate best practises in the digital
economy, new developments in data
science and decision making. Ask
questions and get practicable
answers, and learn how to use data in
decision making.
Analytics for Management
https://www.linkedin.com/
groups/13536539
Introduction
Introduction
©2016 L. SCHLENKER
Agenda
Introduction
Data Types
Data Structures
Big Data
The Fourth Industrial Revolution
• “The truth is, 9 out of 10
startups fail.”
• Behind every statistic is an
opinion:
• What to measure and
how to collect the data
• How to interpret,
visualize, and present the
results
• Where to distribute the
results and amplify the
reach
• How to finance the
analysis….
We are what we measure (2017)
Data Types
Carine Carmy
• More data has been created in the
past two years than in the previous
history of the human race
• « Strategists still confuse
technology with purpose … instead
of garnering context and empathy
to inform change…” - Brian Solis
What is data?
Data Types
Categorical (nominal) Data
Data placed in categories according to
a specified characteristic
Categories bear no quantitative
relationship to one another
Examples:
- customer’s location (America,
Europe, Asia)
- employee classification (manager,
supervisor,
associate)
Ordinal Data
Data that is ranked or ordered according to
some relationship with one another
No fixed units of measurement
Examples:
- football rankings
- survey responses
(poor, average, good, very good, excellent)
Ratio Data
Continuous values and have a natural
zero point
Ratios are meaningful
Examples:
- monthly sales
- delivery times
Interval Data
Ordinal data but with constant differences
between observations
No true zero point
Ratios are not meaningful
Examples:
- temperature readings
- SAT scores
Data Types
Machine
Learning
• From an objective point of view, information
refers to date in context that conveys
meaning to an individual.
• From a subjective point of view, we could
suggest that it’s the individual’s perspective of
the data that implies meaning.
• Given these definitions what meaning do
Wikileaks, Facebook or Whatapp have?
Assane, The Conversation
Structures
• Structured data refers to data that can be easily represented in
textual/numeric form and stored in a database.
• Structured data is often logically organized around a data model or
data object.
• Such models permit companies to compare and aggregate data in
databases, datamarts and data warehouses.
Structures
• Data is considered « non-structured » if we
can’t predefine its attributes and store it in
a table or data base
• Examples of this kind of data include press
clippings, videoclips, and songs
• In reality, this data isn’t « non-structured » -
its just that its attributes involve
« complex » relationships
http://jean.marie.gouarne.online.fr/bi.html
Structures
Big Data
Big Data
• How does the author define
the “Fourth Industrial
Revolution”?
• The concept of looking
“outside-in” suggests that we
must understand the shifting
business context affects our
work, our careers and our
business. Give at least one
example.
• What are digital natives and
how do they look at business
differently?
• How are values changing in a
digitally intermediated world?How Business Can Thrive
in the Digital Economy (2016)
Revolution?
Lee SCHLENKER
Results
Actions
Knowledge
Context
Data
Process
Interprets
Decisions
Measures
Obtain
Define
Require
Drive
The ladder of initiatives™
Revolution?

Introduction to Analytics - Data

  • 1.
  • 2.
    The Digital PhotographySchool (2016) ©2016 L. SCHLENKER • A picture is worth a thousand words • Elucidate your customer’s challenge in six pictures • Take two pictures each of the context, the challenge, and the “happy end” • Tell your story in front of the class or with tools like Replay or Stellar Digital Photography School Introduction
  • 3.
    3 The objective ofthis course is to introduce the students to Analytics ©2016 LHST sarl • Analyze the context of each case to document the key processes of the organization or the market • Qualify the data at hand to understand the nature of the business challenges • Apply the appropriate methodologies in your predictive and prescriptive analyses, and • Integrate elements of visual communications in transforming the data into a call for collective action In this module , you will Introduction www.dsign4change.com
  • 4.
    This a placewhere managers and students of management can discuss and debate best practises in the digital economy, new developments in data science and decision making. Ask questions and get practicable answers, and learn how to use data in decision making. Analytics for Management https://www.linkedin.com/ groups/13536539 Introduction
  • 5.
    Introduction ©2016 L. SCHLENKER Agenda Introduction DataTypes Data Structures Big Data The Fourth Industrial Revolution
  • 6.
    • “The truthis, 9 out of 10 startups fail.” • Behind every statistic is an opinion: • What to measure and how to collect the data • How to interpret, visualize, and present the results • Where to distribute the results and amplify the reach • How to finance the analysis…. We are what we measure (2017) Data Types Carine Carmy
  • 7.
    • More datahas been created in the past two years than in the previous history of the human race • « Strategists still confuse technology with purpose … instead of garnering context and empathy to inform change…” - Brian Solis What is data? Data Types
  • 8.
    Categorical (nominal) Data Dataplaced in categories according to a specified characteristic Categories bear no quantitative relationship to one another Examples: - customer’s location (America, Europe, Asia) - employee classification (manager, supervisor, associate) Ordinal Data Data that is ranked or ordered according to some relationship with one another No fixed units of measurement Examples: - football rankings - survey responses (poor, average, good, very good, excellent) Ratio Data Continuous values and have a natural zero point Ratios are meaningful Examples: - monthly sales - delivery times Interval Data Ordinal data but with constant differences between observations No true zero point Ratios are not meaningful Examples: - temperature readings - SAT scores Data Types
  • 9.
  • 10.
    • From anobjective point of view, information refers to date in context that conveys meaning to an individual. • From a subjective point of view, we could suggest that it’s the individual’s perspective of the data that implies meaning. • Given these definitions what meaning do Wikileaks, Facebook or Whatapp have? Assane, The Conversation Structures
  • 11.
    • Structured datarefers to data that can be easily represented in textual/numeric form and stored in a database. • Structured data is often logically organized around a data model or data object. • Such models permit companies to compare and aggregate data in databases, datamarts and data warehouses. Structures
  • 12.
    • Data isconsidered « non-structured » if we can’t predefine its attributes and store it in a table or data base • Examples of this kind of data include press clippings, videoclips, and songs • In reality, this data isn’t « non-structured » - its just that its attributes involve « complex » relationships http://jean.marie.gouarne.online.fr/bi.html Structures
  • 13.
  • 14.
  • 15.
    • How doesthe author define the “Fourth Industrial Revolution”? • The concept of looking “outside-in” suggests that we must understand the shifting business context affects our work, our careers and our business. Give at least one example. • What are digital natives and how do they look at business differently? • How are values changing in a digitally intermediated world?How Business Can Thrive in the Digital Economy (2016) Revolution?
  • 16.

Editor's Notes

  • #10 Data Files Delimited Text Files XML Files Log Files Application-specific Files Databases Relational Databases Graph Databases Document Stores Columnar Databases Key-Value Stores