Download to read offline

![12 book has 70 petabytes and 2700 multiprocessor nodes. The Bing search engine has
150 petabytes and 40,000 nodes. But what does Big Data exactly signify for organiza-tions?
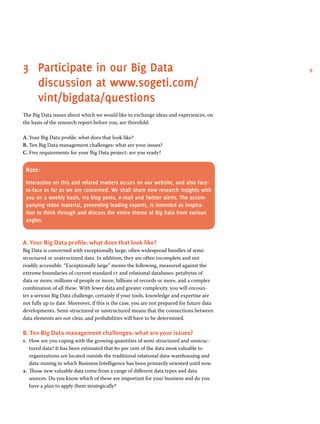
We can approach Big Data from the standpoint of the issues, but also from the
standpoint of the solutions. The simplest response comes from Forrester Research
and is as follows:
Big Data: Techniques and Technologies that Make Handling Data at Extreme Scale
Economical.
Just like The 451 Group and Gartner, Forrester also makes no distinction between Big
and Little Data. Compared to bygone times, many new and different data have arrived
on the scene, and this is an ongoing process; but data remain data. They go hand in
hand, and we can only truly advance further if there is well-thought-out integration of
the whole spectrum of various orders of magnitude. We are dealing with a single data
spectrum, a single continuum, and that is what organizations ought to be strategically
exploring step by step.
One large data continuum
Around thirty years ago, this also applied to the growth of scientific activity: large and
small. In his book entitled Reflections on Big Science (1967), the atomic scientist Alvin
Weinberg wrote:
The scientific enterprise, both Little Science and Big Science, has grown explosively
and has become very much more complicated.
This observation referred to science at that time, and it now refers precisely to what
is happening in the realm of data. Check what Chirag Metha has to say. As a Technol-ogy,
Design & Innovation Strategist, Metha was associated with the Office of the ceo
at sap:
Today, technology — commodity hardware and sophisticated software to leverage
this hardware — changes the way people think about small and large data. It’s a
data continuum. [...] Big Data is an amalgamation of a few trends – data growth
of a magnitude or two, external data more valuable than internal data, and shift in
computing business models. [...] Big Data is about redefining what data actually
means to you. [... ] This is not about technology. This is about a completely new way
of doing business where data finally gets the driver’s seat.
Big Data does not at all mean to say that we ought to forget Little or Small Data,
or Medium, Large et cetera. On the contrary, it is important that we can and must
review all the data in all their forms. It is possible technologically, and desirable, if not
essential, businesswise.](https://image.slidesharecdn.com/1-of-4-vint-sogeti-on-big-data-creating-clarity-140612014110-phpapp02-141127081621-conversion-gate02/85/Sogeti-on-big-data-creating-clarity-Report-1-4-on-Big-Data-Sogeti-ViNT-12-320.jpg)
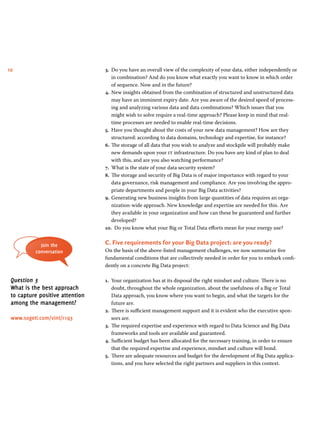
![14 Within organizations, the share of unstructured data, such as documents, e-mail and
images, is around 60 to 80 per cent. Of all data analyses that currently take place in
organizations, 5 to 15 per cent contain a social component that enriches the struc-tured
data. This number must increase, not least because of all the external data that
can be included in the analyses.
The Internet of Things is also becoming an increasingly rich source of data. At this
moment, says Cisco cto Padmasree Warrior, there are 13 billion devices connected
to the Internet and that will be 50 billion in 2020. idc expects more than 1 billion
sensors to be connected to the Internet by that time. All the accompanying data flows
can supply interesting insights that can aid better business decisions.
We are at Big Data’s point of departure
Banks belong to the top of the organizations that are engaged with Big Data but, in
the report with the eloquent title Big Data: Harnessing a Game-changing Asset by
the Economist Intelligence Unit, Paul Scholten, coo Retail & Private Banking at abn
amro, candidly admits that the bank is in an exploratory phase when it comes to
making good use of unstructured social data in particular:
We are used to structured, financial data. [...] We are not so good at the unstruc-tured
stuff. [...] The company is just beginning to understand the uses of social
media, and what might be possible in terms of improving customer service.
Mark Thiele states that it is interesting to compare Big Data in the year 2012 with the
start of the World Wide Web. Thiele is the Executive vp Data Center Technology at
Switch, the operator of the Supernap data center in Las Vegas, the largest and most
powerful of its type in the world:
Big Data today is what the web was in 1993. We knew the web was something and
that it might get Big, but few of us really understood what “Big” meant. Today, we
aren’t even scratching the surface of the Big Bata opportunity.
No isolated phenomenon
If there is one thing that has become clear, that is the fact that Big Data is not an iso-lated
phenomenon. The word “big” emphasizes the quantitative aspect which fortu-nately
immediately raises the necessary questions, so that we are compelled to think
more profoundly about Big Data.
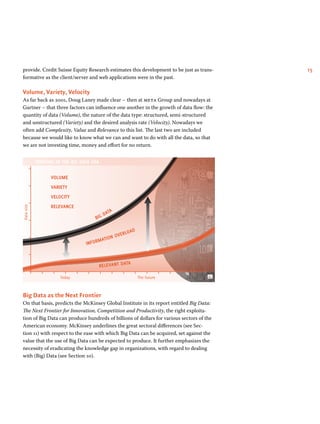
In March 2012, Credit Suisse Equity Research published the report entitled The Apps
Revolution Manifesto, Volume 1: The Technologies. The authors regard, in particular,
the convergence of Service-Oriented Architecture, Cloud, Fast Data, Big Data, Social
and Mobile as being determinative of the value that new enterprise applications can
Join the
conversation
Question 4
For organizations, what is
the most important new
rule of play with regard
to Big Data?
www.sogeti.com/vint/r1q4](https://image.slidesharecdn.com/1-of-4-vint-sogeti-on-big-data-creating-clarity-140612014110-phpapp02-141127081621-conversion-gate02/85/Sogeti-on-big-data-creating-clarity-Report-1-4-on-Big-Data-Sogeti-ViNT-14-320.jpg)


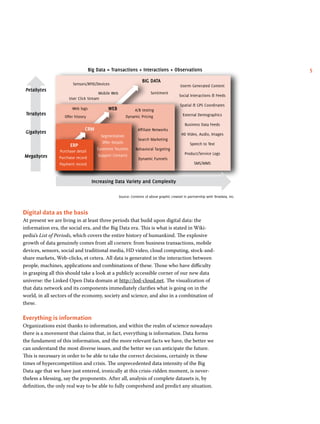
The Vint Research Report discusses the evolving landscape of big data and its implications for organizations, emphasizing the necessity for total data management amidst the rapid growth of digital data. It highlights the transformative potential of big data, presenting it as a new industrial revolution that provides competitive advantages through innovative business models and insights. The document serves as an introductory research piece that encourages organizations to engage in discussions about big data and address the challenges it presents.


