K.sabitha NM.pptx advance data science with python
1.
ARCOT SRI MAHALAKSHMIWOMEN’S COLLEGE
ADVANCE DATA SCIENCE WITH PYTHON
NAAN MUDHALVAN
SUBJECT CODE:23UNM40A
PRESENTED BY,
NAME:K.SABITHA
REG.NO:30323U09073
BACHELOR OF COMPUTER
APPLICATION
2.
Introduction to DataScience
What is Data Science?
Data Science is the study of data to extract meaningful
insights.
It combines statistics for analysis.
Computer Science: For programming and automation
Domain Knowledge: For real-world understanding
Goal: Turn raw data into useful information for decision-making
3.
Why is DataScience Important?
Helps businesses make informed decisions.
Enables predictive analytics and automation.
Used in:
1.Healthcare (disease prediction)
2.E-commerce (recommendation engines)
3.Finance (fraud detection)
4.Social media (sentiment analysis)
4.
Data Science Process
1.Data Collection – Gathering raw data from various sources
2. Data Cleaning – Removing errors and formatting data
3. Exploratory Data Analysis (EDA) – Understanding data patterns
4. Modeling – Applying algorithms to make predictions
5. Evaluation – Checking model performance
6. Deployment – Implementing the model in real-world systems
5.
Python for DataScience
Why Python for Data Science?
Easy to learn and useLarge community and open-
source librariesGreat for data manipulation, analysis, and
visualizationWidely used in industry and academia
6.
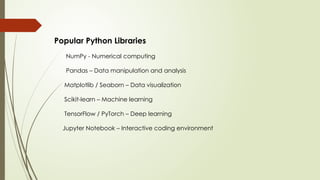
Popular Python Libraries
NumPy- Numerical computing
Pandas – Data manipulation and analysis
Matplotlib / Seaborn – Data visualization
Scikit-learn – Machine learning
TensorFlow / PyTorch – Deep learning
Jupyter Notebook – Interactive coding environment
7.
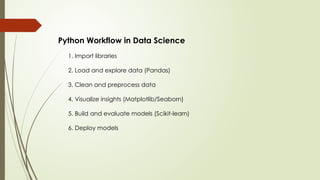
Python Workflow inData Science
1. Import libraries
2. Load and explore data (Pandas)
3. Clean and preprocess data
4. Visualize insights (Matplotlib/Seaborn)
5. Build and evaluate models (Scikit-learn)
6. Deploy models
8.
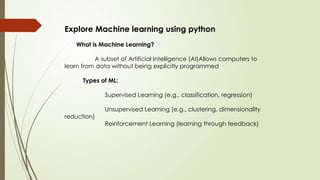
Explore Machine learningusing python
What is Machine Learning?
A subset of Artificial Intelligence (AI)Allows computers to
learn from data without being explicitly programmed
Types of ML:
Supervised Learning (e.g., classification, regression)
Unsupervised Learning (e.g., clustering, dimensionality
reduction)
Reinforcement Learning (learning through feedback)
9.
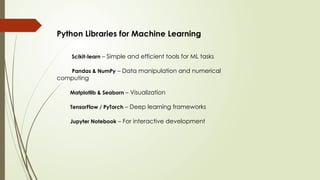
Python Libraries forMachine Learning
Scikit-learn – Simple and efficient tools for ML tasks
Pandas & NumPy – Data manipulation and numerical
computing
Matplotlib & Seaborn – Visualization
TensorFlow / PyTorch – Deep learning frameworks
Jupyter Notebook – For interactive development
10.
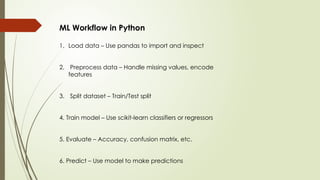
ML Workflow inPython
1. Load data – Use pandas to import and inspect
2. Preprocess data – Handle missing values, encode
features
3. Split dataset – Train/Test split
4. Train model – Use scikit-learn classifiers or regressors
5. Evaluate – Accuracy, confusion matrix, etc.
6. Predict – Use model to make predictions
11.
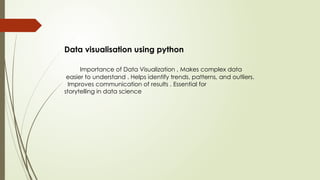
Data visualisation usingpython
Importance of Data Visualization , Makes complex data
easier to understand . Helps identify trends, patterns, and outliers.
Improves communication of results . Essential for
storytelling in data science
12.
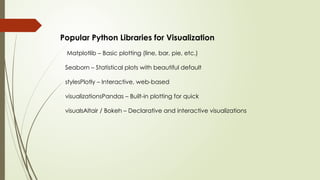
Popular Python Librariesfor Visualization
Matplotlib – Basic plotting (line, bar, pie, etc.)
Seaborn – Statistical plots with beautiful default
stylesPlotly – Interactive, web-based
visualizationsPandas – Built-in plotting for quick
visualsAltair / Bokeh – Declarative and interactive visualizations
13.
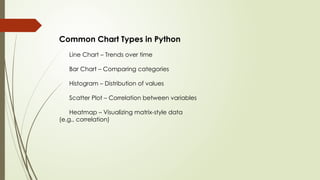
Common Chart Typesin Python
Line Chart – Trends over time
Bar Chart – Comparing categories
Histogram – Distribution of values
Scatter Plot – Correlation between variables
Heatmap – Visualizing matrix-style data
(e.g., correlation)
14.
Exploratory Data Analysis
Whatis EDA?
EDA is the process of analyzing datasets to summarize
their main characteristics.
Goals of EDA:
Discover patterns,Spot anomalies,Test
hypotheses,Check assumptions
15.
Key EDA Techniques
DescriptiveStatistics:
Mean, Median, Mode, Std Dev
Data Visualization:
Histograms (distribution)
Box plots (outliers)
Scatter plots (relationships)
Heatmaps (correlation)
Missing Value Analysis
Outlier Detection
16.
EDA Using Python
PopularLibraries:
Pandas – Data manipulation
Matplotlib & Seaborn – Visualizations
Missingno – Missing value analysis