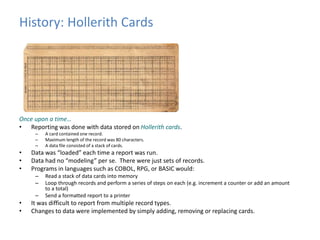
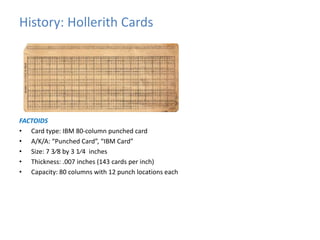
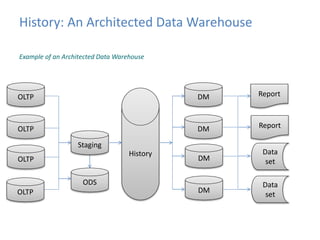
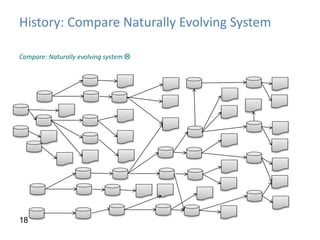
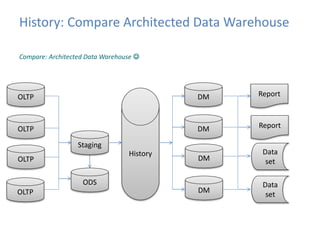
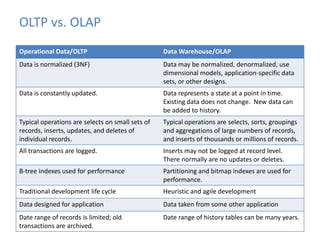
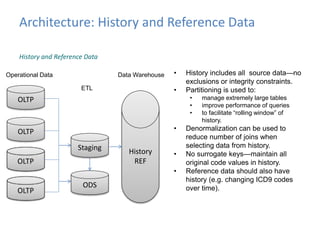
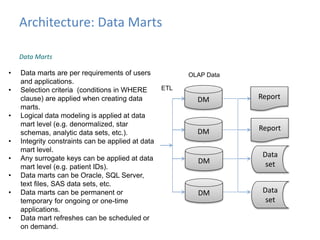
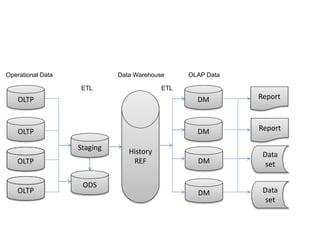
This document provides an introduction to data warehousing, covering its history from early use of punched cards and magnetic tape to modern architectures. It describes how data warehousing has evolved from simple extracts of operational data stored on disks to fully architected systems using techniques like extract-transform-load (ETL) to integrate data from multiple sources into a centralized data warehouse for analysis and reporting. It also compares the different paradigms of online transaction processing (OLTP) versus online analytical processing (OLAP) and discusses emerging technologies impacting data warehousing like massively parallel processing and in-memory databases.
OLTPBenchmark is a multi-threaded load generator. The framework is designed to be able to produce variable rate, variable mixture load against any JDBC-enabled relational database. The framework also provides data collection features, e.g., per-transaction-type latency and throughput logs.
Together with the framework we provide the following OLTP/Web benchmarks:
TPC-C
Wikipedia
Synthetic Resource Stresser
Twitter
Epinions.com
TATP
AuctionMark
SEATS
YCSB
JPAB (Hibernate)
CH-benCHmark
Voter (Japanese "American Idol")
SIBench (Snapshot Isolation)
SmallBank
LinkBench
CH-benCHmark
OLTP systems emphasize short, frequent transactions with a focus on data integrity and query speed. OLAP systems handle fewer but more complex queries involving data aggregation. OLTP uses a normalized schema for transactional data while OLAP uses a multidimensional schema for aggregated historical data. A data warehouse stores a copy of transaction data from operational systems structured for querying and reporting, and is used for knowledge discovery, consolidated reporting, and data mining. It differs from operational systems in being subject-oriented, larger in size, containing historical rather than current data, and optimized for complex queries rather than transactions.
A Common Database Approach for OLTP and OLAP Using an In-Memory Column DatabaseIshara Amarasekera
This presentation was prepared by Ishara Amarasekera based on the paper, A Common Database Approach for OLTP and OLAP Using an In-Memory Column Database by Hasso Plattner.
This presentation contains a summary of the content provided in this research paper and was presented as a paper discussion for the course, Advanced Database Systems in Computer Science.
Difference between molap, rolap and holap in ssasUmar Ali
MOLAP, ROLAP, and HOLAP are different storage modes in SQL Server Analysis Services (SSAS). MOLAP stores aggregated data and source data in a multidimensional structure for fast queries. ROLAP stores aggregations in indexed views in the relational database, while HOLAP combines MOLAP and ROLAP by storing aggregations in a multidimensional structure but not source data. Queries against aggregated data are faster with MOLAP and HOLAP, while ROLAP is slower but uses less storage.
What is OLAP -Data Warehouse Concepts - IT Online Training @ NewyorksysNEWYORKSYS-IT SOLUTIONS
NEWYORKSYSTRAINING are destined to offer quality IT online training and comprehensive IT consulting services with complete business service delivery orientation.
OLAP (Online Analytical Processing) is a technology that uses a multidimensional view of aggregated data to provide quicker access to strategic information and help with decision making. It has four main characteristics: using multidimensional data analysis techniques, providing advanced database support, offering easy-to-use end user interfaces, and supporting client/server architecture. A key aspect is representing data in a multidimensional structure that allows for consolidation and aggregation of data at different levels.
OLAP tools enable interactive analysis of multidimensional data from multiple perspectives. There are three main types of OLAP tools: ROLAP, MOLAP, and HOLAP. ROLAP uses relational databases and SQL queries, while MOLAP pre-computes and stores aggregated data in multidimensional arrays for fast querying. HOLAP is a hybrid that stores some data in ROLAP and some in MOLAP to optimize both query performance and cube processing time.
This document discusses online analytical processing (OLAP) and related concepts. It defines data mining, data warehousing, OLTP, and OLAP. It explains that a data warehouse integrates data from multiple sources and stores historical data for analysis. OLAP allows users to easily extract and view data from different perspectives. The document also discusses OLAP cube operations like slicing, dicing, drilling, and pivoting. It describes different OLAP architectures like MOLAP, ROLAP, and HOLAP and data warehouse schemas and architecture.
Data Science Training in Chennai at Credo Systemz provided by experienced Data Scientists. Our Data Science Course module is completely designed about how to analyze Big Data using R programming and Hadoop. Credo Systemz is the Best place to learn Data Science with Python Training in Chennai. Data Science course certification will help you be a professional Data Scientist. If you really Interested to Learn Best Data Science course in Chennai, then Credo Systemz is the Right place.
Our Best Data Science Training kick starts from statistics and insights of the large volume of data. So that we ranked as Best Data Science Training Institute in Chennai, Velachery. At the end of the course, you become a Data Scientist.
Checkout: http://bit.ly/2Mub6xP
OLAP (online analytical processing) allows users to easily extract and view data from different perspectives. It was invented by Edgar Codd in the 1980s and uses multidimensional data structures called cubes to store and analyze data. OLAP utilizes either a multidimensional (MOLAP), relational (ROLAP), or hybrid (HOLAP) approach to store cube data in databases and provide interactive analysis of data.
A data warehouse uses a repository to store aggregated, historical data from multiple OLTP databases in a multidimensional schema for online analytical processing (OLAP) through complex queries. In contrast, OLTP systems have detailed, current transactional data stored in a normalized schema to support a large volume of simple queries and updates for daily business tasks. While both involve databases, OLTP focuses on real-time transactions while OLAP supports analysis, planning and decision making through consolidated data from OLTP systems.
Subset of presentation given at the International Informix User Group conference in Miami FL in April 2014. Summarises some test results and provides context as to how Pronto Software (Australia's leading mid market ERP vendor) utilises IBM Informix to do both transactional processing and reporting successfully within a single Informix database.
Data warehouses are repositories that provide access to data for complex analysis and knowledge discovery. They involve extracting, transforming, and loading data from source systems and storing it in a multidimensional database. Online transaction processing (OLTP) is used for traditional database operations like inserts and updates, while online analytical processing (OLAP) enables analysis of complex warehouse data. The goal of data mining is knowledge discovery through predicting, classifying, identifying patterns, or optimizing from stored warehouse data using techniques like classification, clustering, and regression.
OLAP provides multidimensional analysis of large datasets to help solve business problems. It uses a multidimensional data model to allow for drilling down and across different dimensions like students, exams, departments, and colleges. OLAP tools are classified as MOLAP, ROLAP, or HOLAP based on how they store and access multidimensional data. MOLAP uses a multidimensional database for fast performance while ROLAP accesses relational databases through metadata. HOLAP provides some analysis directly on relational data or through intermediate MOLAP storage. Web-enabled OLAP allows interactive querying over the internet.
A data warehouse uses a multi-dimensional data model to consolidate data from multiple sources and support analysis. It uses a star schema with fact and dimension tables or a snowflake schema that normalizes dimensions. This allows for interactive exploration of data through OLAP operations like roll-up, drill-down, slice and dice to gain business insights. The document provides an overview of data warehousing concepts like schemas, cubes, measures and hierarchies to model and analyze historical data for decision making.
OLAP performs multidimensional analysis of business data and provides the capability for complex calculations, trend analysis, and sophisticated data modeling.
A data warehouse is a subject-oriented, integrated, time-variant collection of data that supports management's decision-making processes. It contains data extracted from various operational databases and data sources. The data is cleaned, transformed, integrated and loaded into the data warehouse for analysis. A data warehouse uses a multidimensional model with facts and dimensions to allow for complex analytical and ad-hoc queries from multiple perspectives. It is separately administered from operational databases to avoid impacting transaction processing systems and allow optimized access for decision support.
An overview of data warehousing and OLAP technology Nikhatfatima16
This document provides an overview of data warehousing and OLAP (online analytical processing) technology. It defines data warehousing as integrating data from multiple sources to support analysis and decision making. OLAP allows insights through fast, consistent access to multidimensional data models. It describes the three tiers of a data warehouse architecture including front-end tools, a middle OLAP server tier using ROLAP or MOLAP, and a bottom data warehouse database tier. Multidimensional databases are optimized for data warehouses and OLAP, representing data through cubes, stars, and snowflakes.
Case study: Implementation of OLAP operationschirag patil
The document discusses different types of online analytical processing (OLAP) servers including relational OLAP (ROLAP), multidimensional OLAP (MOLAP), and hybrid OLAP (HOLAP). It also describes common OLAP operations like roll-up, drill-down, slice, dice, and pivot that allow interactive analysis of multidimensional data by aggregation, navigation, and reorganization.
This document discusses the benefits and constraints of traditional enterprise data warehouses (EDW) and Hadoop frameworks. It notes that EDWs are used for reporting and analysis but require expensive ETL processes to load structured data into tables. Hadoop provides linear scalability, lower costs, and supports both SQL and non-SQL queries by keeping metadata and storage separate. The document argues that EDWs and Hadoop can coexist, with Hadoop handling ETL workloads and acting as low-cost storage, while EDWs focus on reporting and analytics using existing BI tools connected to Hadoop.
BDM8 - Near-realtime Big Data Analytics using ImpalaDavid Lauzon
Quick overview of all informations I've gathered on Cloudera Impala. It describes use cases for Impala and what not to use Impala for. Presented at Big Data Montreal #8 at RPM Startup Center.
BDM9 - Comparison of Oracle RDBMS and Cloudera Impala for a hospital use caseDavid Lauzon
High-level use case description of one department of a hospital, and comparisons of two solutions : 1) Big data solution using Cloudera Impala; and 2) Traditional RDBMS solution using Oracle DB.
Apache Storm is a distributed, real-time computational framework used to process unbounded streams of data from sources like messaging systems or databases. It allows building topologies with spouts that act as data sources and bolts that perform computations. Data flows between nodes as tuples through streams. Apache Kafka is a distributed publish-subscribe messaging system that stores feeds of messages in topics, allowing producers to write data and consumers to read it.
This document discusses whether OLAP (online analytical processing) is still relevant in the age of big data. It outlines common scenarios for using OLAP with Hadoop, issues with traditional OLAP tools connecting to big data, and approaches for implementing OLAP on Hadoop like ROLAP, HOLAP, and MOLAP. The Kyvos solution provides an in-memory MOLAP approach on Hadoop for fast, interactive analytics on large, diverse datasets without coding. Use cases discussed include consumer behavior analysis, telecom subscriber profiling, and risk analysis in financial services.
Presentation from the Rittman Mead BI Forum 2013 on ODI11g's Hadoop connectivity. Provides a background to Hadoop, HDFS and Hive, and talks about how ODI11g, and OBIEE 11.1.1.7+, uses Hive to connect to "big data" sources.
IN-MEMORY DATABASE SYSTEMS FOR BIG DATA MANAGEMENT.SAP HANA DATABASE.George Joseph
SAP HANA is an in-memory database system that stores data in main memory rather than on disk for faster access. It uses a column-oriented approach to optimize analytical queries. SAP HANA can scale from small single-server installations to very large clusters and cloud deployments. Its massively parallel processing architecture and in-memory analytics capabilities enable real-time processing of large datasets.
Vinod Nayal presented on options for ingesting data into Hadoop, including batch loading from relational databases using Sqoop or vendor-specific tools. Data from files can be FTP'd to edge nodes and loaded using ETL tools like Informatica or Talend. Real-time data can be ingested using Flume for transport with light enrichment or Storm with Kafka for a queue to enable low-latency continuous ingestion with more in-flight processing. The choice between Flume and Storm depends on the amount of required in-flight processing.
MySQL conference 2010 ignite talk on InfiniDBCalpont
InfiniDB is a column-oriented database engine that scales up across CPU cores and scales out across multiple nodes. It provides high performance for analytics, data warehousing, and read-intensive applications. Tests showed InfiniDB used less space, loaded data faster, and had significantly faster total and average query times compared to row-oriented databases. InfiniDB also showed predictable linear performance gains as data and nodes were increased.
Online analytical processing (OLAP) allows users to easily extract and analyze data from different perspectives. It originated in the 1970s and was formalized in 1993, with OLAP cubes organizing numeric facts by dimensions to enable fast analysis. OLAP provides operations like roll-up, drill-down, slice, and dice to analyze aggregated data across multiple systems. It offers advantages over relational databases for consistent reporting and analysis.
OLTP systems are used for operational tasks like processing transactions, while OLAP systems are used for analysis of historical data extracted from OLTP systems. OLAP systems allow for complex queries and reporting on aggregated and multidimensional views of the data. Both systems are complementary, with OLTP housing and processing the source transactional data and OLAP leveraging that data for planning, problem solving, and decision making.
Snapshots of a wildflower meadow, summer 2013. The Kerr Center's Native Pollinator Project is establishing and preserving habitat for native pollinators and educating farmers, ranchers and the public about ways to help native pollinators.
The document appears to be an advertisement for a lighting fixture called Sunglow. It includes details about the fixture such as:
- It comes in 5 colors with 11 gems
- The fixture has dimensions of 36cm width, 53cm height, and 92cm length
- There are diagrams showing the layout of lights/gems on the fixture in a 5x5 grid
This document summarizes a study that used proteomic analysis of aqueous humor samples from patients with primary open angle glaucoma and control samples. The study identified several proteins that were present at different levels between the patient and control samples, including prostaglandin H2D isomerase and transferrin. The results provide insights into the molecular mechanisms involved in the development of primary open angle glaucoma and could help generate new biomarkers or treatments for the disease.
The document provides details about an upcoming worship service at SKG church including the emcee and evangelist for next Sunday's service. It encourages attendees to always support the church and notes that the pastor or other church workers are available for prayer or counselling. The bulk of the document is lyrics to the hymn "He Leadeth Me" which expresses faith that God will guide and lead the singer through all of life's circumstances.
The document describes biochar trials conducted in 2013 by the Kerr Center to determine how biochar made from different feedstocks affects soil organic matter content. Samples of biochar made from various plant materials like pine needles, corn, and okra were mixed with sand in individual cups. The mixtures were analyzed at a lab to measure their organic matter content. A separate trial sent bulk biochar pieces to a lab to compare how long biochars from different sources persist in soil before breaking down. The goal was to identify the best feedstocks for making biochar to amend soils.
This document lists major earthquakes that have occurred around the world from 2010 back to 1923, including the 2010 Haiti earthquake, the Chile earthquake, the 2008 Sichuan earthquake in China, the 2004 Indonesian earthquake, the 1976 Tangshan earthquake in China, the 1964 Alaska earthquake in the United States, the 1952 Los Angeles earthquake in California, and the 1923 Tokyo earthquake in Japan.
This document provides instructions for joining a WiZiQ online class in 3 steps:
1. Open your email and click the class invitation link to view details and confirm attendance.
2. Create a WiZiQ account by entering sign up information if new, or sign in if already a member.
3. Click "Launch Class" to open the class window where you can chat, raise your hand, and interact during the scheduled class session.
This presentation shows elementary school teachers how to teach basic math concepts like addition, subtraction, multiplication and division using hands-on activities with everyday objects. It provides examples of using pencils or butterflies to demonstrate addition and subtraction by counting objects in sets. Multiplication is shown by counting the total number of pencils in multiple sets of the same number. Division is explained using the example of splitting a pizza among students to calculate the cost per slice. Interactive online games are also suggested for students to practice different math operations.
The document provides background information on the history of early modern Europe in the 15th and 16th centuries and the Netherlands specifically. It discusses the Eighty Years' War which led to the Dutch Golden Age and great prosperity driven by trade. It also summarizes the rise of the influential Dutch East India Company and its role in international trade and colonization during this period.
This presentation discusses how to prepare and deliver an effective presentation by considering the audience, timeline structure, vocal delivery, body language, and active listening. It emphasizes determining the purpose and existing knowledge of attendees, choosing an organized timeline like problem-solution, maintaining eye contact and posture, and developing habits of active listening. The overall goal is to engage the audience and get your main points across.
The Kerr Center for Sustainable Agriculture in Poteau, Oklahoma established a low-maintenance native plant landscape to attract pollinators. They surveyed existing native plants on their property, researched additional species well-suited to the local environment, and experimented with growing plants from seed and transplanting purchases. The landscape was designed to serve as an outdoor classroom, with plants labeled and educational materials created, to teach visitors about native plants and pollinators.
The document lists key facts about environmental topics:
1. It identifies the 3 R's of environmentalism as reduce, reuse, and recycle.
2. It notes that Earth Day is celebrated on April 22nd and World Water Day is March 22nd.
3. It also lists alternative energy sources as solar, wind, geothermal, and hydroelectric power.
The document discusses the history of database management and database models through 6 generations from 1900 to present. It describes the evolution from early manual record keeping systems to current big data technologies. Key database models discussed include hierarchical, network, relational, object-oriented, and dimensional models. The document also covers topics like data warehousing and data mining.
1. The document introduces databases and their history, from early data storage and retrieval to modern database management systems.
2. It discusses Edgar Codd's invention of the relational database model in 1970 which changed the field by separating data from application code for easier modification and generalization.
3. The document outlines what a database management system does, including managing large amounts of data, supporting efficient and concurrent access, and providing security.
Relational databases have pretty much ruled over the IT world for the last 30 years. However, Web 2.0 and the incipient Internet of Things (IoT) are some of the sources of a data explosion that has proved to exceed the limits of what modern relational databases can handle in a growing number of cases. As a result, new technologies had to be developed to handle these new use cases. We generally group these technologies under the umbrella of Big Data. In this two part presentation, we will start by understanding how relational databases have evolved to become the powerhouses they are today. In part 2 we will look at how non SQL databases are tackling the big data problem to scale beyond what relational databases can provide us today.
This document provides an overview of data warehousing and related concepts. It defines a data warehouse as a centralized database for analysis and reporting that stores current and historical data from multiple sources. The document describes key elements of data warehousing including Extract-Transform-Load (ETL) processes, multidimensional data models, online analytical processing (OLAP), and data marts. It also outlines advantages such as enhanced access and consistency, and disadvantages like time required for data extraction and loading.
Data warehousing involves integrating data from multiple sources into a central repository that can be analyzed to make informed decisions. A data warehouse stores large volumes of historical data optimized for analysis rather than transactions. It provides a single, consistent view of data from diverse sources to help users understand business information through queries and reporting. Data mining analyzes large observational datasets to discover previously unknown patterns and relationships that can provide useful insights for business users.
Richard discusses what a data warehouse is and why schools are setting them up. He explains that a data warehouse makes it easier for schools to optimize classroom usage, refine admissions systems, forecast demand, and more by bringing together data from different sources. It provides better information to make better admissions, retention, and fundraising decisions. He then discusses key data warehouse concepts like OLTP, OLAP, ETL, star schemas, and metadata to help the audience understand warehouse implementations.
The document defines a data warehouse as a copy of transaction data structured specifically for querying and reporting. Key points are that a data warehouse can have various data storage forms, often focuses on a specific activity or entity, and is designed for querying and analysis rather than transactions. Data warehouses differ from operational systems in goals, structure, size, technologies used, and prioritizing historic over current data. They are used for knowledge discovery through consolidated reporting, finding relationships, and data mining.
This presentation was provided by Ted Koppel ofAuto-Graphics, Inc, Ed Riding of SirsiDynix, Andrew K. Pace of OCLC, and John Mark Ockerbloom of The University of Pennsylvania, during the NISO webinar "Library Systems & Interoperability: Breaking Down Silos," held on June 10, 2009.
An overview of various database technologies and their underlying mechanisms over time.
Presentation delivered at Alliander internally to inspire the use of and forster the interest in new (NOSQL) technologies. 18 September 2012
The Role of XML in an Information Society with Barry Schaefferdclsocialmedia
In today’s information world, there is a battle in progress between two opposing views of content management and use. This “data war” pits the rectangular, or database, view against the hierarchical, or XML, view. Unbeknownst to many of us, this influences virtually every decision related to the computerization of information in society, and can have a real and lasting impact on your automation and content decisions.
Join Barry Schaeffer for his informative webinar which will shine some light on this battle, its sources and its very real and ongoing impacts on our information lives.
Barry Schaeffer is Principal Consultant for Content Life-Cycle Consulting (www.contentlcc.com), a high-level consulting practice he founded in 2009, specializing in the conception and design of structured information and XML-based systems. He is a regular columnist for CMSWire and has been published in Datamation, Federal Computer Week, Government Computer News, Intranet Development Magazine and CALS Journal, among other professional publications. He is a frequent speaker at industry conferences and symposia. Mr. Schaeffer has previously held management and technical positions with The Bell System (Pacific Telephone), Xerox Education Division, Planning Research Corporation, U. S. News and World Report, Datalogics and Grumman Data Systems’ InfoConversion Publishing Division where he managed federal business development He is a graduate of California State University, Los Angeles and the Bell System’s rigorous Management Achievement Program.
The Evolution of the Oracle Database - Then, Now and Later (Fontys Hogeschool...Lucas Jellema
Presentation on the role of the (relational) database in modern enterprise application architecture and on the major themes and development in the evolution of the Oracle Database through the years, up to and including 12c. This presentation was created for and delivered to students in Computer Science at Fontys Hogeschool in Eindhoven on April 25th 2014.
This document discusses data warehousing concepts and technologies. It defines a data warehouse as a subject-oriented, integrated, non-volatile, and time-variant collection of data used to support management decision making. It describes the data warehouse architecture including extract-transform-load processes, OLAP servers, and metadata repositories. Finally, it outlines common data warehouse applications like reporting, querying, and data mining.
Searching The Enterprise Data Lake With Solr - Watch Us Do It!: Presented by...Lucidworks
The document discusses searching enterprise data lakes with Apache Solr. It begins with an overview of how data storage has evolved from single databases to data warehouses to modern data lakes that store vast amounts of raw and processed data. The challenge is finding needed data in this environment. The document then covers the process for indexing data lake contents with Solr, including ingesting data, configuring Solr, parsing and indexing data, searching and analyzing data. It concludes with a demonstration of performing these steps and resources for further information.
introduction to data mining.
Data mining the practice of examining large pre-existing databases in order to generate new information.
samrat tayade,TE IT - ARMIET COLLEGE.
- Data warehousing aims to help knowledge workers make better decisions by integrating data from multiple sources and providing historical and aggregated data views. It separates analytical processing from operational processing for improved performance.
- A data warehouse contains subject-oriented, integrated, time-variant, and non-volatile data to support analysis. It is maintained separately from operational databases. Common schemas include star schemas and snowflake schemas.
- Online analytical processing (OLAP) supports ad-hoc querying of data warehouses for analysis. It uses multidimensional views of aggregated measures and dimensions. Relational and multidimensional OLAP are common architectures. Measures are metrics like sales, and dimensions provide context like products and time periods.
The document discusses advanced database management systems (ADBMS). It provides background on how databases have become essential in modern society and outlines new applications like multimedia databases, geographic information systems, and data warehouses. The document then covers the history of database applications from early hierarchical and network systems to relational databases and object-oriented databases needed for e-commerce. It also discusses how database capabilities have been extended to support new applications involving scientific data, images, videos, data mining, spatial data, and time series data.
Importance of Data - Where to find it, how to store, manipulate, and characterize it
Artificial Intelligence (AI)- Introduction to AI & ML Technologies/ Applications
Machine Learning (ML), Basic Machine Learning algorithms.
Applications of AI & ML in Marketing, Sales, Finance, Operations, Supply Chain
& Human Resources Data Governance
Legal and Ethical Issues
Robotic Process Automation (RPA)
Internet of Things (IoT)
Cloud Computing
This document discusses key concepts related to data warehousing including:
- The definition of a data warehouse as a subject-oriented, integrated, time-variant collection of data used for analysis and decision making.
- Common features of data warehouses such as being separate from operational databases, containing consolidated historical data, and being non-volatile.
- Types of data warehouse applications including information processing, analytical processing, and data mining.
- Common schemas used in data warehousing including star schemas, snowflake schemas, and fact constellation schemas.
AutoSys is an automated job scheduling system that allows users to create and manage job definitions. Jobs can be scheduled, monitored, and have their status reported on. Job definitions include attributes that specify when and where they run. Jobs can be defined through a graphical user interface or command line interface. AutoSys supports features like fault tolerance, load balancing, and reporting capabilities. Job types include boxes, commands, and file watchers. Boxes can contain other jobs and boxes to organize workflow. AutoSys tracks job statuses and uses them to determine when dependent jobs can run.
SQL is a language used to interface with relational database systems. It was developed by IBM in the 1970s and is now an industry standard. SQL has three main sublanguages: DDL for defining database schemas, DML for manipulating data, and DCL for controlling access.
Some key points about SQL include:
- DDL commands like CREATE, ALTER, and DROP are used to define and modify database structures.
- DML commands like SELECT, INSERT, UPDATE, and DELETE are used to query and manipulate the data.
- DCL commands like COMMIT, ROLLBACK, GRANT and REVOKE control transactions and user privileges.
- SQL can be used
This document discusses Frame Relay and Asynchronous Transfer Mode (ATM) networking technologies. It covers Frame Relay architecture, addressing formats, and the lack of flow and error control. It then covers ATM design goals, cell-based transmission, virtual paths and connections, ATM layers, and adaptation layers. The document concludes by discussing using ATM for local area networks and the LAN Emulation standard.
Frame Relay is a packet-switched WAN technology that transports variable-length frames over permanent virtual circuits (PVCs). It provides connection-oriented transmission of user data between two endpoints via a transparent logical link. Frame Relay operates at the data link layer and does not provide error or flow control, relying instead on higher layers for reliability. It offers bandwidth on demand and more efficient use of WAN links compared to traditional leased lines.
Frame Relay is a packet-switched protocol that operates at the physical and data link layers of the OSI model. It was originally designed for ISDN interfaces but is now used over various network interfaces. Frame Relay is more efficient than X.25 and offers higher performance without retransmission capabilities. Frame Relay uses data terminal equipment (DTE) connected to data circuit-terminating equipment (DCE) via physical and link layer connections to transmit data packets over wide area networks.
The document discusses Asynchronous Transfer Mode (ATM), a cell switching and multiplexing protocol used in broadband ISDN (B-ISDN) networks. It describes some of the key issues driving changes to local area networks, including supporting different types of traffic with quality of service guarantees. The original ATM architecture specified four adaptation layers (AAL1-4) to optimize different application classes, but this was later revised to three primary classes (AAL1, AAL5, and AAL3/4). ATM provides both permanent virtual connections (PVCs) that are manually configured and switched virtual connections (SVCs) that are set up on demand by users.
1) ATM uses fixed-sized packets called cells to transfer data at high speeds over both logical connections and physical interfaces in a streamlined manner.
2) ATM cells have a standard size and format including a header for routing and a payload for user data. Multiple logical connections can be multiplexed over a single physical interface.
3) ATM connections can be either virtual channel connections between two end users or virtual path connections that bundle multiple VCCs with the same endpoints to simplify networking and improve performance.
This document provides an overview of Frame Relay, a packet-switched WAN protocol. It discusses key aspects of Frame Relay including that it operates at the data link layer, uses virtual circuits to provide connections between devices, and implements congestion control through bits in the frame header. It also describes Frame Relay frames, devices, and common network implementations including private enterprise networks.
End-to-end pipeline agility - Berlin Buzzwords 2024Lars Albertsson
We describe how we achieve high change agility in data engineering by eliminating the fear of breaking downstream data pipelines through end-to-end pipeline testing, and by using schema metaprogramming to safely eliminate boilerplate involved in changes that affect whole pipelines.
A quick poll on agility in changing pipelines from end to end indicated a huge span in capabilities. For the question "How long time does it take for all downstream pipelines to be adapted to an upstream change," the median response was 6 months, but some respondents could do it in less than a day. When quantitative data engineering differences between the best and worst are measured, the span is often 100x-1000x, sometimes even more.
A long time ago, we suffered at Spotify from fear of changing pipelines due to not knowing what the impact might be downstream. We made plans for a technical solution to test pipelines end-to-end to mitigate that fear, but the effort failed for cultural reasons. We eventually solved this challenge, but in a different context. In this presentation we will describe how we test full pipelines effectively by manipulating workflow orchestration, which enables us to make changes in pipelines without fear of breaking downstream.
Making schema changes that affect many jobs also involves a lot of toil and boilerplate. Using schema-on-read mitigates some of it, but has drawbacks since it makes it more difficult to detect errors early. We will describe how we have rejected this tradeoff by applying schema metaprogramming, eliminating boilerplate but keeping the protection of static typing, thereby further improving agility to quickly modify data pipelines without fear.
Learn SQL from basic queries to Advance queriesmanishkhaire30
Dive into the world of data analysis with our comprehensive guide on mastering SQL! This presentation offers a practical approach to learning SQL, focusing on real-world applications and hands-on practice. Whether you're a beginner or looking to sharpen your skills, this guide provides the tools you need to extract, analyze, and interpret data effectively.
Key Highlights:
Foundations of SQL: Understand the basics of SQL, including data retrieval, filtering, and aggregation.
Advanced Queries: Learn to craft complex queries to uncover deep insights from your data.
Data Trends and Patterns: Discover how to identify and interpret trends and patterns in your datasets.
Practical Examples: Follow step-by-step examples to apply SQL techniques in real-world scenarios.
Actionable Insights: Gain the skills to derive actionable insights that drive informed decision-making.
Join us on this journey to enhance your data analysis capabilities and unlock the full potential of SQL. Perfect for data enthusiasts, analysts, and anyone eager to harness the power of data!
#DataAnalysis #SQL #LearningSQL #DataInsights #DataScience #Analytics
Global Situational Awareness of A.I. and where its headedvikram sood
You can see the future first in San Francisco.
Over the past year, the talk of the town has shifted from $10 billion compute clusters to $100 billion clusters to trillion-dollar clusters. Every six months another zero is added to the boardroom plans. Behind the scenes, there’s a fierce scramble to secure every power contract still available for the rest of the decade, every voltage transformer that can possibly be procured. American big business is gearing up to pour trillions of dollars into a long-unseen mobilization of American industrial might. By the end of the decade, American electricity production will have grown tens of percent; from the shale fields of Pennsylvania to the solar farms of Nevada, hundreds of millions of GPUs will hum.
The AGI race has begun. We are building machines that can think and reason. By 2025/26, these machines will outpace college graduates. By the end of the decade, they will be smarter than you or I; we will have superintelligence, in the true sense of the word. Along the way, national security forces not seen in half a century will be un-leashed, and before long, The Project will be on. If we’re lucky, we’ll be in an all-out race with the CCP; if we’re unlucky, an all-out war.
Everyone is now talking about AI, but few have the faintest glimmer of what is about to hit them. Nvidia analysts still think 2024 might be close to the peak. Mainstream pundits are stuck on the wilful blindness of “it’s just predicting the next word”. They see only hype and business-as-usual; at most they entertain another internet-scale technological change.
Before long, the world will wake up. But right now, there are perhaps a few hundred people, most of them in San Francisco and the AI labs, that have situational awareness. Through whatever peculiar forces of fate, I have found myself amongst them. A few years ago, these people were derided as crazy—but they trusted the trendlines, which allowed them to correctly predict the AI advances of the past few years. Whether these people are also right about the next few years remains to be seen. But these are very smart people—the smartest people I have ever met—and they are the ones building this technology. Perhaps they will be an odd footnote in history, or perhaps they will go down in history like Szilard and Oppenheimer and Teller. If they are seeing the future even close to correctly, we are in for a wild ride.
Let me tell you what we see.
06-04-2024 - NYC Tech Week - Discussion on Vector Databases, Unstructured Data and AI
Round table discussion of vector databases, unstructured data, ai, big data, real-time, robots and Milvus.
A lively discussion with NJ Gen AI Meetup Lead, Prasad and Procure.FYI's Co-Found
Beyond the Basics of A/B Tests: Highly Innovative Experimentation Tactics You...Aggregage
This webinar will explore cutting-edge, less familiar but powerful experimentation methodologies which address well-known limitations of standard A/B Testing. Designed for data and product leaders, this session aims to inspire the embrace of innovative approaches and provide insights into the frontiers of experimentation!
2. Contents
• History
• OLTP vs. OLAP
• Paradigm Shift
• Architecture
• Emerging Technologies
• Questions
3. History: Hollerith Cards
Once upon a time…
• Reporting was done with data stored on Hollerith cards.
– A card contained one record.
– Maximum length of the record was 80 characters.
– A data file consisted of a stack of cards.
• Data was “loaded” each time a report was run.
• Data had no “modeling” per se. There were just sets of records.
• Programs in languages such as COBOL, RPG, or BASIC would:
– Read a stack of data cards into memory
– Loop through records and perform a series of steps on each (e.g. increment a counter or add an amount
to a total)
– Send a formatted report to a printer
• It was difficult to report from multiple record types.
• Changes to data were implemented by simply adding, removing or replacing cards.
4. History: Hollerith Cards
FACTOIDS
• Card type: IBM 80-column punched card
• A/K/A: “Punched Card”, “IBM Card”
• Size: 7 3⁄8 by 3 1⁄4 inches
• Thickness: .007 inches (143 cards per inch)
• Capacity: 80 columns with 12 punch locations each
5. History: Magnetic Tape
• Card were eventually replaced by magnetic tape.
• Tapes made data easier to load and storage more efficient.
• Records were stored sequentially, so individual records could not be quickly accessed.
• Data processing was still very similar to that of cards—load a file into computer memory
and loop through the records to process.
• Updating data files was still difficult.
6. History: Disk Storage
History
• The arrival of disk storage revolutionized data storage and access.
• It was now possible to have a home base for data: a database.
• Data was always available: online.
• Direct access replaced sequential access so data could be accessed more quickly.
• Data stored on disk required new methods for adding, deleting, or updating records. This
type of processing became known as Online Transaction Processing (OLTP).
• Reporting from a database became known as Online Analytical Processing (OLAP).
7. History: Disk Storage
History
FACTOIDS
• Storage Device: IBM 350 disk storage unit
• Released: 1956
• Capacity: 5 million 6-bit characters (3.75 megabytes).
• Disk spin speed: 1200 RPM.
• Data transfer rate: 8,800 characters per second.
8. History: Relational Model
History
• In the 1960’s, E.F. Codd developed the relational model.
• Relational modeling was based on a branch of mathematics called set theory and added
rigor to the organization and management of data.
• Relational modeling also improved OLTP (inserting, updating, and deleting data) by
making these processes more efficient and reducing data anomalies.
• The relational model also introduced primary keys, foreign keys, referential integrity,
relational algebra, and a number of other concepts used in modern database systems.
• It soon became apparent that different data models facilitated OLAP vs. OLTP.
• Relational data was often denormalized (made non-relational) to support OLAP.
• Structured Query Language (SQL) was the first language created to support relational
database operations both OLAP and OLTP.
9. History: Relational Model
FACTOIDS
• Although E.F. Codd was employed by IBM when he create the relational model and IBM
originated the SQL language (then “SEQUEL”), IBM was not the first vendor to produce a
relational database or to use SQL.
• The first commercial implementation of relational database and SQL was from Relational
Software, Inc. which is now Oracle Corporation.
• SQL has been standardized by standards organizations American National Standards
Institute (ANSI) and the International Standards Organization (ISO).
10. History: Extracts 1
• In early relational databases, data was extracted from OLTP systems into denormalized
extracts for reporting.
OLTP OLAP
Report
Source
Extract
11. History: Extracts 2
History
• And more extracts...
OLTP OLAP
Report
Source
Extract
OLTP OLAP
Report
Source
Extract
OLAP Report
Extract
15. History: Naturally Evolving Systems 2
• Naturally evolving systems resulted in
– Poor organization of data
– Extremely complicated processing requirements
– Inconsistencies in extract refresh status
– Inconsistent report results.
• This created a need for architected systems for analysis and reporting.
• Instead of multiple extract files, a single source of truth was needed for each data source.
16. History: Architected Systems
• Developers began to design architected systems for OLAP data.
• In the 1980’s and 1990’s, organizations began to integrate data from multiple sources such
as accts. receivable, accts. payable, HR, inventory, and so on. These integrated OLAP
databases became known as Enterprise Data Warehouses (EDWs).
• Over time methods and techniques for extracting and integrating data into architected
systems began to evolve and standardize.
• The term data warehousing is now used to refer to the commonly used architectures,
methods, and techniques for transforming and integrating data to be used for analysis.
17. History: An Architected Data Warehouse
Example of an Architected Data Warehouse
OLTP Report
OLTP
Staging
History
DM
DM
DM
DM
Report
Data
set
Data
set
OLTP
OLTP
ODS
19. History: Compare Architected Data Warehouse
Compare: Architected Data Warehouse
OLTP Report
OLTP
Staging
History
DM
DM
DM
DM
Report
Data
set
Data
set
OLTP
OLTP
ODS
20. History: Inmon
• In the early 1990’s W.H. Inmon published Building the Data Warehouse (ISBN-
10: 0471141615)
• Inmon put together the quickly accumulating knowledge of data warehousing and
popularized most of the terminology we use today.
• Data in a data warehouse is extracted from another data source, transformed to make it
suitable for analysis, and loaded into the data warehouse. This process is often referred to
as Extract, Transform and Load (ETL).
• Since data from multiple sources was integrated in most data warehouses, Inmon also
described the process as Transformation and Integration (T&I).
• Data in a data warehouse is stored in history which is modeled for fast performance when
querying the data.
• The history tables are the source of truth.
• Data from history is usually extracted into data marts which are used for analysis and
reporting.
• Separate data marts are created for each application. There is often redundant data
across data marts.
21. History: Inmon
FACTOIDS
• W.H. Inmon coined the term data warehouse.
• W.H. Inmon is recognized by many as the father of data warehousing.
• W.H. Inmon created the first and most commonly accepted definition of a data
warehouse: A subject oriented, nonvolatile, integrated, time variant collection of data in
support of management's decisions.
• Other firsts of W.H. Inman
– Wrote the first book on data warehousing
– Wrote the first magazine column on data warehousing
– Taught the first classes on data warehousing
22. History: Kimball 1
• Also in the 1990’s, Ralph Kimball published The Data Warehouse Toolkit (ISBN-
10: 0471153370) which popularized dimensional modeling.
• Dimensional modeling is based on the cube concept which is a multi-dimensional view of
data.
A cube used to represent multi-dimensional data
• The cube metaphor can only illustrate three dimensions. A dimensional model can be any
number of dimensions.
23. History: Kimball 2
• Kimball implemented cubes as star schemas which support querying data in multiple
dimensions.
24. History: Kimball 3
• Kimball’s books do not discuss the relational model in depth, but his dimensional model
can be explained in relational terms.
• A star schema is a useful way to store data for quickly slicing and dicing data on multiple
dimensions.
• Dimensional modeling and star schema are frequently misunderstood and improperly
implemented. Queries against incorrectly designed tables in a star schema can skew
report results.
• The term OLAP has come to be used specifically to refer to dimensional modeling in many
marketing materials.
• Star schemas are implemented as data marts so that they can be queried by users and
applications. However, data marts aren’t necessarily star schema.
25. History: Kimball 4
FACTOIDS
• Ralph Kimball had a Ph.D. in electrical engineering from Stanford University.
• Kimball worked at the Xerox Palo Alto Research Center (PARC). PARC is where laser
printing, Ethernet, object-oriented programming, and graphic user interfaces were
invented.
• Kimball was a principal designer of the Xerox Star Workstation which was the first personal
computer to use windows, icons, and mice.
26. OLTP vs. OLAP
Operational Data/OLTP Data Warehouse/OLAP
Data is normalized (3NF) Data may be normalized, denormalized, use
dimensional models, application-specific data
sets, or other designs.
Data is constantly updated. Data represents a state at a point in time.
Existing data does not change. New data can
be added to history.
Typical operations are selects on small sets of
records, inserts, updates, and deletes of
individual records.
Typical operations are selects, sorts, groupings
and aggregations of large numbers of records,
and inserts of thousands or millions of records.
All transactions are logged. Inserts may not be logged at record level.
There normally are no updates or deletes.
B-tree indexes used for performance Partitioning and bitmap indexes are used for
performance.
Traditional development life cycle Heuristic and agile development
Data designed for application Data taken from some other application
Date range of records is limited; old
transactions are archived.
Date range of history tables can be many years.
27. Paradigm Shift: For Management
For Management
• Traditional development life cycle doesn’t work well when building a data warehouse. There
is a discovery process. Agile development works better.
• OLTP data was designed for a given purpose, but OLAP is created from data that was
designed for some other purpose—not reporting. It is important to evaluate data content
before designing applications.
• OLAP data may not be complete or precise per the application.
• Data integrated from different sources may be inconsistent.
– Different code values
– Different columns
– Different meaning of column names
• OLAP data tend to be much larger requiring more resources.
• Storage, storage, storage…
28. Paradigm Shift: For DBAs
For DBAs
• Different system configurations (in Oracle, different initialization parameters)
• Transaction logging may not be used, and methods for recovery from failure are different.
• Different tuning requirements:
– Selects are high cardinality (large percentage of rows)
– Massive sorting, grouping and aggregation
– DML operations can involve thousands or millions of records.
• Need much more temporary space for caching aggregations, sorts and temporary tables.
• Need different backup strategies. Backup frequency is based on ETL scheduling instead of
transaction volume.
• May be required to add new partitions and archive old partitions in history tables.
• Storage, storage, storage…
29. Paradigm Shift: For Architects & Developers
For Architects and Developers
• Different logical modeling and schema design.
• Use indexes differently (e.g. bitmap rather than b-tree)
• Extensive use of partitioning for history and other large tables
• Different tuning requirements
– Selects are high cardinality (large percentage of rows)
– Lots of sorting, grouping and aggregation
– DML operations can involve thousands or millions of records.
• ETL processes are different than typical DML processes
– Use different coding techniques
– Use packages, functions, and stored procedures but rarely use triggers or constraints
– Many steps to a process
– Integrate data from multiple sources
• Iterative and incremental development process (agile development)
30. Paradigm Shift: For Analysts and Data Users
For Analysts and Data Users—All Good News
• A custom schema (data mart) can be created for each application per the user requirements.
• Data marts can be permanent, temporary, generalized or project-specific.
• New data marts can be created quickly—typically in days instead of weeks or months.
• Data marts can easily be refreshed when new data is added to the data warehouse. Data
mart refreshes can be scheduled or on demand.
• In addition to parameterized queries and SQL, there may be additional query tools and
dashboards (e.g. Business Intelligence, Self-Service BI, data visualization, etc.).
• Several years of history can be maintained in a data warehouse—bigger samples.
• There is a consistent single source of truth for any given data set.
31. Architecture: Main Components
Components of a Data Warehouse
Operational Data Data Warehouse OLAP Data
ETL ETL
OLTP Report
OLTP
Staging History
REF
DM
DM
DM
DM
Report
Data
set
Data
set
ODS
32. Architecture: Staging and ODS
Staging and ODS
• New data is initially loaded into staging so that it can be
Operational Data Data Warehouse OLAP Data
processed into the data warehouse.
OLTP Report
OLTP
Staging History
REF
DM
DM
DM
DM
Report
Data
set
Data
set
ODS
ETL
• Many options are available for getting operational data
from internal or external sources into the staging area
• SQL Loader
• imp/exp/impdp/expdp
• Change Data Capture (CDC)
• Replication via materialized views
• Third-party ETL tools
• Staging contains a snapshot in time of operational data.
• An Operational Data Store (ODS) is an optional
component that is used for near real time reporting.
• Transformation and integration of data in an ODS
is limited.
• Less history (shorter time span) is kept in an ODS.
33. Architecture: History and Reference Data
History and Reference Data
Operational Data Data Warehouse OLAP Data
ETL
OLTP Report
OLTP
Staging History
REF
DM
DM
DM
DM
Report
Data
set
Data
set
ODS
• History includes all source data—no
exclusions or integrity constraints.
• Partitioning is used to:
• manage extremely large tables
• improve performance of queries
• to facilitate “rolling window” of
history.
• Denormalization can be used to
reduce number of joins when
selecting data from history.
• No surrogate keys—maintain all
original code values in history.
• Reference data should also have
history (e.g. changing ICD9 codes
over time).
34. Architecture: Data Marts
Data Marts
• Data marts are per requirements of users
Operational Data OLAP Data
ETL ETL
OLTP Report
OLTP
Staging History
REF
DM
DM
DM
DM
Report
Data
set
Data
set
ODS
and applications.
• Selection criteria (conditions in WHERE
clause) are applied when creating data
marts.
• Logical data modeling is applied at data
mart level (e.g. denormalized, star
schemas, analytic data sets, etc.).
• Integrity constraints can be applied at data
mart level.
• Any surrogate keys can be applied at data
mart level (e.g. patient IDs).
• Data marts can be Oracle, SQL Server,
text files, SAS data sets, etc.
• Data marts can be permanent or
temporary for ongoing or one-time
applications.
• Data mart refreshes can be scheduled or
on demand.
35. Emerging Technologies
Emerging technologies that are having an impact on data warehousing
• Massively Parallel Processing (MPP)
• In-Memory Databases (IMDB)
• Unstructured Databases
• Column-Oriented Databases
• Database Appliances
• Data Access Tools
• Cloud Database Services
36. Emerging Technologies: MPP
Massively Parallel Processing (MPP)
• Data is partitioned over hundreds or even thousands of server nodes.
• A controller node manages query execution.
• A query is passed to all nodes simultaneously.
• Data is retrieved from all nodes and assembled to produce query results.
• MPP systems will automatically partition and distribute data using their own algorithms.
Developers and architects need only be concerned with conventional data modeling and DML
operations.
• MPP systems make sense for OLAP and data warehousing where queries are on very large
numbers of records.
37. Emerging Technologies: IMDB
In-Memory Database
• Data is stored in random access memory (RAM) rather than on disk or SSD.
• Memory is accessed much more quickly reducing seek times.
• Traditional RDBMS software often uses a memory cache when processing data, but it is
optimized for limited cache with most data stored on disk.
• IMDB software has modified algorithms to be optimized to read data from memory.
• Database replication with failover is typically required because of the volatility of computer
memory.
• Cost of RAM has dropped considerably in recent years making IMDB systems more feasible.
• Microsoft SQL Server has an In-Memory option. Tables must be defined as memory
optimized to use this feature.
• Oracle has recently announced the upcoming availability of their In-Memory Option.
38. Emerging Technologies: Unstructured Databases
Unstructured Databases
• Unstructured databases-- sometimes referred to as NoSQL databases--support vast amounts
of text data and extremely fast text searches.
• Unstructured databases utilize massively parallel processing (MPP) and extensive text
indexing.
• Unstructured databases do not fully support relational features such as complex data
modeling, join operations and referential integrity. However, these databases are evolving to
incorporate additional relational capabilities.
• Oracle, Microsoft, and other RDBMS vendors are creating hybrid database systems that
incorporate unstructured data with relational database systems.
• Unstructured databases are useful for very fast text searches on very large amounts of data—
they are generally not useful for complex transaction processing, analyses and informatics.
39. Emerging Technologies: Big Data
FACTOIDS
• Big data became an issues as early as 1880 with the U.S. Census which took several years to
tabulate with then existing methods.
• The term information explosion was first used in a the Lawton Constitution, a small-town
Oklahoma newspaper in 1941.
• The term big data was used for the first time in an article by NASA researchers Michael Cox
and David Ellsworth. The article discussed the inability of current computer systems to
handle the increasing amounts of data.
• Google was a pioneer in creating modern hardware and software solutions for big data.
• Parkinson’s Law of Data: “Data expands to fill the space available.”
• 1 exabyte= 10006 bytes = 1018 bytes = 1000 petabytes = 1 billion gigabytes.
40. Emerging Technologies: Column-Oriented
Column-Oriented Databases
• Data in a typical relational database is organized by row. The row paradigm is used for
physical storage as well as the logical organization of data.
• Column-Oriented databases physically organize data by column while still able to present
data within rows.
• Data is stored on disk in blocks. While the row-oriented databases store the contents of a
row in a block, column-oriented databases store the contents of a column in a block.
• Each column has row and table identifiers so that columns can be combined to produce rows
of data in a table.
• Since most queries select a subset of columns (rather than entire rows), column-oriented
databases tend to perform much better for analytical processing (e.g. querying a data mart).
• Microsoft SQL Server and Oracle Exadata have support for column-based data storage.
41. Emerging Technologies: Appliances
Database Appliances
• A database appliance is an integrated, preconfigured package of RDBMS software and
hardware.
• The most common type of database appliance is a data warehouse appliance.
• Most major database vendors including Microsoft and Oracle and their hardware partners
package and sell database appliances for data warehousing.
• Data warehouse appliances utilize massively parallel processing (MPP).
• Database appliances generally do not scale well outside of the purchased configuration. For
example, you generally don’t add storage to a database appliance.
• The database appliance removes the burden of performance tuning. Conversely, database
administrators have less flexibility.
• A database appliance can be a cost-effective solution for data warehousing in many
situations.
42. Emerging Technologies: Data Access Tools
Data Access Tools
• Business Intelligence (BI) tools allow users to view and access data, create aggregations and
summaries, create reports, and view dashboards with current data.
• BI tools typically sit on top of data marts created by the architects and developers. Data
marts that support BI are typically star schema.
• Newer Self-Service BI tools add additional capabilities such as allowing users to integrate
multiple data sources and do further analysis on result data sets from previous analyses.
• Data visualization tools allow users to view data in various graphs.
• Newer tools allow users to access and analyze data from multiple form factors including
smart phones and tablets.
• Data access, BI and data visualization tools do not always provide the capability to perform
complex analyses or fulfill specific requirements of complex reports (e.g. complex statistical
analyses or studies submitted to journals). Programming skills are frequently still required.
43. Emerging Technologies: Cloud Databases
Cloud Database Services
• Oracle, Microsoft, and other database vendors offer cloud database services.
• The cloud service performs all database administrative tasks:
– Replicate data on multiple severs
– Make backups
– Scale growing databases
– Performance tuning
• Cloud services can be useful for prototyping and heuristic development. A large commitment
to hardware purchases and administrative staff can be postponed for later assessment.
• Cloud services could result in considerable cost savings for some organizations.
• A cloud hybrid database is one that has database components both on the cloud and on local
servers.
• Cloud services may limit administrative options and flexibility vs. having your own DBAs.
• Cloud services may not meet regulatory requirements for security and storage for some
industries (e.g. medical data).
44. Operational Data Data Warehouse OLAP Data
ETL ETL
OLTP Report
OLTP
Staging History
REF
DM
DM
DM
DM
Report
Data
set
Data
set
ODS