


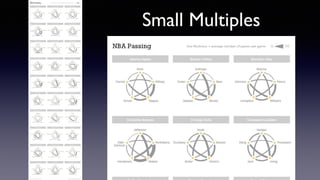


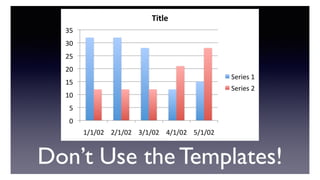
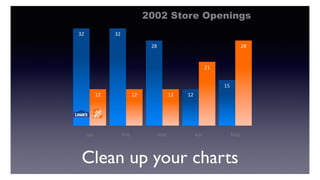

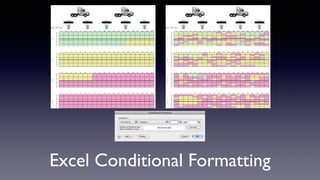


This document provides design tips and tools for creating effective infographics, emphasizing the importance of accuracy, focus, visual elements, transparency, and variety in data presentation. It highlights key insights about data retention and the brain's processing abilities, as well as the growth of global internet traffic and data usage. A range of design tools and examples are also mentioned for enhancing infographic creation.


