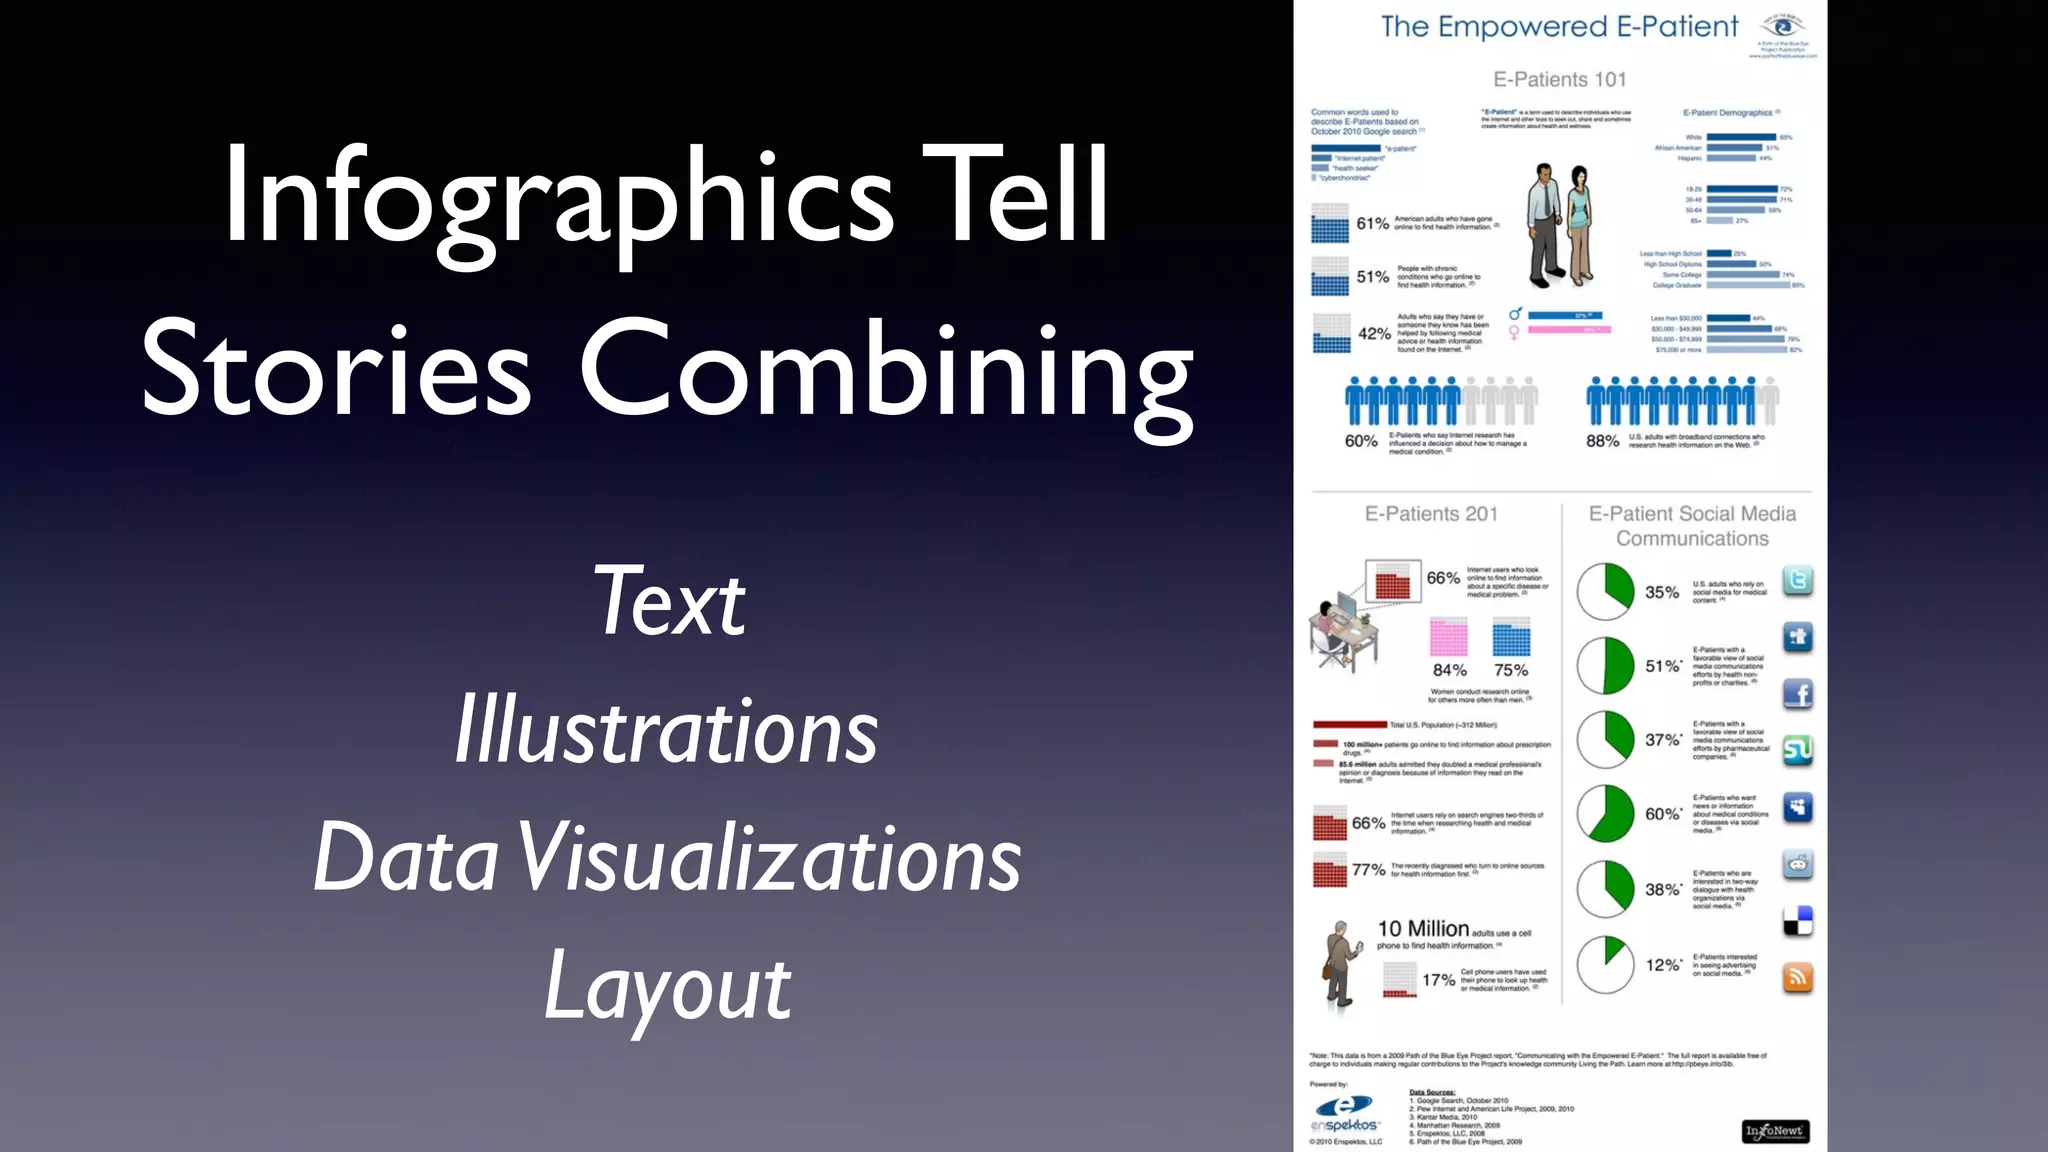
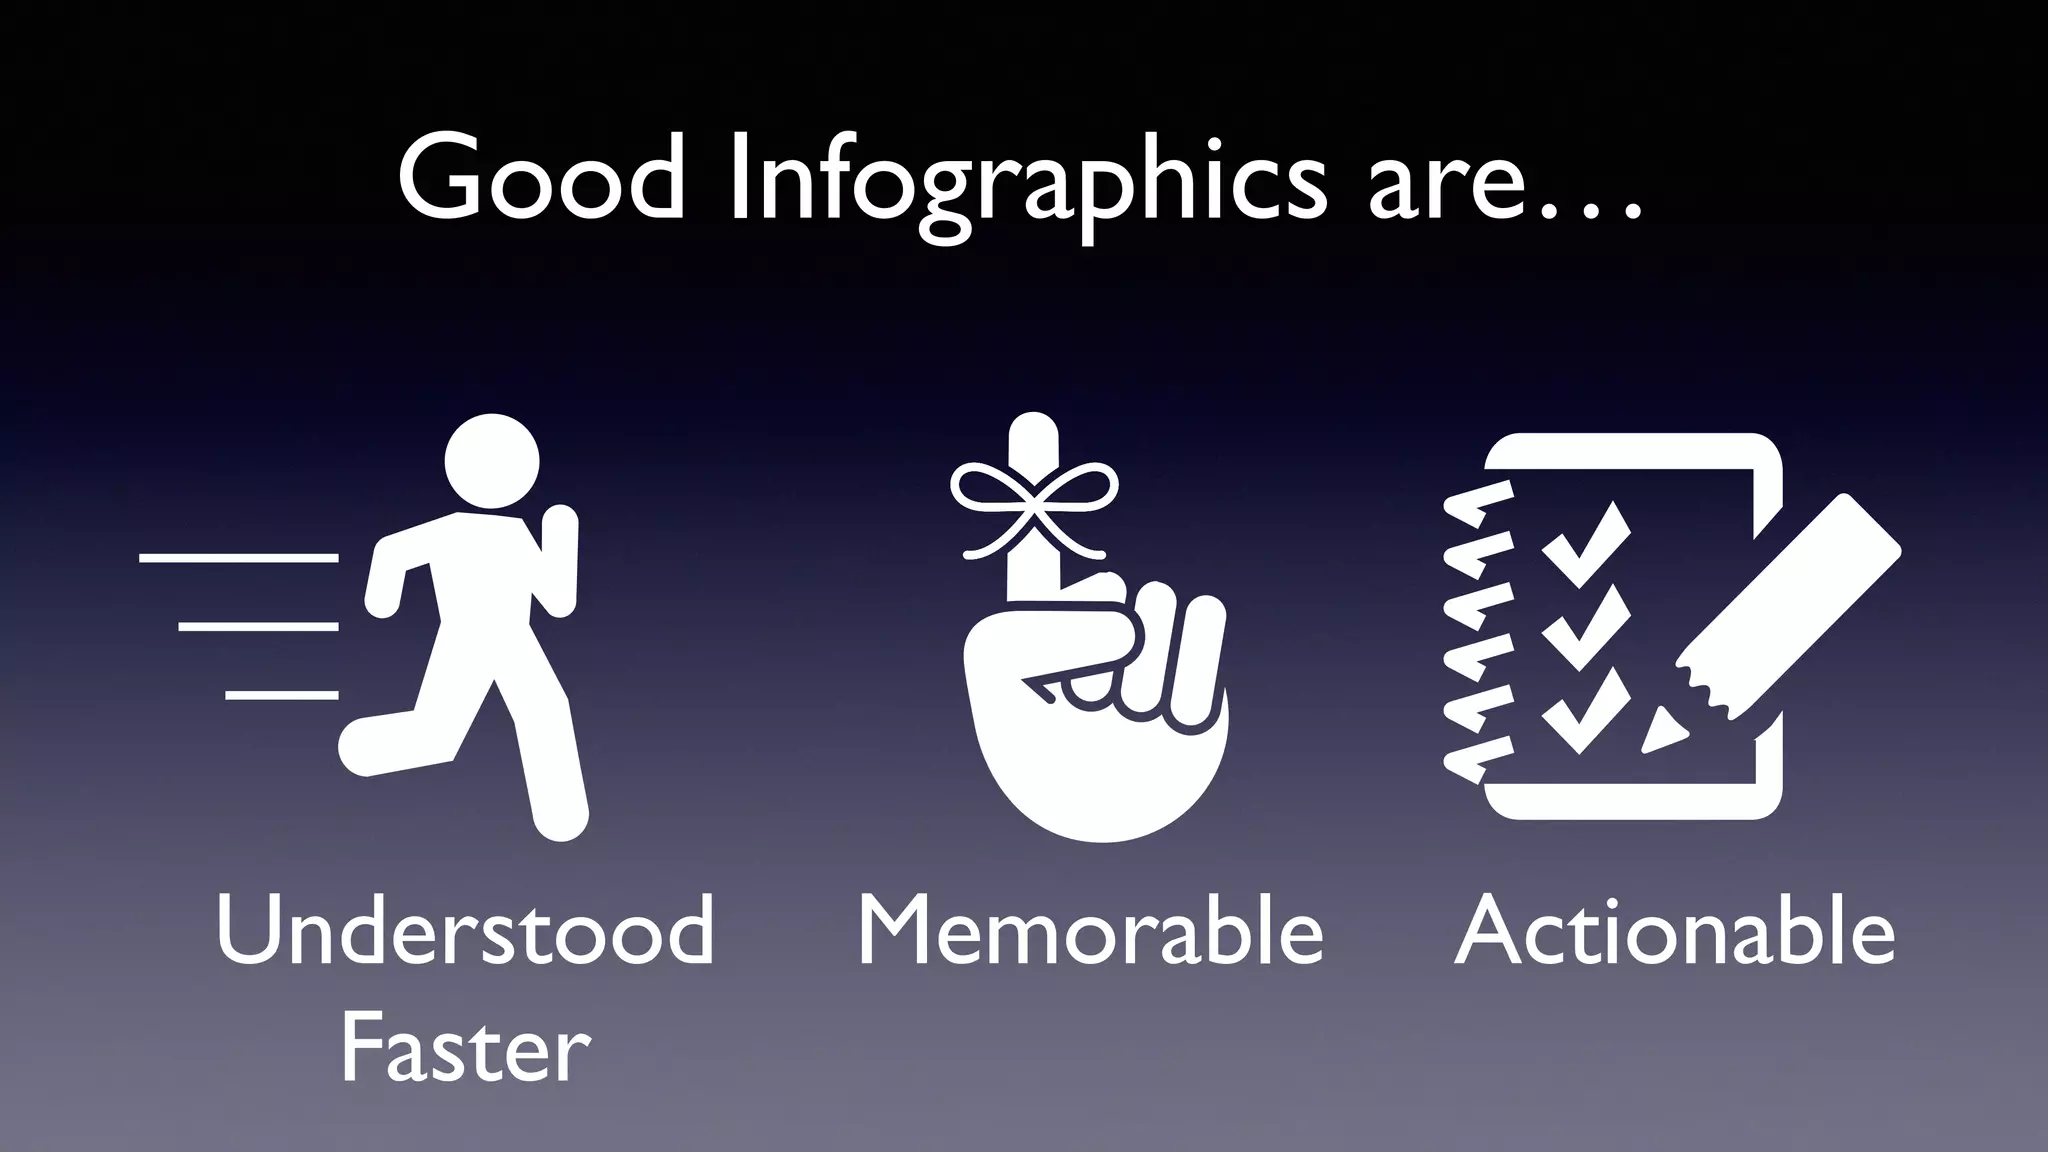
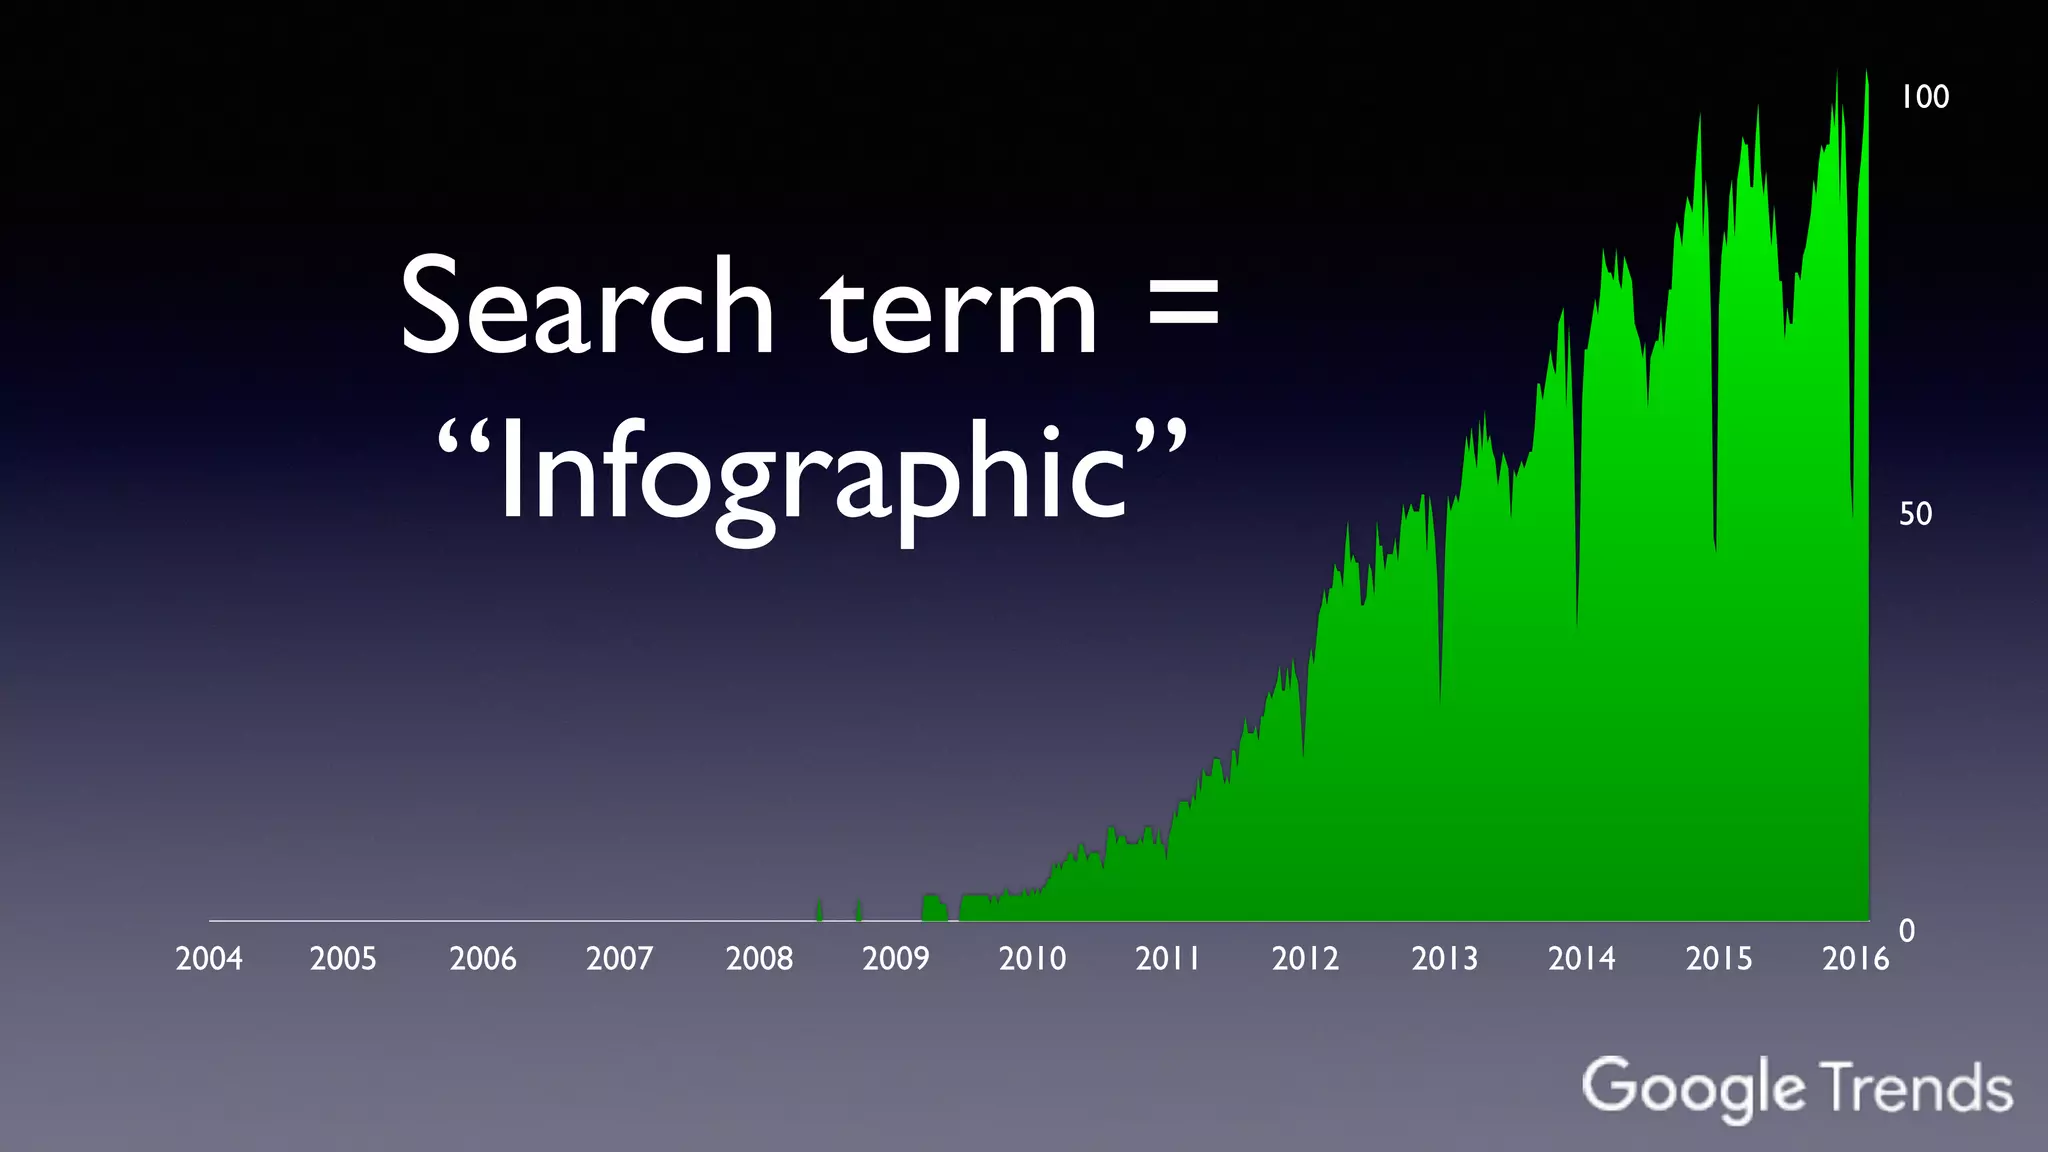
#RocksDigital
@rtkrum
June 30, 2016
Cool
Infographics
Randy Krum
President, InfoNewt
CONTINUING AND
PROFESSIONAL EDUCATION
DFW
DataViz &
Infographics
5 Things About Me
coolinfographics.com/RocksDigital2016
Most links available at
NOT Data Visualization!
Image by Will Lion, 2008
280
Newspapers/Day
Dr. Martin Hilbert, USC, 2014
Information
Overload
1986 2007 2014
174
Newspapers/Day
40
Newspapers/Day
25,000
50,000
75,000
100,000
125,000
1990 1994 1998 2002 2006 2010 2014 2018
Global Internet Traffic Growth
(Petabytes/Month)
CiscoVisual Networking Index, 2015
2016
Over 100,000 Petabytes/Month in 2017
Don’t Be Part of the Problem!
University of Rochester, 2004
80% of the brain is dedicated to
visual processing
The human brain is a pattern recognition machine
Picture Superiority Effect
European Journal of Cognitive Psychology 18(6), 2006
10% 65%
Text or Audio Only Text + Picture
Memory retention after 3 days
What is an infographic?
DataVisualizations
Infographics Tell
Stories Combining
Text
Illustrations
DataVisualizations
Layout
The
5-Second
Rule
Quick <5sec
Long >5min
Key
Message
What is the ONE
thing you want your
audience to
remember?
“Google makes money
from advertising!”
3-Part Story Format
Introduction/Foundation
Call-To-Action/Conclusion
Ah-Ha!
The Main Event
Introduction
Conclusion
Ah-Ha!
The Main Event
www.rothira.com/tower-of-beer
Good Infographics are…
Understood
Faster
Memorable Actionable
Static
Infographic
bit.ly/1kryeac
Animated - Wind Maps
hint.fm/wind/
August 29, 2012 - Hurricane Isaac
FernandaViégas, Google DataVisualization Group
Animated GIF
Videos
youtu.be/VcSX4ytEfcE youtu.be/3qRtDnsnSwk
projects.flowingdata.com/target/ youtu.be/kY3AgpmQ6ZU
Interactive Hover/Click for more information
2004 2005 2006 2007 2008 2009 2010 2011 2012 2013 2014 2015 2016
Search term =
“Infographic”
0
100
50
6
Informative
Popular,
Interesting,
Related
Topics
Share
Internal
Data
How-To
Persuasive
Company
Elevator Pitch
Infographic Ad
Infographic Ads
Infographic
PR
Charities
And
Humanitarian
Information
Lobbying
Entertainment
Infographic MusicVideo
Röyksopp
Remind me
Financial
Data
Sales
Data
Business
Model
Competitor
Landscape
Social Media Strategy
Qualitative
Data
Quantitative Data
Personas
Or
Demographics
Annual
Reports
Please
Be Accurate
FalseVisualizations
Calculate Area for Shapes
1X
9X
1X
3X
Area = 0.79in2
Diameter = 1in
Area = 0.785in2
Diameter = 1in
Area = 7.07in2
Diameter = 3in
Area = 2.355in2
Diameter = 1.73in
WRONG
CORRECT
FalseVisualizations
January 6, 2016
FalseVisualizations
January 6, 2016
Eliminate Chart Legends
Tell A Story
A big pile of data
The human brain is a pattern recognition machine
Preattentive Attributes
Visual aspects your brain can process easily in a fraction of a second
Form Color PositionSize
Better Design
0"
10"
20"
30"
40"
50"
60"
1975" 2007"
Melanoma(incidence(rates(per(100,000(people(
Australia(has(the(HIGHEST(rates(of(Melanoma((Skin(Cancer)(
USA"
AUS"
UK"
Vector Graphics
OmniGraffleAdobe Illustrator
PowerPoint InkscapeAffinity Designer
Visio
Online Infographics
Design
Image Editing
Adobe Photoshop Pixelmator
AcornGIMP
The Noun Project
thenounproject.com
Wordle.net
chartle.net
gliffy.com
Highcharts/HighMaps JS
highcharts.com
D3.js
Coolinfographics.com/Tools
coolinfographics.com/book
Download a Free Chapter!
DFW
DataViz &
Infographics
DFW DataVisualization & Infographics
#DFWDataVizbit.ly/DFWDataViz
DataVisualization & Dashboard
Design Course
Nov 2 - Dec 14, 2016
bit.ly/SMUDataViz CONTINUING AND
PROFESSIONAL EDUCATION
Contact
infonewt.com
@rtkrum
coolinfographics.com
randy@infonewt.com

Cool Infographics: Examples, Tips & Tools