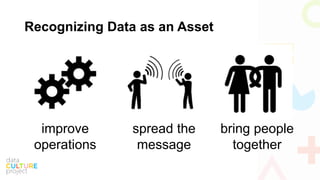
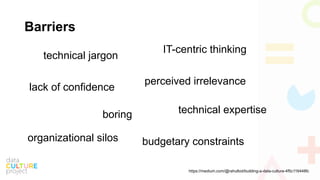
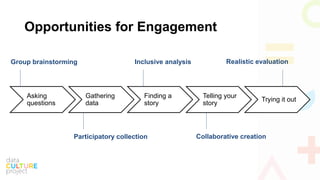
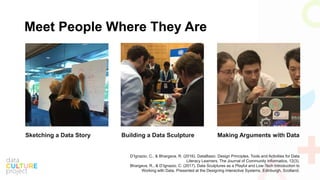
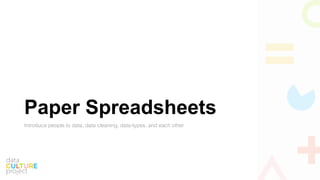
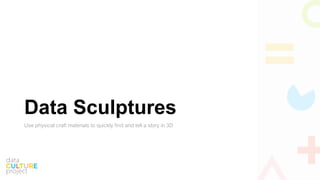
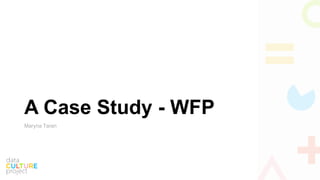
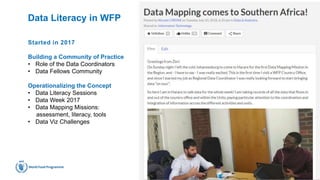
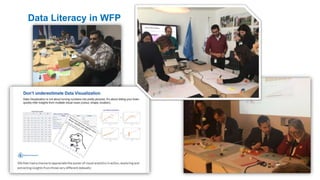
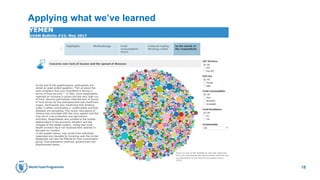
Empowering Those That
Don’t “Speak” Data
Recognizing Data as an Asset
improve
operations
spread the
message
bring people
together
Learning to Speak Data
Barriers
technical jargon
lack of confidence
technical expertise
IT-centric thinking
perceived irrelevance
organizational silos budgetary constraints
boring
https://medium.com/@rahulbot/building-a-data-culture-4f5c116448fc
Separate Technology from Process
Excel doesn’t help you learn to ask better
questions.
R won’t pick the most appropriate chart
for telling your story.
Tableau doesn’t tell you which narrative
arc will convince your audience.
Putting it Into Practice
Opportunities for Engagement
Asking
questions
Gathering
data
Finding a
story
Telling your
story
Trying it out
Group brainstorming
Participatory collection
Inclusive analysis
Collaborative creation
Realistic evaluation
Meet People Where They Are
Sketching a Data Story Building a Data Sculpture
D’Ignazio, C., & Bhargava, R. (2016). DataBasic: Design Principles, Tools and Activities for Data
Literacy Learners. The Journal of Community Informatics, 12(3).
Bhargava, R., & D’Ignazio, C. (2017). Data Sculptures as a Playful and Low-Tech Introduction to
Working with Data. Presented at the Designing Interactive Systems, Edinburgh, Scotland.
Making Arguments with Data
Paper Spreadsheets
Introduce people to data, data cleaning, data-types, and each other
Data Sculptures
Use physical craft materials to quickly find and tell a story in 3D
A Case Study - WFP
Maryna Taran
WFP Data Literacy
Maryna Taran,
Field Data Coordinator
The World Food Programme (WFP) is
the world's largest humanitarian agency
fighting hunger worldwide, delivering
food assistance in emergencies and
working with communities to improve
nutrition and build resilience.
WFP is funded entirely by donations
from governments, companies and
private individuals.
4
WFP is headquartered in Rome.
We have a global presence that includes:
• 83 Country Offices worldwide
• 6 Regional Bureaux (Bangkok, Cairo,
Dakar, Johannesburg, Nairobi and Panama)
• 14 offices in world capitals
• A vast supply chain logistics network that
enables us to quickly deliver life-saving
food assistance anywhere in the world
• Specialist centres for innovation
and development of sustainable solutions
to hunger.
GLOBAL PRESENCE
6
Data Literacy in WFP
16
Started in 2017
Building a Community of Practice
• Role of the Data Coordinators
• Data Fellows Community
Operationalizing the Concept
• Data Literacy Sessions
• Data Week 2017
• Data Mapping Missions:
assessment, literacy, tools
• Data Viz Challenges
Data Literacy in WFP
17
Applying what we’ve learned
18
Speaking Data
Opportunities for Engagement
Asking
questions
Gathering
data
Finding a
story
Telling your
story
Trying it out
Group brainstorming
Participatory collection
Inclusive analysis
Collaborative creation
Realistic evaluation
Empowering Those That
Don’t “Speak” Data
Rahul Bhargava
rahulb@mit.edu
@rahulbot
datacultureproject.org
datatherapy.org
databasic.io

Empowering those that don't "speak" data

  • 1.
  • 2.
    Recognizing Data asan Asset improve operations spread the message bring people together
  • 3.
  • 4.
    Barriers technical jargon lack ofconfidence technical expertise IT-centric thinking perceived irrelevance organizational silos budgetary constraints boring https://medium.com/@rahulbot/building-a-data-culture-4f5c116448fc
  • 5.
    Separate Technology fromProcess Excel doesn’t help you learn to ask better questions. R won’t pick the most appropriate chart for telling your story. Tableau doesn’t tell you which narrative arc will convince your audience.
  • 6.
  • 7.
    Opportunities for Engagement Asking questions Gathering data Findinga story Telling your story Trying it out Group brainstorming Participatory collection Inclusive analysis Collaborative creation Realistic evaluation
  • 9.
    Meet People WhereThey Are Sketching a Data Story Building a Data Sculpture D’Ignazio, C., & Bhargava, R. (2016). DataBasic: Design Principles, Tools and Activities for Data Literacy Learners. The Journal of Community Informatics, 12(3). Bhargava, R., & D’Ignazio, C. (2017). Data Sculptures as a Playful and Low-Tech Introduction to Working with Data. Presented at the Designing Interactive Systems, Edinburgh, Scotland. Making Arguments with Data
  • 10.
    Paper Spreadsheets Introduce peopleto data, data cleaning, data-types, and each other
  • 11.
    Data Sculptures Use physicalcraft materials to quickly find and tell a story in 3D
  • 12.
    A Case Study- WFP Maryna Taran
  • 13.
    WFP Data Literacy MarynaTaran, Field Data Coordinator
  • 14.
    The World FoodProgramme (WFP) is the world's largest humanitarian agency fighting hunger worldwide, delivering food assistance in emergencies and working with communities to improve nutrition and build resilience. WFP is funded entirely by donations from governments, companies and private individuals. 4
  • 15.
    WFP is headquarteredin Rome. We have a global presence that includes: • 83 Country Offices worldwide • 6 Regional Bureaux (Bangkok, Cairo, Dakar, Johannesburg, Nairobi and Panama) • 14 offices in world capitals • A vast supply chain logistics network that enables us to quickly deliver life-saving food assistance anywhere in the world • Specialist centres for innovation and development of sustainable solutions to hunger. GLOBAL PRESENCE 6
  • 16.
    Data Literacy inWFP 16 Started in 2017 Building a Community of Practice • Role of the Data Coordinators • Data Fellows Community Operationalizing the Concept • Data Literacy Sessions • Data Week 2017 • Data Mapping Missions: assessment, literacy, tools • Data Viz Challenges
  • 17.
  • 18.
  • 19.
  • 20.
    Opportunities for Engagement Asking questions Gathering data Findinga story Telling your story Trying it out Group brainstorming Participatory collection Inclusive analysis Collaborative creation Realistic evaluation
  • 21.
    Empowering Those That Don’t“Speak” Data Rahul Bhargava rahulb@mit.edu @rahulbot datacultureproject.org datatherapy.org databasic.io

Editor's Notes

  • #2 Data is key to unlocking new insights, ideas and possibilities. But experts estimate that only one-third of us can confidently understand, analyse and argue with data. This keynote will address why Data Literacy must be regarded as a critical consideration for creating a data-driven culture and arm attendees with pragmatic advice and recommendations.
  • #3 All this stuff is created wiith Catherine D’Ignazio from Emerson College. I’ve been doing workshops with orgs on data literacy for 10 years. The first one was terrible, but I’ve learned a lot since then. Usually data efforts focus on the first two, but we focus on the third – bringing people together
  • #4 This is the key point.
  • #5 There are lots of barriers to accomplishing those. Checkout my recent blog post for details on these. I’m sure many of you have experienced these; they are sourced from our 10 years of workshops with industry, academia, and non-profits.
  • #6 People think about data as a technology problem, but building a data culture requires you to decouple technology from process. You need to work on both, otherwise you’re just building technological fluency and not helping your team learn to read, write, and argue with data.
  • #8 The process of working with data is ripe with opportunities for engagement with otherwise marginalized populations (that’s don’t “speak” data)
  • #9 A lightweight, self-service curriculum of activities you fan run with people of different literacy levels
  • #10 This is some of what it looks like. The arts is the best tool we have for bringing people together
  • #11 Some concrete example from industries and collaborations
  • #12 Some concrete example from industries and collaborations
  • #13 Some concrete example from industries and collaborations
  • #17 The Yemen example is one of the discussions that came up after we had a sketch a story activity in RBC. We discussed how thinking through the colours and symbols when analysing text could have been applied in this use case. Ask the participants what other local examples they can share.
  • #18 The Yemen example is one of the discussions that came up after we had a sketch a story activity in RBC. We discussed how thinking through the colours and symbols when analysing text could have been applied in this use case. Ask the participants what other local examples they can share.
  • #19 The Yemen example is one of the discussions that came up after we had a sketch a story activity in RBC. We discussed how thinking through the colours and symbols when analysing text could have been applied in this use case. Ask the participants what other local examples they can share.
  • #20 Some concrete example from industries and collaborations
  • #21 The process of working with data is ripe with opportunities for engagement with otherwise marginalized populations (that’s don’t “speak” data)