Download as PDF, PPTX
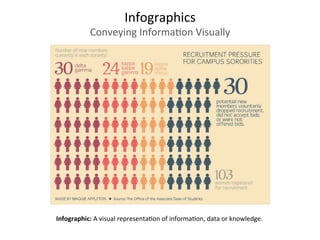
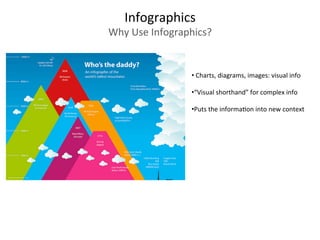
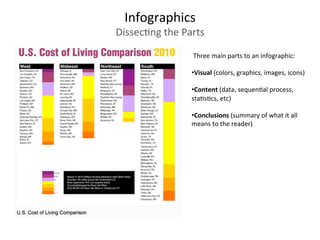
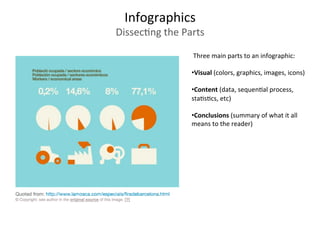
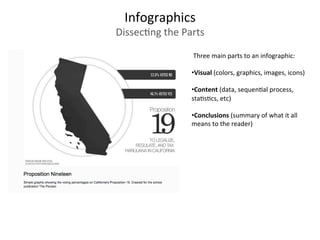
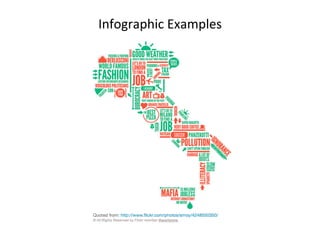
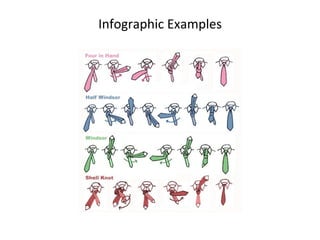
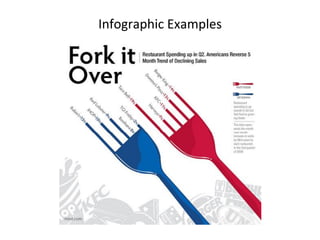
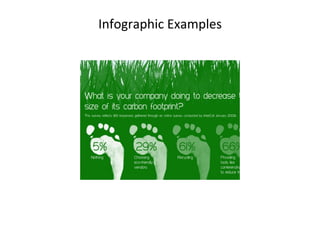

The document discusses infographics, which are visual representations of information or data. It explains that infographics use charts, diagrams and images to convey complex information visually. There are three main parts to an infographic: the visual elements, the content or data, and conclusions. The document provides tips for designing effective infographics, such as being concise, visual, transparent and creative. It also lists some online tools that can be used to create infographics and provides examples of well-designed infographics.


