Download to read offline
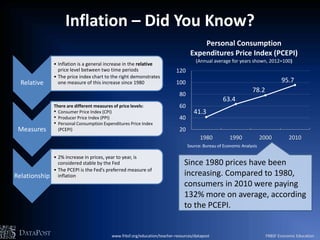
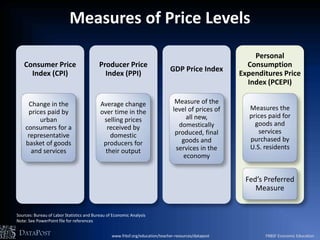
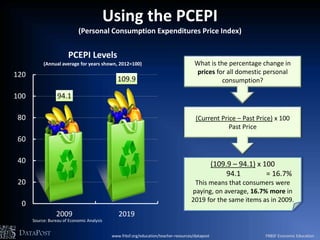
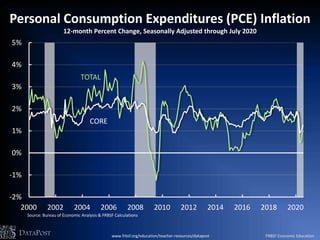
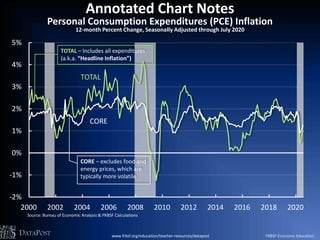

The document provides an overview of inflation and its measurement, focusing on the Personal Consumption Expenditures Price Index (PCEPI) as the Federal Reserve's preferred measure. It highlights that prices have increased significantly since 1980, with consumers paying 132% more on average by 2010. Additionally, it discusses various price indexes like the Consumer Price Index (CPI) and Producer Price Index (PPI) that track price changes in the economy.


![What is Inflation? [Examining the PPI, CPI, and PCE Indices]](https://cdn.slidesharecdn.com/ss_thumbnails/inflationcpimonetaryandcostpushinflation2-250524044427-996efc14-thumbnail.jpg?width=640&height=640&fit=bounds)


